
Total above-ground biomass at harvest and ear density are two important traits that characterize wheat genotypes. Two experiments were carried out in two different sites where several genotypes were grown under contrasted irrigation and nitrogen treatments. A high spatial resolution RGB camera was used to capture the residual stems standing straight after the cutting by the combine machine during harvest. It provided a ground spatial resolution better than 0.2 mm. A Faster Regional Convolutional Neural Network (Faster-RCNN) deep-learning model was first trained to identify the stems cross section. Results showed that the identification provided precision and recall close to 95%. Further, the balance between precision and recall allowed getting accurate estimates of the stem density with a relative RMSE close to 7% and robustness across the two experimental sites. The estimated stem density was also compared with the ear density measured in the field with traditional methods. A very high correlation was found with almost no bias, indicating that the stem density could be a good proxy of the ear density. The heritability/repeatability evaluated over 16 genotypes in one of the two experiments was slightly higher (80%) than that of the ear density (78%). The diameter of each stem was computed from the profile of gray values in the extracts of the stem cross section. Results show that the stem diameters follow a gamma distribution over each microplot with an average diameter close to 2.0 mm. Finally, the biovolume computed as the product of the average stem diameter, the stem density, and plant height is closely related to the above-ground biomass at harvest with a relative RMSE of 6%. Possible limitations of the findings and future applications are finally discussed.
Authors: Toreti ; Andrea ; A. Belward ; I. Perez‐Dominguez ; G. Naumann ; J. Luterbacher ; O. Cronie ; L. Seguini ; G. Manfron ; R. Lopez-Lozano ; B. Baruth ; M. van den Berg ; F. Dentener ; A. Ceglar ; T. Chatzopoulos ; M. Zampieri
Temperature and precipitation are the most important factors responsible for agricultural productivity variations. In 2018 spring/summer growing season, Europe experienced concurrent anomalies of both. Drought conditions in central and northern Europe caused yield reductions up to 50% for the main crops, yet wet conditions in southern Europe saw yield gains up to 34%, both with respect to the previous 5‐years' mean. Based on the analysis of documentary and natural proxy based seasonal paleoclimate reconstructions for the past half millennium, we show that the 2018 combination of climatic anomalies in Europe was unique. The water seesaw, a marked dipole of negative water anomalies in central Europe and positive ones in southern Europe, distinguished 2018 from the five previous similar droughts since 1976. Model simulations reproduce the 2018 European water seesaw in only four years out of 875 years in historical runs and projections. Future projections under the RCP8.5 scenario show that 2018‐like temperature and rainfall conditions, favourable to crop growth, will occur less frequent in southern Europe. In contrast, in central Europe high‐end emission scenario climate projections show that droughts as intense as 2018 could become a common occurrence as early as 2043. Whilst integrated European and global agricultural markets limited agro‐economic shocks caused by 2018's extremes, there is an urgent need for adaptation strategies for European agriculture to consider futures without the benefits of any water seesaw.
Authors: Meroni, Michelen; Fasbender, Dominique; Lopez-Lozano, Raul; Migliavacca, Mirco
The application of detailed process-oriented simulation models for gross primary production (GPP) estimation is constrained by the scarcity of the data needed for their parametrization. In this manuscript, we present the development and test of the assimilation of Moderate Resolution Imaging Spectroradiometer (MODIS) satellite Normalized Difference Vegetation Index (NDVI) observations into a simple process-based model driven by basic meteorological variables (i.e., global radiation, temperature, precipitation and reference evapotranspiration, all from global circulation models of the European Centre for Medium-Range Weather Forecasts). The model is run at daily time-step using meteorological forcing and provides estimates of GPP and LAI, the latter used to simulate MODIS NDVI though the coupling with the radiative transfer model PROSAIL5B. Modelled GPP is compared with the remote sensing-driven MODIS GPP product (MOD17) and the quality of both estimates are assessed against GPP from European eddy covariance flux sites over crops and grasslands. Model performances in GPP estimation (R² = 0.67, RMSE = 2.45 gC m⁻² d⁻¹, MBE = -0.16 gC m⁻² d⁻¹) were shown to outperform those of MOD17 for the investigated sites (R2 = 0.53, RMSE = 3.15 gC m⁻² d⁻¹, MBE = -1.08 gC m⁻² d⁻¹).
Authors: Yan Guangjian; Hu Ronghai; Luo Jinghui; Marie, Weiss; Jiang Hailan; Mu Xihan; Xie Donghui; Zhang Wuming
Leaf area index (LAI) is a key parameter of vegetation structure in the fields of agriculture, forestry, and ecology. Optical indirect methods based on the Beer-Lambert law are widely adopted in numerous fields given their high efficiency and feasibility for LAI estimation. These methods have undergone considerable progress in the past decades, thereby making them operational in ground-based LAI measurement and even in airborne estimation. However, several challenges remain, given the requirement of increasing accuracy and new applications. Clumping effect correction attained significant progress for continuous canopies with non-randomly disturbed leaves while non-continuous canopies are rarely studied. Convenient and operational measurement of leaf angle distribution and woody components is lacked. Accurate and comprehensive validations are still very difficult due to the limitations of direct measurement. The introduction of active laser scanning technology is a driving force for addressing several challenges, but its three-dimensional information has not been fully explored and utilized. In order to update the general knowledge and identify the possible error source, this study comprehensively reviews the temporal development, theoretical framework, and issues of indirect LAI measurement, followed by current methods, instruments, and platforms. Latest methods and instruments are introduced and compared to traditional ones. Current challenges, recent advances, and future perspectives are discussed to provide recommendations for further research.
This study assesses crop residues in the EU from major crops using empirical models to predict crop residues from yield statistics; furthermore it analyses the inter‐annual variability of those estimates over the period 1998‐2015, identifying its main drivers across Europe. The models were constructed based on an exhaustive collection of experimental data from scientific papers for the crops: wheat, barley, rye, oats, triticale, rice, maize, sorghum, rapeseed, sunflower, soybean, potato and sugarbeet. We discuss the assumptions on the relationship between yield and the harvest index, adopted by previous studies, to interpret the experimental data, quantify the uncertainties of these models, and establish the premises to implement them at regional scale –i.e NUTS level 3– within the EU. To cope this, we created a consolidated sub‐national statistical data along with an algorithm able to aggregate (figures are provided at country level) and disaggregate (production at 25 km grid is provided as supplementary material) estimates. The total lignocellulosic biomass production in the EU28 over the review period, according to our models, is 419 Mt, from which wheat is the major contributor (155 Mt). Our results show that maize and rapeseed are the two crops with the highest residue yield, respectively 8.9 and 8.6 t ha‐1. The spatial analysis revealed that these three crops, which, according to our results, are feedstocks highly suitable a priori for second generation biofuels in the EU and are unevenly distributed across Europe. Weather fluctuation was identified as the major driver in residue production from cereals, while, in the case of starch crops and oilseeds – which are predominant in northern Europe – corresponded to the marked production trend likely influenced by the agricultural policies and agro‐management over the review period. Additionally, our study highlights the limitation of such empirical models in quantifying lignocellulosic biomass in the EU.
Authors: Madec, Simon; Jin, Xiuliang; Lu, Hao; De Solan, Benoit; Liu, Shouyang; Duyme, Florent; Heritier, Emmanuelle; Baret, Frederic
Wheat ear density estimation is an appealing trait for plant breeders. Current manual counting is tedious and inefficient. In this study we investigated the potential of convolutional neural networks (CNNs) to provide accurate ear density using nadir high spatial resolution RGB images. Two different approaches were investigated, either using the Faster-RCNN state-of-the-art object detector or with the TasselNet local count regression network. Both approaches performed very well (rRMSE approximate to 6%) when applied over the same conditions as those prevailing for the calibration of the models. However, Faster-RCNN was more robust when applied to a dataset acquired at a later stage with ears and background showing a different aspect because of the higher maturity of the plants. Optimal spatial resolution for Faster-RCNN was around 0.3 mm allowing to acquire RGB images from a UAV platform for high-throughput phenotyping of large experiments. Comparison of the estimated ear density with in-situ manual counting shows reasonable agreement considering the relatively small sampling area used for both methods. Faster-RCNN and in-situ counting had high and similar heritability (H-2 approximate to 85%), demonstrating that ear density derived from high resolution RGB imagery could replace the traditional counting method.
To better understand the vegetation indices for Chlorophyll, we need to take a few moment to introduce you to Chlorophyll. In fact, as you may already know, Chlorophyll is the green pigment present in the leaves and plays an important role in photosynthesis i.e. conversion of light energy to chemical energy. Hence, it is a direct indicator of the plant's primary production and photosynthetic potential. It can be also used to understand the plant's nutrient status, senescence and stress due to water, disease outbreak, etc. Several indices have been developed to estimate the chlorophyll content of the leaves as follows:
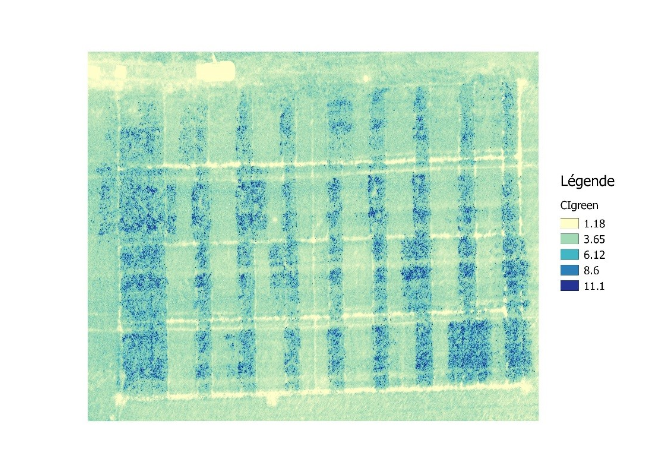
The chlorophyll index is used to calculate the total chlorophyll content of the leaves. The CIgreen and CIred-edge values are sensitive to small variations in the chlorophyll content and consistent across most species.
CI green = ρNIR / ρgreen – 1 = ρ730/ρ530 – 1
CI red-edge = ρNIR/ρred_edge – 1 = ρ850/ρ730 – 1
The red-edge band is a narrow band in the vegetation reflectance spectrum between the transition of red to near infra-red.
The total chlorophyll content is linearly correlated with the difference between the reciprocal reflectance of green/ red-edge bands and the NIR band. Hence, a CIgreen- calculated using the observation in the green region (570 nm) and a CIred-edge – using observations in the red-edge (730 nm) are widely used.
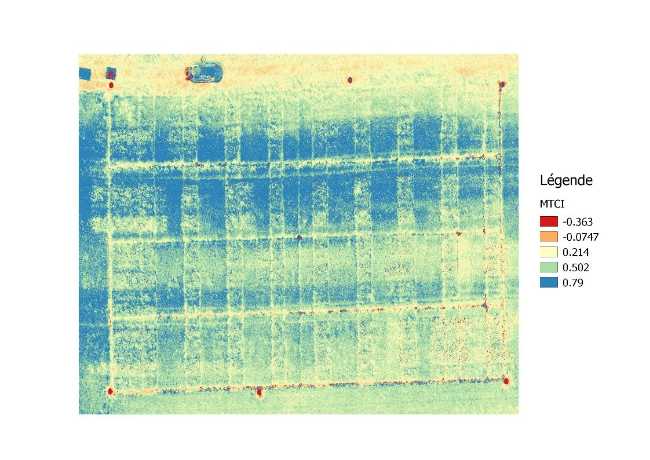
The MTCI was designed to estimate chlorophyll content especially from Merris datasets. This index is sensitive to a wide range of chlorophyll concentration since the reflectance from the NIR, red-edge and red bands are used in the calculation.
MTCI =(ρ850-ρ730)/(ρ730-ρ675)
MCARI gives a measure of the depth of chlorophyll absorption and is very sensitive to variations in chlorophyll concentrations as well as variations in Leaf Area Index (LAI). MCARI values are not affected by illumination conditions, the background reflectance from soil and other non-photosynthetic materials observed.
MCARI = ((ρ850-ρ710) – 0.2 × (ρ850-ρ570)) / ρ710
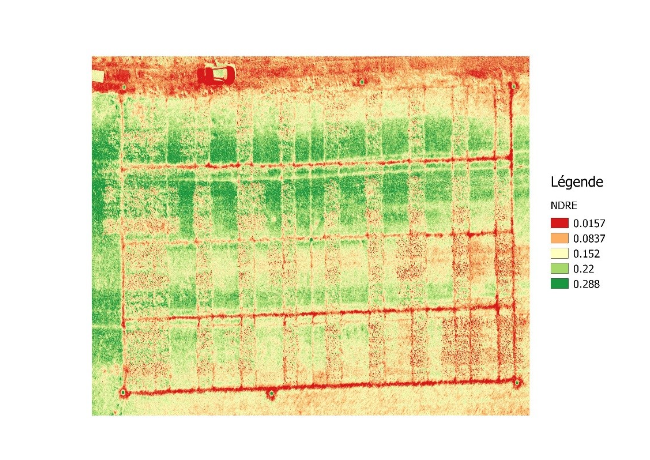
The Normalized Difference Red-Edge Index can be calculated only if the red-edge band is available. The red-edge band is very sensitive to medium to high levels of chlorophyll content.
Hence, red-edge is a good indicator of crop health in the mid to late stage crops where the chlorophyll concentration is relatively higher. Also, the NDRE could be used to map the within-field variability of foliar nitrogen to understand the fertilizer requirements of the crops.
NDRE = (ρNIR-ρred_edge)/(ρNIR+ρred_edge)
The red-edge band is capable of penetrating the leaf better than the red band that is absorbed by the chlorophyll in the first few layers.
The ND705 has a strong linear correlation with FPAR (fraction of Absorbed Photosynthetically Active Radiation) which is an indicator of chlorophyll at the canopy level. ND550 is a good indicator of GAI (Green Area Index). In addition, these indices are sensitive to senescence and are invariant to chlorophyll florescence.
ND705 = (ρ850-ρ730) / (ρ850+ρ730)
ND550 = (ρ850-ρ570) / (ρ850+ρ570)
The ND705 and ND550 are indicators of chlorophyll-a (which is the primary photosynthetic pigment).
This index gives a measure the amount of Chlorophyll-ab content at the field-level from close-range images of mm to cm resolution over sugar beet canopy. The index value is little influenced by the crop canopy structure and thus is insensitive to variations of GF (green fraction) and GAI (Green area index).
mNDblue = -(ρλ – ρ450) / (ρ850 + ρ450) λϵ{530,570,675,730}
Also, in order to know more about vegatation indices in general, we encourage you to read our article about the basics of vegetation indices
At Hiphen, we dedicated the past five years to developing innovative methods for plant health measurements and give life to game-changing industrial solutions. Today, we are proud to see Hiphen and Moët Hennessy savoir-faire teaming up to keep making each grape and berry count.
The technology we deployed involves robotics and advanced Deep Learning techniques that can detect the presence of diseases, such as Botrytis, in each crate of grape flowing through the supply chain during harvest. The algorithms we developed therefore provides a quality indicator to each crate of grape and can assist Moët Hennessy experts during the sorting of the grapes at the wine press facilities.
We've made a specific webinar on this topic, so check it out to find out all about this initiative and have the opportunity to ask questions about our AI solution, the Deep Learning techniques we used, and how this type of technology has found its place in Moët Hennessy's unequaled winemaking savoir-faire.
Authors: Brede, Benjamin; Gastellu-Etchegorry, Jean-Philippe; Lauret, Nicolas; Baret, Frederic; Clevers, Jan G. P. W.; Verbesselt, Jan; Herold, Martin
Land Surface Phenology (LSP) and Leaf Area Index (LAI) are important variables that describe the photosynthetically active phase and capacity of vegetation. Both are derived on the global scale from optical satellite sensors and require robust validation based on in situ sensors at high temporal resolution. This study assesses the PAI Autonomous System from Transmittance Sensors at 57 degrees (PASTiS-57) instrument as a low-cost transmittance sensor for simultaneous monitoring of LSP and LAI in forest ecosystems. In a field experiment, spring leaf flush and autumn senescence in a Dutch beech forest were observed with PASTiS-57 and illumination independent, multi-temporal Terrestrial Laser Scanning (TLS) measurements in five plots. Both time series agreed to less than a day in Start Of Season (SOS) and End Of Season (EOS). LAI magnitude was strongly correlated with a Pearson correlation coefficient of 0.98. PASTiS-57 summer and winter LAI were on average 0.41 m(2)m(-2) and 1.43 m(2)m(-2) lower than TLS. This can be explained by previously reported overestimation of TLS. Additionally, PASTiS-57 was implemented in the Discrete Anisotropic Radiative Transfer (DART) Radiative Transfer Model (RTM) model for sensitivity analysis. This confirmed the robustness of the retrieval with respect to non-structural canopy properties and illumination conditions. Generally, PASTiS-57 fulfilled the CEOS LPV requirement of 20% accuracy in LAI for a wide range of biochemical and illumination conditions for turbid medium canopies. However, canopy non-randomness in discrete tree models led to strong biases. Overall, PASTiS-57 demonstrated the potential of autonomous devices for monitoring of phenology and LAI at daily temporal resolution as required for validation of satellite products that can be derived from ESA Copernicus' optical missions, Sentinel-2 and -3.
Authors: Roujean, Jean-Louis; Olioso, Albert; Ceschia, Eric; Hagolle, Olivier; Weiss, Marie
Satellite Sentinel-2 offers a global coverage of the Earth at the frequency of a few days with pixel size ranging from 10 to 20 meters. Such spatio-temporal resolution fosters an advanced research in agriculture. Accounting for BRDF (Bidirectional Reflectance Distribution Function) information is required both for target monitoring and surface albedo estimate. BRDF sampling being limited from HR (High Resolution) sensors, the added-value of the BRDF 300m from PROBA-V instrument is assessed. Results are shown for the seasonal cycles 2016 and 2017 using parameterized and detailed radiation transfer models. The validation is carried on for anchor ICOS (Integrated Carbon Observation System) stations located on the French territory.