
Note: This is a video-only post. The original article body contains only an embedded YouTube video (https://www.youtube.com/watch?v=W3g1DVosRhk) and no text content.
Note: This is a video-only post. The original article body contains only an embedded YouTube video (https://www.youtube.com/watch?v=Su_7QlGDj9k) and no text content.
Note: This is a video-only post. The original article body contains only an embedded YouTube video (https://www.youtube.com/watch?v=zGfpO7Gfk7g) and no text content.
Join the agtech community set to improve wheat cultivar breeding selection – the plant phenotyping Empire needs you!
In the last round of online knowledge sharing sessions we organised for you during the April 2020 global lockdown period, we insisted on 3 key messages:
1: Hiphen is an expert in turning the latest scientific advancements in operational solutions for our clients. This is the reason why we care deeply about introducing bullet proof solutions that can work across different field conditions. We do not want to change the data processing engine everytime we jump on a different journey;
2: We care about being transparent with you so that you understand the methodology we use and you can engage with it to customize it to your needs. With all the knowledge shared last April, we do hope that this message came across – please please please, work with a plant phenotyping partner from whom you understand the methodology, do not opt for a 'black box' approach and feeling, you will not far with that;
3: We care about being agile to allow you to scale. We believe that there is little vamue in investing in a method that will only work on a specific domain and that you cannot deploy to your regional, national or global footprint.
With the Global Wheat Challenge, here is a chance to develop an AI-powered solution that can deliver on all three missions. You can replay our webinar on this topic HERE to get more detailed information.
The Global Wheat Challenge is an international computer science competition to count wheat ears more effectively, using AI-powered image analysis. All the details about this kaggle competition can be found HERE. The competition will run from May 4th to August 4th 2020 and is made possible thanks to the collaboration of an International consortium of research institutions that compiled over 190 000 annotated images of wheat heads across 3 continents. A cash prize of 15 000 Dollars awaits the data science teams that will develop the best AI-powered wheat heads counting model.
Global WHEAT Dataset is the first large-scale dataset for wheat head detection from field optical images. It includes a very large range of cultivars from differents continents. Wheat is a staple crop grown all over the world and, consequently, interest in wheat phenotyping spans across the globe. Therefore, it is important that AI-powered models developed for wheat phenotyping, such as wheat head detection networks, can be applied across different growing environments around the world.
Remember, the plant phenotyping Empire needs you!
Keep safe!
A Vegetation Index is a single value calculated by transforming the observations from multiple spectral bands. It is used to enhance the presence of green, vegetation features and thus help to distinguish them from the other objects present in the image. Depending on the transformation method and the spectral bands used, different aspects pertaining to the vegetation cover in the image could be evaluated say, the percentage of vegetation cover, amount of chlorophyll content, leaf area index and so on.
All the ratio indexes, in general, are independent of the illumination conditions at the time of acquisition and slope effects.
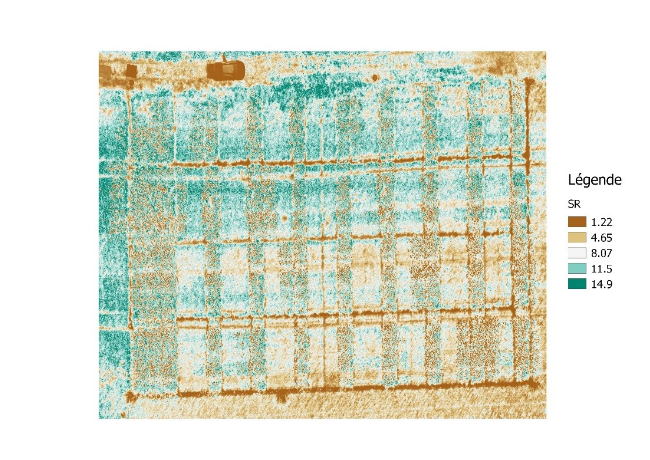
This is the simplest VI which is a ratio between the reflectance recorded in the Near Infra-Red (NIR) and Red bands. This is a quick way to distinguish green leaves from other objects in the scene and estimate the relative biomass present in the image. Also, this value may be very useful in distinguishing stressed vegetation from non-stressed areas.
Simple Ratio = ρNIR / ρRed = ρ850 / ρ675
According to the spectral signature of green leaves, they exhibit very low reflectance in the Red and Blue regions (leaves reflect more in the green region and hence appear green). However, the reflectance is relatively higher in the NIR region. Thus, the SR value is close to 1 when the object has similar reflectance in both Red and NIR bands – for example, soil. Whereas, for a green object the value would be much greater than 1.
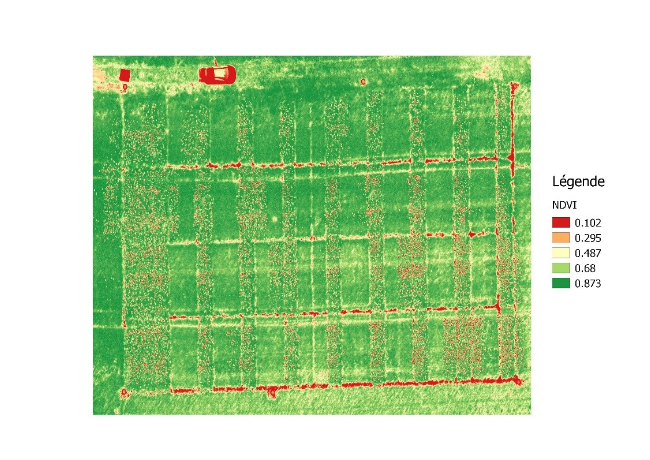
This is one of the most commonly used method for monitoring the percentage of green cover in an area. Since it is a ratio, this index is invariant to the difference in illumination conditions, slope, seasons, etc. and thus suitable for crop monitoring throughout the growth season. It is calculated by taking a ratio between the difference of reflectance from NIR and Red bands and the sum of reflectance from NIR and Red bands.
NDVI = (ρNIR-ρRed) / (ρNIR+ρRed) = (ρ850-ρ675) / (ρ850+ρ675)
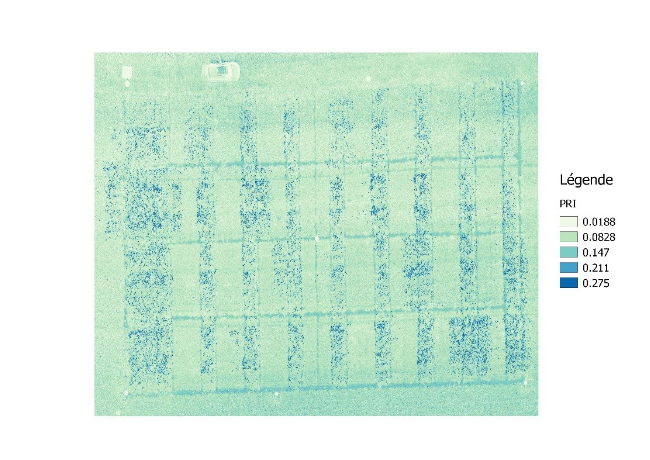
The Photochemical Reflectance Index is a measure of the light-use efficiency of foliage and thus is primarily used as an indicator of water stress and for the assessment of carbon-dioxide uptake by plants.
PRI = (ρ570-ρ530) / (ρ570+ρ530)
It is sensitive to the variations in the carotenoid pigments (for example, xanthophyll) in the leaves. These carotenoid pigments are involved in converting the absorbed photosynthetic radiation into fixed carbon.
If you want to know more about vegetations indices, take a look at our article about Vegetation Indices on Chlorophyll Content !
Authors: Sylvain Jay, Frédéric Baret, Dan Dutartre, Ghislain Malatesta, Stéphanie Héno, Alexis Comar, Marie Weiss, Fabienne Maupas
The recent emergence of unmanned aerial vehicles (UAV) has opened a new horizon in vegetation remote sensing, especially for agricultural applications. However, the benefits of UAV centimeter-scale imagery are still unclear compared to coarser resolution data acquired from satellites or aircrafts. This study aims (i) to propose novel methods for retrieving canopy variables from UAV multispectral observations, and (ii) to investigate to what extent the use of such centimeter-scale imagery makes it possible to improve the estimation of leaf and canopy variables in sugar beet crops (Beta vulgaris L.). Five important structural and biochemical plant traits are considered: green fraction (GF), green area index (GAI), leaf chlorophyll content (Cab), as well as canopy chlorophyll (CCC) and nitrogen (CNC) contents.
Based on a comprehensive data set encompassing a large variability in canopy structure and biochemistry …
Authors: Kaaviya Velumani, Simon Madec, Benoit de Solan, Raul Lopez-Lozano, Jocelyn Gillet, Jeremy Labrosse, Stephane Jezequel, Alexis Comar, Frederic Baret
Accurate and timely observations of wheat phenology and, particularly, of heading date are instrumental for many scientific and technical domains such as wheat ecophysiology, crop breeding, crop management or precision agriculture. Visual annotation of the heading date in situ is a labour-intensive task that may become prohibitive in scientific and technical activities where high-throughput is needed. This study presents an automatic method to estimate wheat heading date from a series of daily images acquired by a fixed RGB camera in the field. A convolutional neural network (CNN) is trained to identify the presence of spikes in small patches. The heading date is then estimated from the dynamics of the spike presence in the patches over time. The method is applied and validated over a large set of 47 experimental sites located in different regions in France, covering three years with nine wheat cultivars.
Selection of sugar beet (Beta vulgaris L.) cultivars that are resistant to Cercospora Leaf Spot (CLS) disease is critical to increase yield. Such selection requires an automatic, fast, and objective method to assess CLS severity on thousands of cultivars in the field. For this purpose, we compare the use of submillimeter scale RGB imagery acquired from an Unmanned Ground Vehicle (UGV) under active illumination and centimeter scale multispectral imagery acquired from an Unmanned Aerial Vehicle (UAV) under passive illumination. Several variables are extracted from the images (spot density and spot size for UGV, green fraction for UGV and UAV) and related to visual scores assessed by an expert. Results show that spot density and green fraction are critical variables to assess low and high CLS severities, respectively, which emphasizes the importance of having submillimeter images to early detect CLS in field conditions. Genotype sensitivity to CLS can then be accurately retrieved based on time integrals of UGV- and UAV-derived scores. While UGV shows the best estimation performance, UAV can show accurate estimates of cultivar sensitivity if the data are properly acquired. Advantages and limitations of UGV, UAV, and visual scoring methods are finally discussed in the perspective of high-throughput phenotyping.
Many plant species have distinct optical properties between upper and lower leaf faces. These differences between faces are mainly attributed to the non-homogeneous distribution of absorbing and scattering materials within the leaf depth as well as particular surface features of both epidermises. We proposed the FASPECT model which is an evolution of the PROSPECT model to describe the differences in reflectance and transmittance between leaf faces. The upper and lower epidermis layers are characterized by distinct wavelength-independent reflectivities. Leaf mesophyll is made of a palisade and a spongy parenchyma layers using two parameters that describe the distribution of pigments and leaf structure between these two layers. As compared to the original PROSPECT model that treats the two leaf faces symmetrically, six additional parameters are required to describe the differences in leaf optical…
This is a video post. Watch the video on Hiphen's YouTube channel.