
In the digital agriculture realm, generating accurate plot patterns of your field trial is crucial for optimal crop monitoring to understand plant dynamics through time. To achieve this, the accurate and precise mapping of your plots, also known as plot mapping or parcellaire generation, plays a pivotal role. In recent years, the integration of deep learning techniques has revolutionized the process, enabled automated plot map generation, and offered a myriad of benefits for agricultural research and production. In this blog post, we will explore the importance of plot mapping, the advantages of using deep learning for automation, and how it impacts the agricultural ecosystem.
Traditionally, creating plot maps was a labor-intensive task involving manual measurement and mapping techniques. However, with the advent of deep learning algorithms, this process has been significantly streamlined. Deep learning models can automatically segment and delineate agricultural land into distinct plots, saving valuable time and effort for farmers, agronomists, and researchers. By automating this process, researchers can allocate their resources more efficiently and focus on other critical aspects of field trial management.
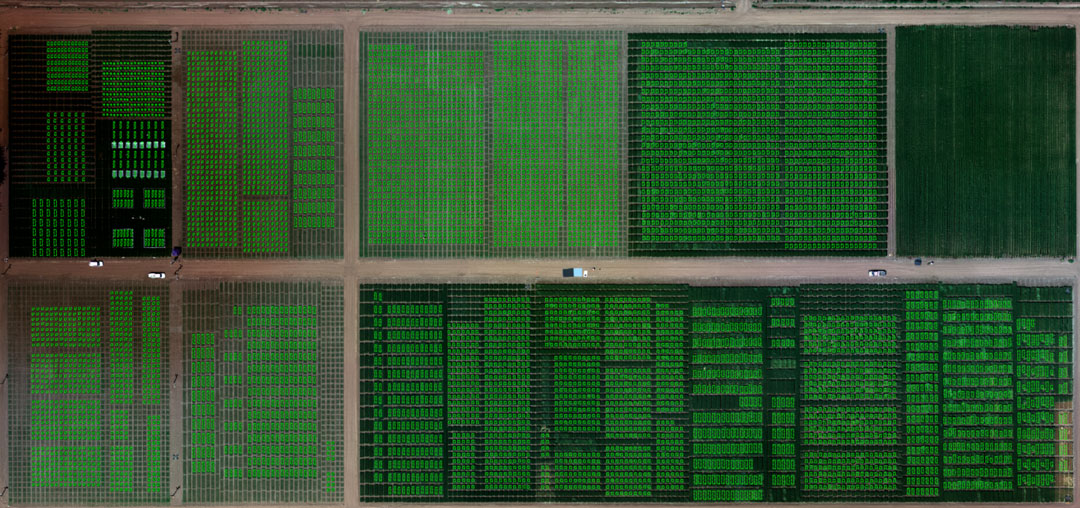
Big plots trial – Automating plot mapping with digital tools is highly helpful.
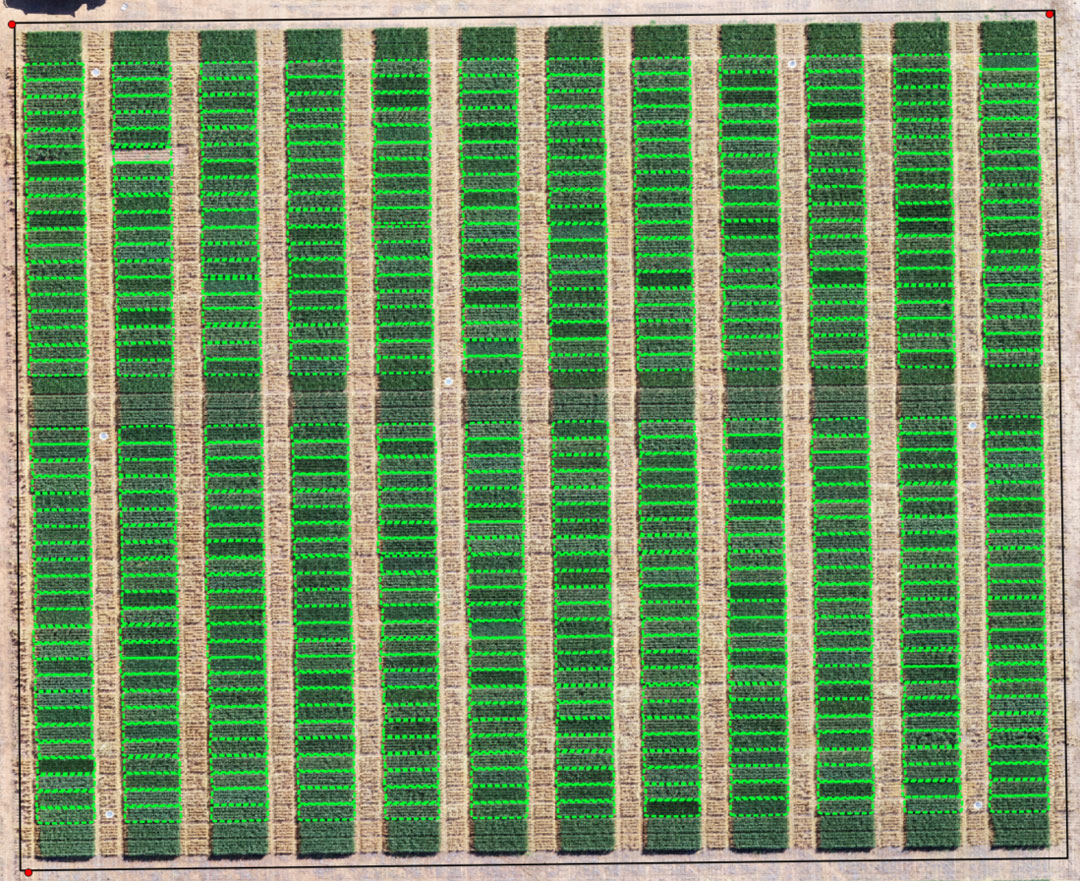
Small plots trial – Plot map still could be done manually but automation make it even more easy.
One of the remarkable advantages of using deep learning algorithms for plot map generation is the ability to achieve higher precision compared to manual mapping methods. Deep learning models can analyze aerial or satellite imagery, topographic data, and other relevant information to accurately identify plot boundaries.
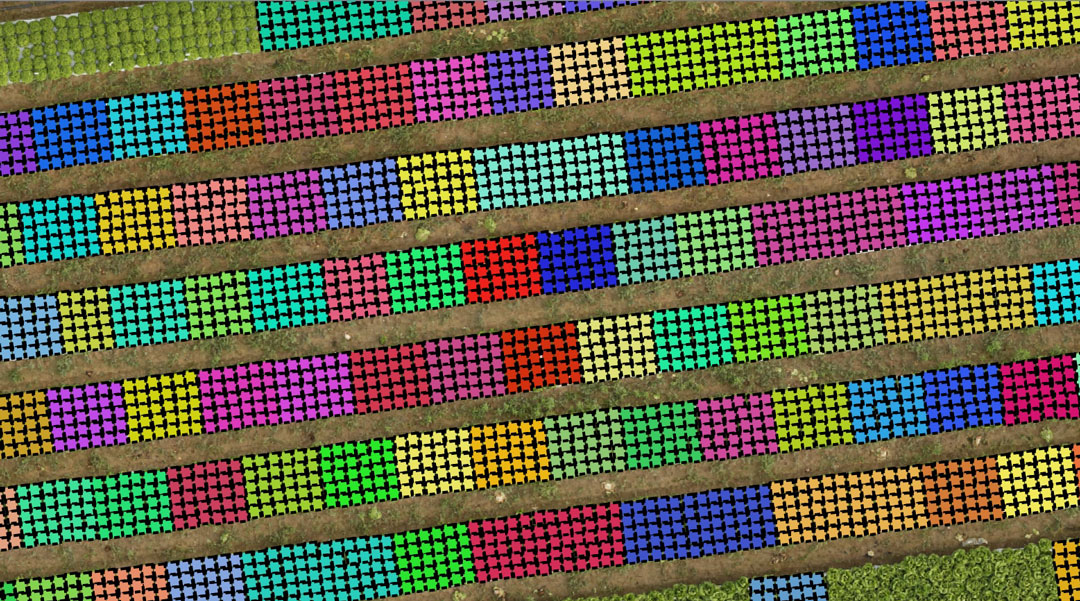
Example of automated plot mapping of salad field from UAV imagery.
Accurate plot maps generated through deep learning algorithms have a direct impact on the processing of phenotypic data collected for each plot. Phenotypic data is the result of plant assessments like canopy development, stress and disease resilience, yield predictions and more, is essential for agricultural research and breeding programs. By having precise plot boundaries, researchers can associate specific phenotypic data with corresponding plots, enabling more accurate analysis and interpretation of plant assessment distribution within the entire field trial. This granular information facilitates the identification of patterns, trends, and correlations, ultimately leading to informed decision-making for crop research and production.
To achieve reliable and versatile deep learning models for plot map generation, robust training datasets are paramount. High-quality datasets that encompass diverse geographical regions, crop types, and plot patterns variations and orientation are essential for training models to identify plot boundaries effectively within images captured in various environments. This emphasizes the need for collaboration and data sharing within the agricultural community to develop comprehensive datasets that can improve the accuracy and applicability of deep learning models for plot map generation.
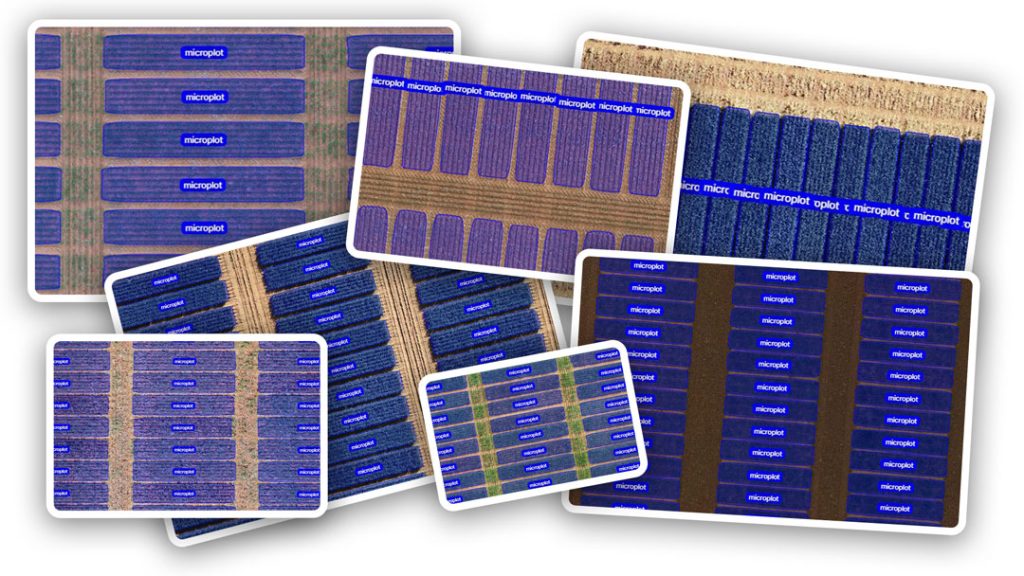
Set of images of plots in various conditions used for training DL models.
At Hiphen, we specialize in developing digital plant assessment solutions for agricultural research and production. We understand the significance of plot map generation and the transformative potential of deep learning in the agricultural sector. Our expertise lies in leveraging cutting-edge technologies to empower our clients with accurate and automated plot mapping alongside data acquisition and processing, enabling them to make better decisions and adapt to ever-changing environmental conditions. Through our tailored AI solutions, we strive to revolutionize the agriculture industry, promote sustainable practices, and enhance crop researchers productivity.
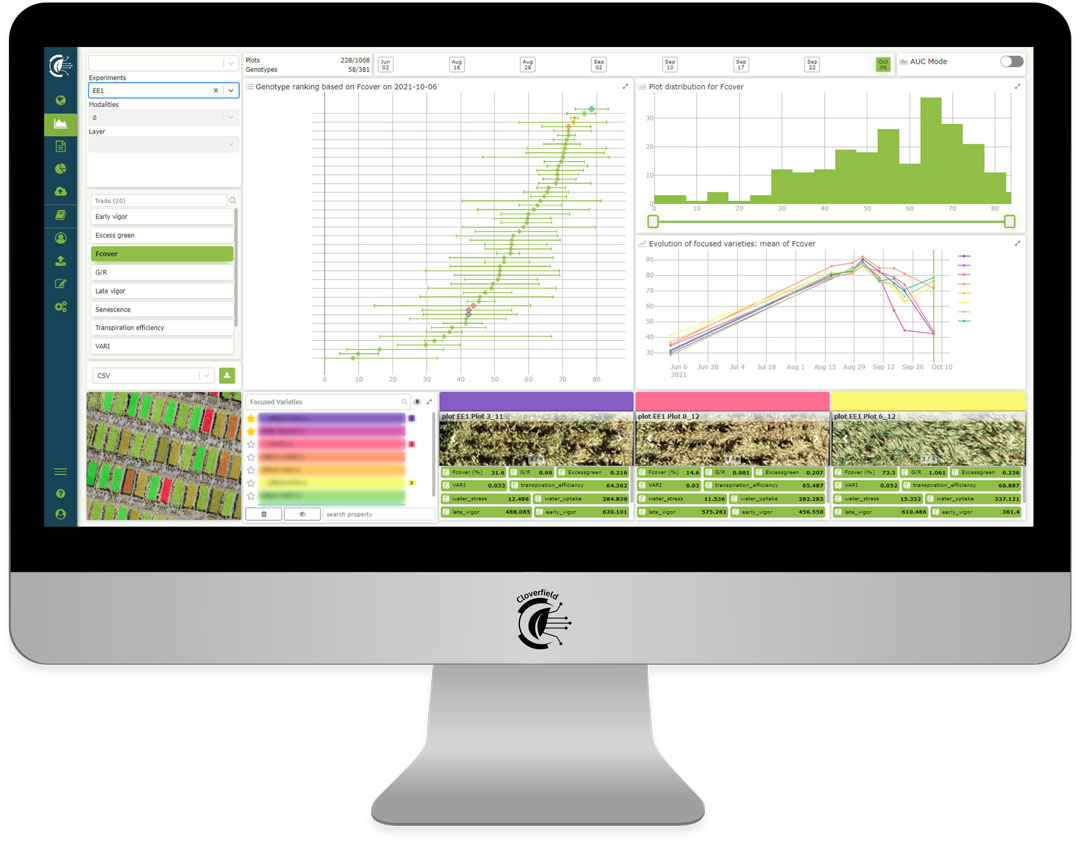
View of Hiphen's Cloverfield™ Data Platform.
Plot map generation holds immense importance for agricultural research and production. By utilizing deep learning algorithms, we can automate the process, saving time and improving precision. Accurate plot maps enable efficient resource allocation and precise data processing. However, it is vital to build robust training datasets to ensure the reliability and versatility of deep learning models. With Hiphen's AI methodologies, the agricultural industry can embrace innovation, make informed decisions, and adapt to the evolving needs.
Sincerely,
Your Hiphen Team.
Topic brought to you by Rhianna MCANENY – Image Processing Specialist @Hiphen.
In the agricultural imaging realm, working with multiple sensors at a time is often common since each sensor give access to a specific plant information, either related to the architectural, structural, biophysical, or reflectance properties of the plant. And interpreting the data collected from these sensors is required to compute what we usually call traits (i.e., plant assessments).
Now if we want to access more granular assessments, one way of doing it is to combine data from multiple sensors to superpose them and access more insightful and accurate information for agricultural research.
Enter the fascinating world of the pinhole camera model – a simplified yet powerful concept that forms the bedrock of computer vision. In this blog post, we'll explore the wonders of the pinhole camera model and its indispensable role in simulating the behavior of a camera for deeper granularity of phenotypic assessments in agricultural research and production.
At Hiphen we have experienced working with an array of cutting-edge industrial sensors, from RGB cameras to LiDAR, multispectral, thermal sensors and more, each providing valuable data to compute essential traits. Therefore, combining the data from these multiple sensors is crucial for gaining a comprehensive understanding of how plants are behaving in their environment. However, to achieve this, it is essential to be able to simulate and understand the geometric representation of a camera.
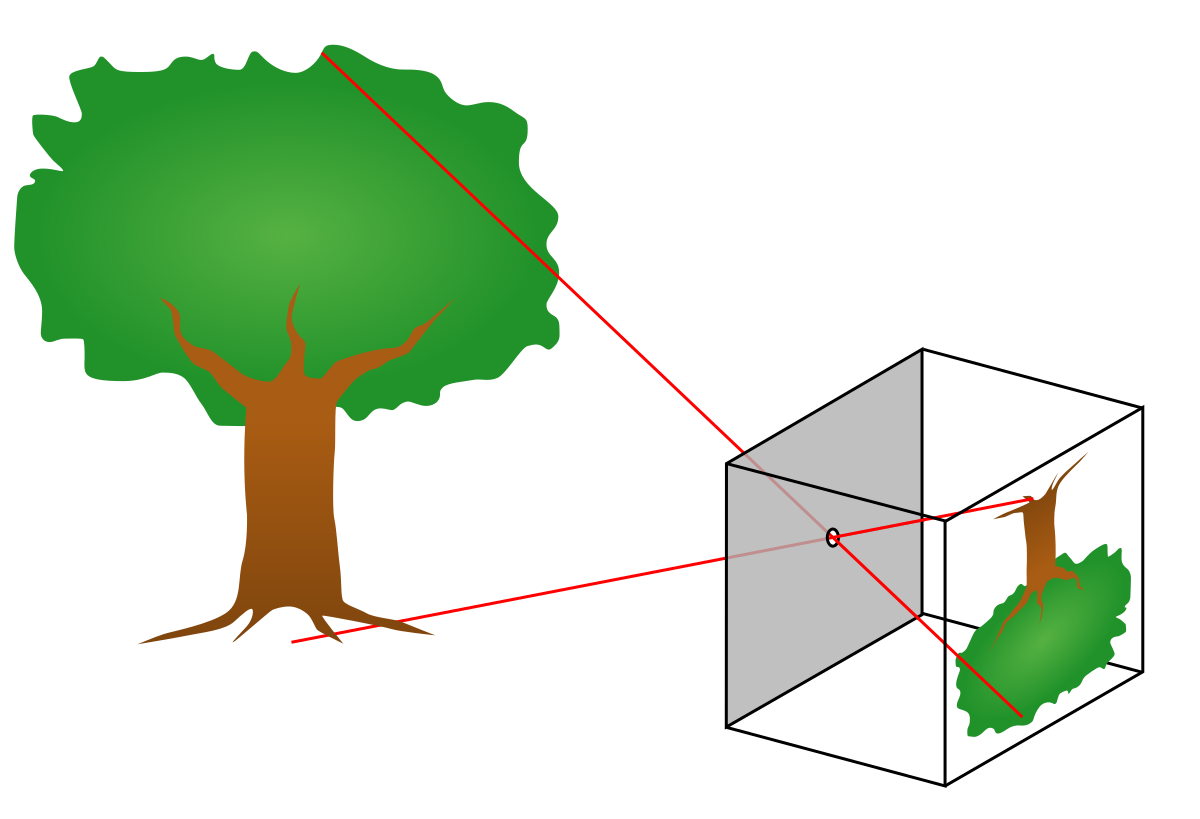
Early diagram of the pinhole camera model.
The pinhole camera model is a mathematical representation that describes how light from a three-dimensional scene interacts with an ideal pinhole camera to form a two-dimensional image. In this model, the camera aperture is represented as a point, and light travels in straight lines through the tiny hole before reaching the image sensor or film.
In agricultural imaging projects, researchers employ various sensors simultaneously to access diverse plant information. For example, RGB cameras provide valuable colour data, while 3D sensors allow for structural property assessments such as biovolume and height. By combining data from these sensors, researchers can achieve a more accurate and comprehensive understanding of plant traits. For instance, while LiDAR provides an excellent source of information for structural and architectural plant properties, it cannot provide data on leaf colour or temperature amongst other. However, by integrating LiDAR data with thermal data, researchers can precisely measure leaf temperature in a high-throughput fashion and with excellent repeatability. This level of data fusion enhances the accuracy and efficiency of plant trait assessments, revolutionizing digital phenotyping in agriculture and boosting agricultural research worldwide.
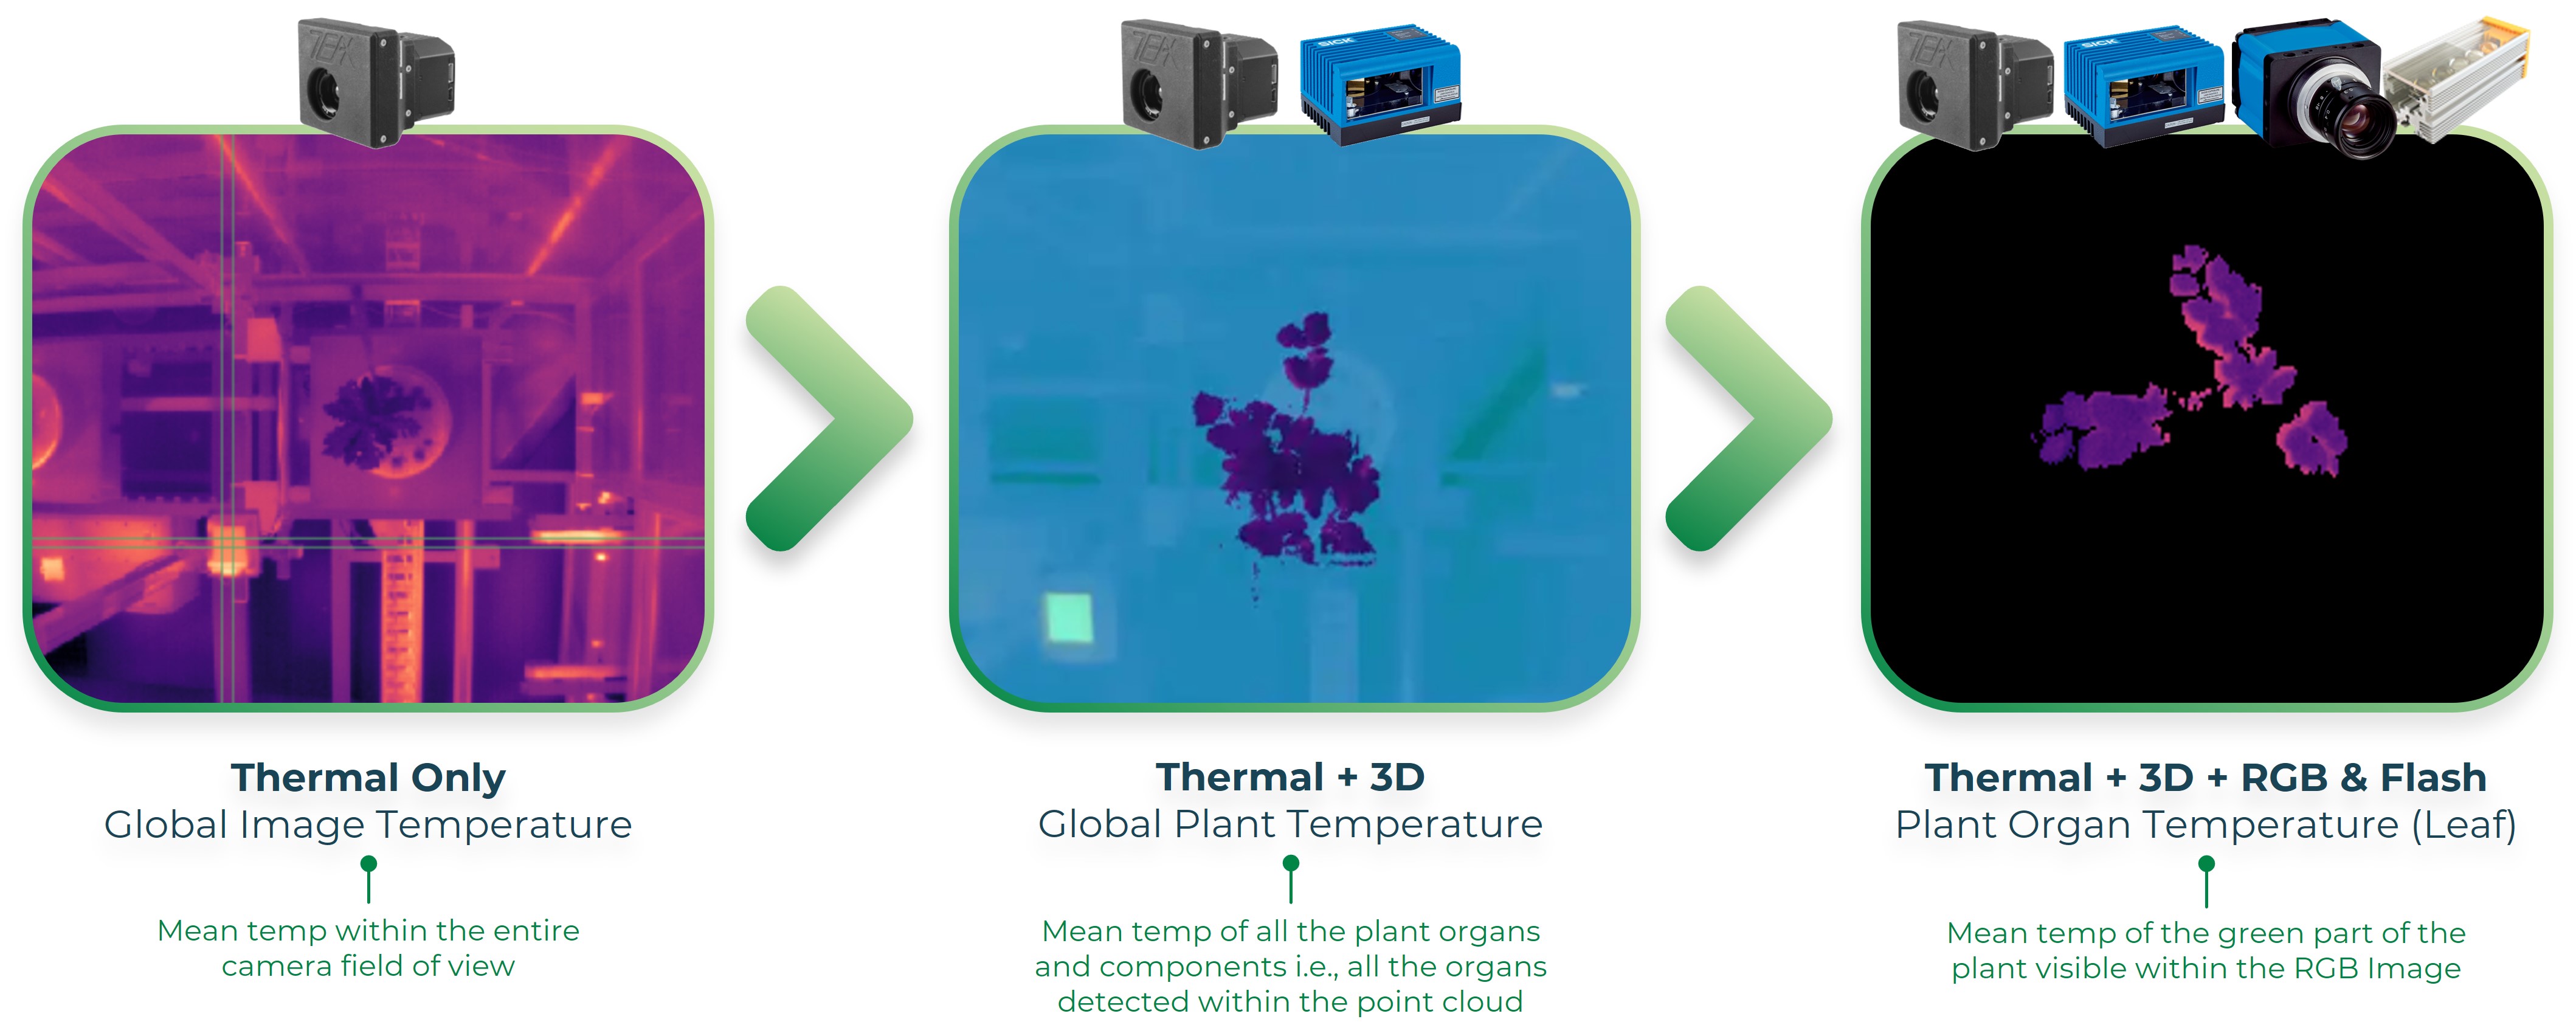
Digital phenotyping Data Fusion in practice. Leaf temperature can now be calculated precisely from imagery.
To superimpose data from different sensors, it's crucial to understand the geometric representation of the camera and ensure perfect alignment. The pinhole camera model allows researchers to put the 2D scene, captured by a thermal camera for example, into perspective to merge it with a 3D point cloud data for instance. To apply this methodology to phenotyping applications, researchers need to consider the sensors' positions on a 3-dimensional plane in comparison to the plant or tree being measured. Validating the alignment is a crucial step and involves extracting and comparing points from each image to ensure accurate layering.
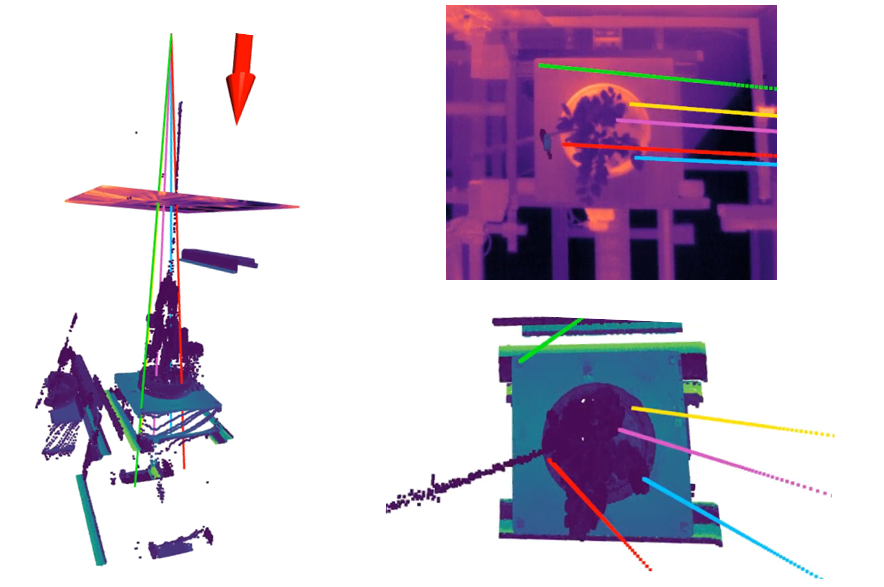
Diagram illustrating the accurate superposition of 3D (point cloud) data with 2D (Thermal) data.
The pinhole camera model has played a crucial role in digital phenotyping evolution, enabling plant phenotyping experts to combine data from different sensors to achieve a deeper granularity of plant trait assessment. By fusing information from various sensors like LiDAR and thermal cameras, researchers can gain a comprehensive understanding of plant health, stress tolerance and resilience, and understand genotypes behavior in their environment globally. It also gives access to traits assessments that we can't imagine having access to before. Such traits and mathematical calculations can be easily implemented into Hiphen's PhenoStation® for phenotyping in controlled conditions but could also be adapted to PhenoMobile® for field-focused phenotyping projects. So, with the latest advancements in data fusion and sensor technology, digital phenotyping is poised to lead the way in shaping tomorrow's agriculture.
Grab a time from one of our experts' calendar to discuss about your project.
Sincerely,
Your Hiphen Team.
Topic brought to you by Matthew Cassidy – R&D Engineer @Hiphen.
In the realm of phenotyping and agricultural research, image analytics has emerged as a powerful tool for extracting valuable insights. However, beneath the surface lies a crucial element that often goes unnoticed but plays a pivotal role in ensuring accurate analysis and interpretation georeferencing plots. Georeferencing involves assigning geographic coordinates to specific locations within field trials, enabling the reconstruction of Orthomosaic and facilitating precise data processing. In this blog post, we will explore the significance of georeferencing plots and shed light on the importance of coordinate systems, file formats, and advancements in technology for harnessing the full potential of image analytics in phenotyping.
Contrary to popular belief, the Earth is not a perfect sphere. It is slightly flattened at the poles and bulged at the equator, resulting in an irregular shape known as the geoid. Recognizing this, coordinate systems have been designed to account for the specific geodetic deformations in different regions, minimizing errors in positioning and representation. By aligning our data with accurate coordinate systems, we can ensure precise georeferencing and eliminate discrepancies that may arise during image analysis.
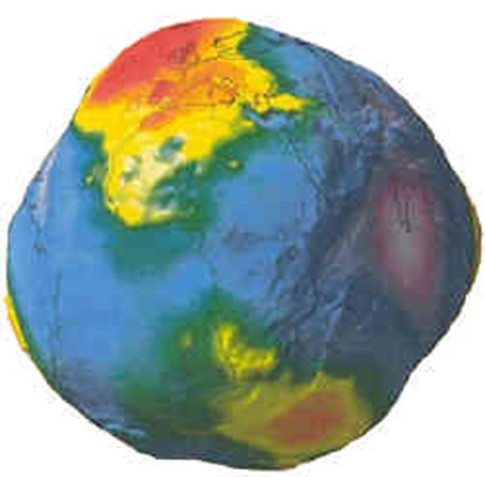
Geoid representing the Earth
Georeferencing plots within field trials allow to reconstruct Orthomosaic, a bird's-eye view of the field. An Orthomosaic comprises an RGB image superimposed with the associated plot map, which delineates the division of plots within the entire field trial. With a well-constructed Orthomosaic, we can accurately process data and deliver results through interactive and visual maps that showcase calculated traits for each individual plot. This approach enhances the clarity and interpretability of the obtained data, enabling data-driven decision-making. To ensure optimal plot patterns reconstruction we generally use Ground Control Points (GCP) that are positioned in the field and help identifying the orientation of the field, the origin of plot X1Y1 and make good alignments during the photogrammetry process.

Simplified process of creconstructing the orthomosaic of a field trial with GCPs.
Multiple coordinate systems exist to represent and locate points on the Earth's surface. Two widely used systems are WGS 84 (World Geodetic System 1984) and UTM (Universal Transverse Mercator). WGS 84 is a geodetic coordinate system that provides geographic coordinates, latitude, longitude, and altitude, based on a mathematical model describing the Earth's shape. UTM, on the other hand, is a projected coordinate system that divides the Earth into zones, allowing for more precise measurements within each zone. The choice of coordinate system depends on the specific requirements of the research, but in our experience, UTM coordinate systems have proven to be more efficient and precise as we can see with the example below:
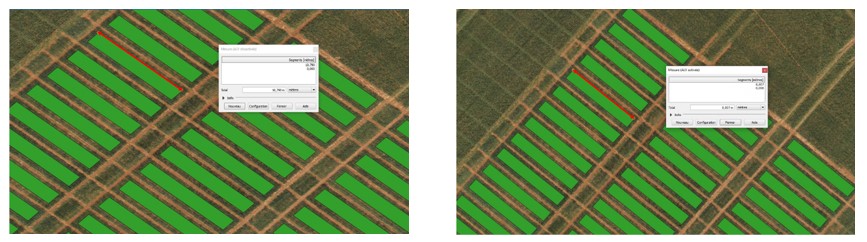
The importance of choosing the right coordinate system: on the left, the length of the plot is 10.79m, while on the right, it is 8.81m.
In addition to coordinate systems, the file format used for storing GPS coordinates is crucial for preserving geographic information. At Hiphen, we recommend specific formats such as shapefile, GeoJSON, geopackage, and KML. These formats ensure that the geographic information contained in the data is preserved and accessible during analysis. Choosing alternative formats like CSV can lead to the loss of vital information regarding the coordinate system used during data acquisition, hindering proper interpretation and analysis.
Thanks to advancements in drone, robotics, and GPS technologies, collecting GPS data has become increasingly automated and efficient. Metadata recorded directly in each image simplifies the process of gathering accurate georeferencing information. By leveraging these technological improvements, researchers can streamline their data collection processes and enhance the accuracy and reliability of plant assessments. This is mostly possible currently thanks to RTK technology. RTK means Real Time Kinematic, and this geolocation technology allows a centimeter-level positioning of the measured object, with real-time synchronization. Such technology is now implemented as standard in most of the latest generation of portable drones with GPS modules mounted on top of the devices, but at Hiphen we also use it as an independent module mounted on a stick, for georeferencing GCPs position, or even mounted on our autonomous PhenoMobile robots.
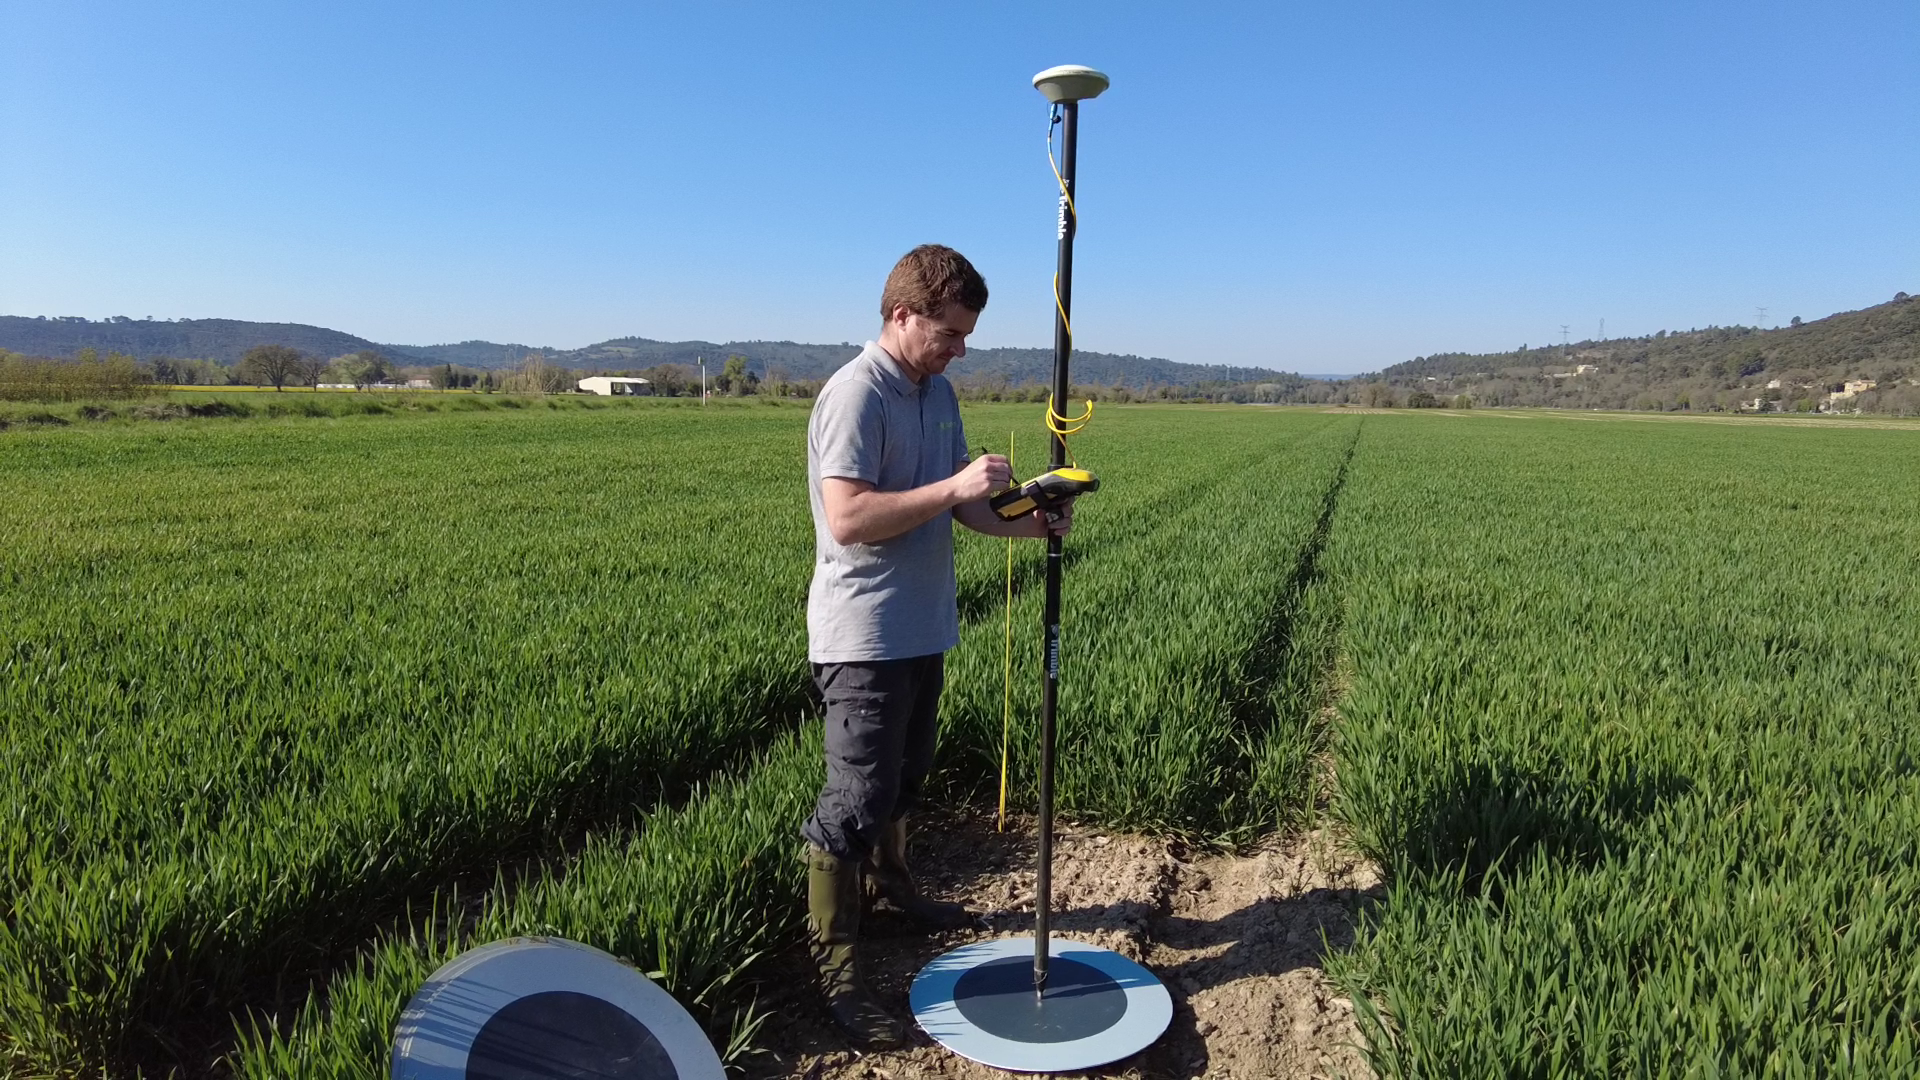
Field operator collecting GPS coordinates of ground control points with RTK precision device.
At Hiphen, we understand the importance of research-grade data collection and processing. Our experts work closely with researchers to define the best protocols for ensuring high-quality data collection. We navigate through various projected coordinate systems, adapting to the location of the field, to ensure the measurements of plots align accurately with real-world observations. By partnering with Hiphen, researchers can leverage our expertise in georeferencing plots and unlock the full potential of image analytics for phenotyping.
Georeferencing plots for image analytics is an essential but often overlooked aspect of phenotyping. The process of assigning geographic coordinates to field trial locations enables the reconstruction of Orthomosaic, leading to accurate data processing and visualization. Choosing appropriate coordinate systems, file formats, and harnessing advancements in technology empowers researchers to extract meaningful insights from their data. Collaborating with experts like Hiphen ensures that research-grade data collection and processing are achieved, ultimately advancing agricultural research, and propelling the field of phenotyping to new frontiers.
Sincerely,
Your Hiphen Team.
Topic brought to you by Adrien Vielix – Field Acquisition Manager @Hiphen.
AVIGNON, FRANCE (June 5, 2023).
Hiphen and SlantRange, two pioneers in the application of remote sensing, computer vision, and artificial intelligence for agriculture, today announced they are joining forces. Hiphen is acquiring SlantRange to form the leading source of advanced crop measurement and prediction solutions to crop science companies and agricultural enterprises worldwide.
Hiphen SA, of Avignon, France, has been delivering high value data to seed breeders, product developers, food processors, vertical farms, and crop researchers across the globe since 2014. Its core competencies in image analysis and solution systems have positioned it as a trusted partner in the industry. However, it only started exploring the North American market in 2020.
"We are excited about the synergy created by SlantRange's extensive patent portfolio and growing US customer base, which perfectly complements Hiphen's analytics capability and strong European presence," stated Alexis Comar, CEO of Hiphen. "This merger will provide us with a broader capability to make impactful analytical tools accessible to the global agriculture market."
Hiphen and Slantrange are joining forces to deliver insightful drone and satellite data to plant breeders in North America.
SlantRange, Inc., of San Diego, California, USA, has built a significant presence in the North American crop input market through its innovative methods for quantifying and predicting crop performance. It brings an extensive patent portfolio, deep engineering and data sciences skill base, and industry relationships to the partnership.
Michael Ritter, CEO of SlantRange, added, "We’re thrilled to complement Hiphen’s capabilities with our own. Through this combination we’ll be able to deliver an expanded, more responsive service portfolio across a broader global footprint."
The combined company will operate globally under the Hiphen brand and will accelerate new tools to market that accurately and efficiently quantify and predict plant development in response to management, genetics, and environment. The company aims for its remote sensing and data science methods to underpin future improvements to global food production efficiency and sustainability.
"We are committed to supplying agricultural researchers and producers with innovative solutions to produce more food, feed, fuel, and fiber on fewer acres to meet the demands of the 21st century," emphasized Hiphen’s business development director Lee West.
Media Contacts:
Lee West
lwest@hiphen-plant.com
+1 540 309 3353
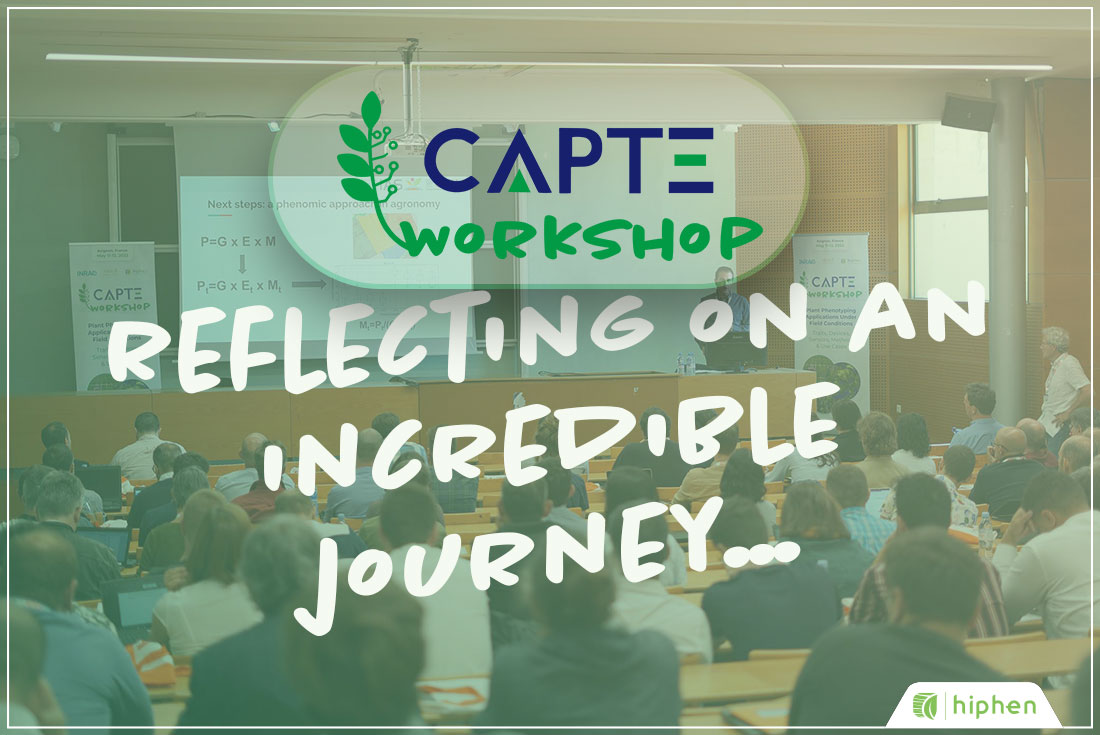
One year ago today, we had the privilege of organizing the #CAPTEWorkshop in our home town Avignon, France alongside INRAE and Arvalis. It was an enriching experience that brought together brilliant minds from around the world to discuss the latest advancements in plant phenotyping and agricultural imaging solutions.
The CAPTE Workshop provided an ideal platform for scientists, researchers, and industry leaders to share their knowledge, ideas, and innovations, paving the way for a more sustainable and efficient agriculture. The event showcased groundbreaking technologies and techniques that are revolutionizing the field of plant phenotyping and pushing the boundaries of agricultural imaging.
From cutting-edge imaging devices and remote sensing technologies to sophisticated data analysis tools, the workshop exhibited a wide array of solutions aimed at improving crop productivity, disease detection, and resource management in agriculture. The presentations, panel discussions, and hands-on demonstrations were nothing short of inspiring, highlighting the potential of these innovations to address global challenges such as food security and climate change.
Moreover, the workshop fostered a spirit of collaboration and knowledge exchange. Networking opportunities allowed the participants to connect with leading experts in the field, exchange ideas, and forge valuable partnerships. The sense of shared passion among all researchers was truly remarkable, creating an environment that nurtured creativity and innovation.
As we look back on this significant milestone, let's carry the knowledge, inspiration, and connections we gained at the #CAPTEWorkshop forward. Together, let's continue pushing the boundaries of innovation, leveraging the power of plant phenotyping and agricultural imaging to help answer the challenges of the 21st Century Agriculture.
🎬 (Re)discover the 4 sessions of the workshop in video 👉 HERE.
Your Hiphen Team.
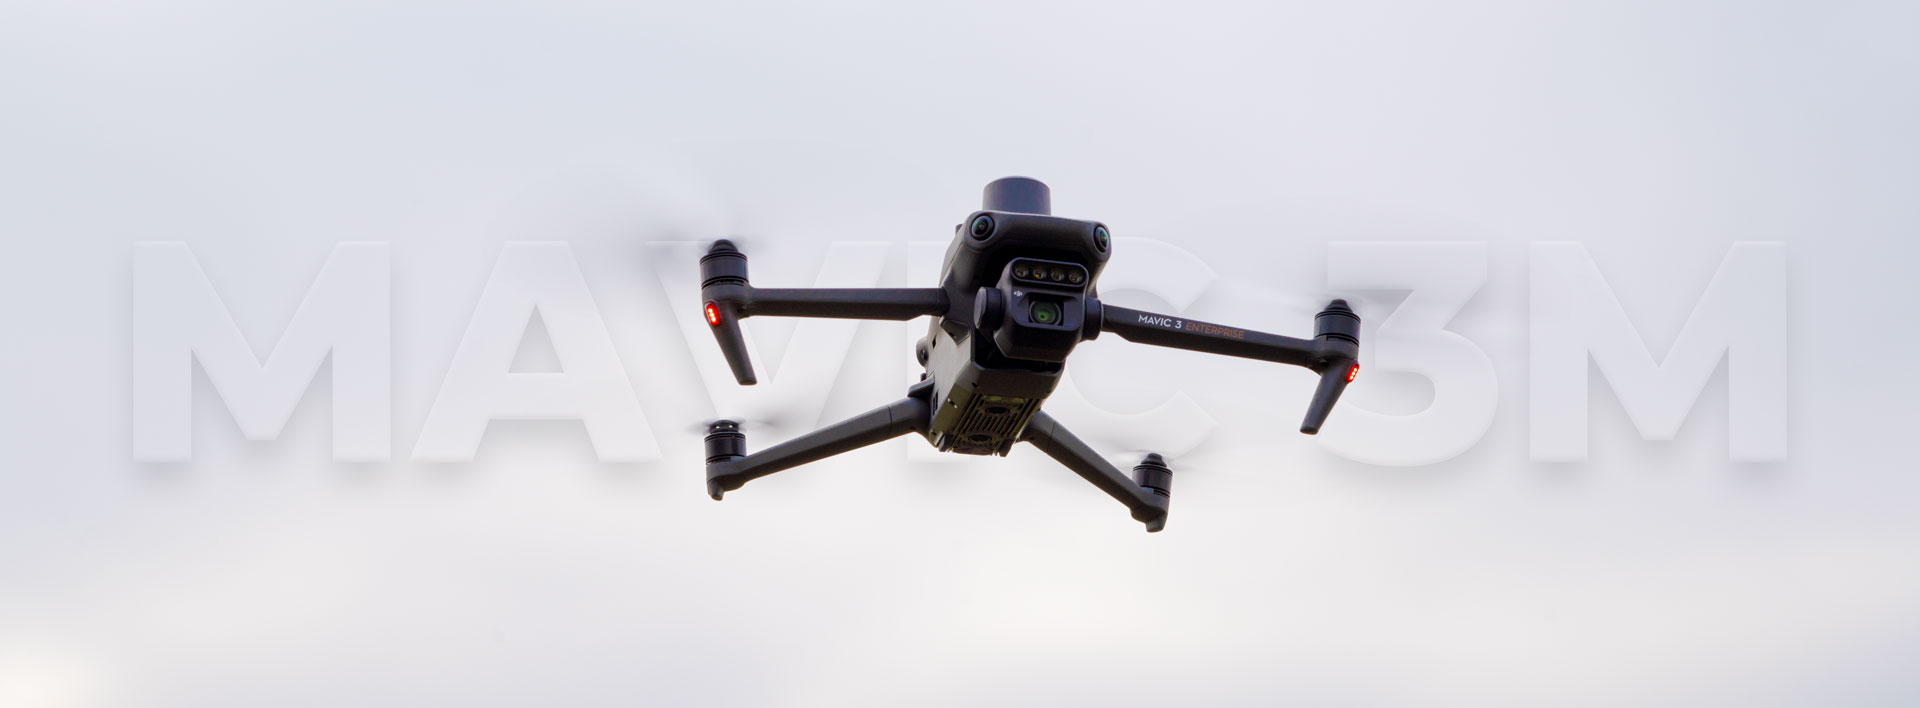
Last time in the Hiphen blog we were talking about the evolution of drone equipment for agricultural applications, saying that it has become more and more accessible and easier to use through the last decade. Now we’ve reached a new milestone in drone phenotyping, as DJI released a new version of the Mavic range with the Mavic 3M, a promising device that embeds a high-resolution RGB camera combined to a large-specter multispectral camera, and at Hiphen we’ve already tested it. So, evolution or revolution?
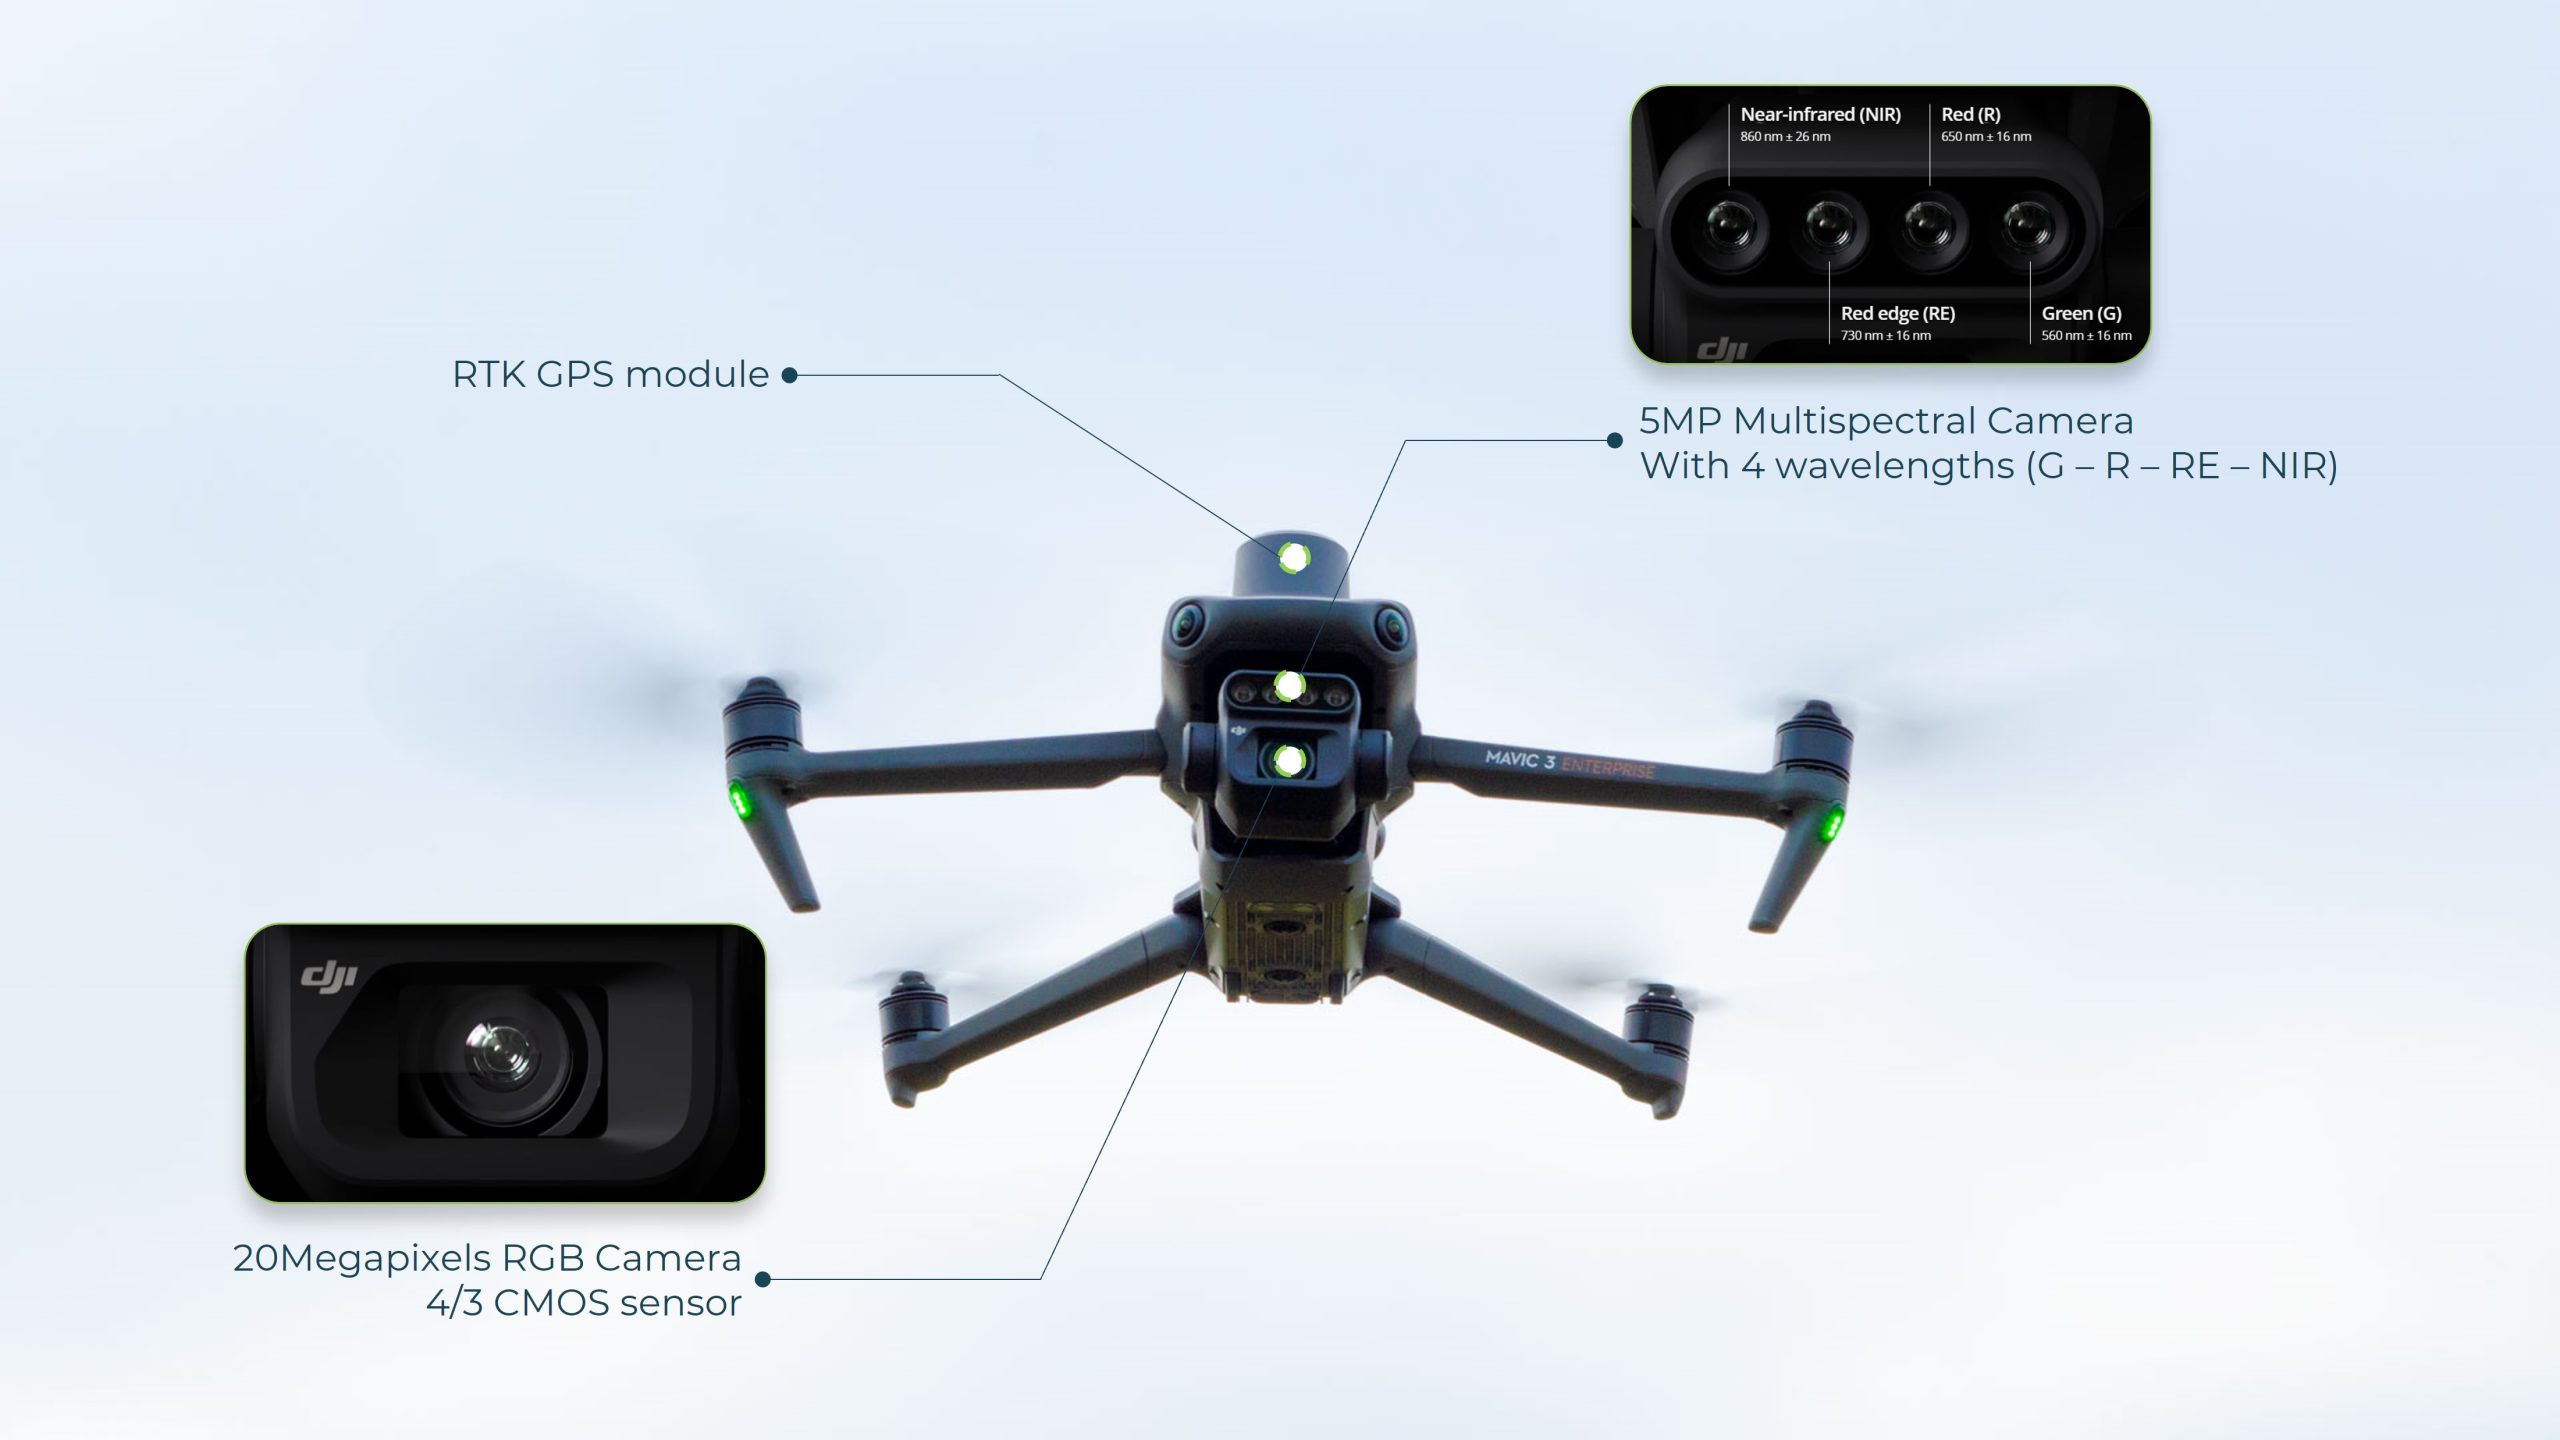
A 5MP multispectral camera (560nm > 860nm) combined to 20MP CMOS RGB camera will basically give you access to the most thought-after traits currently, from biochemical traits such as leaf surface to plant count and plot quality traits, you can now access all these measures easily within the same flight.
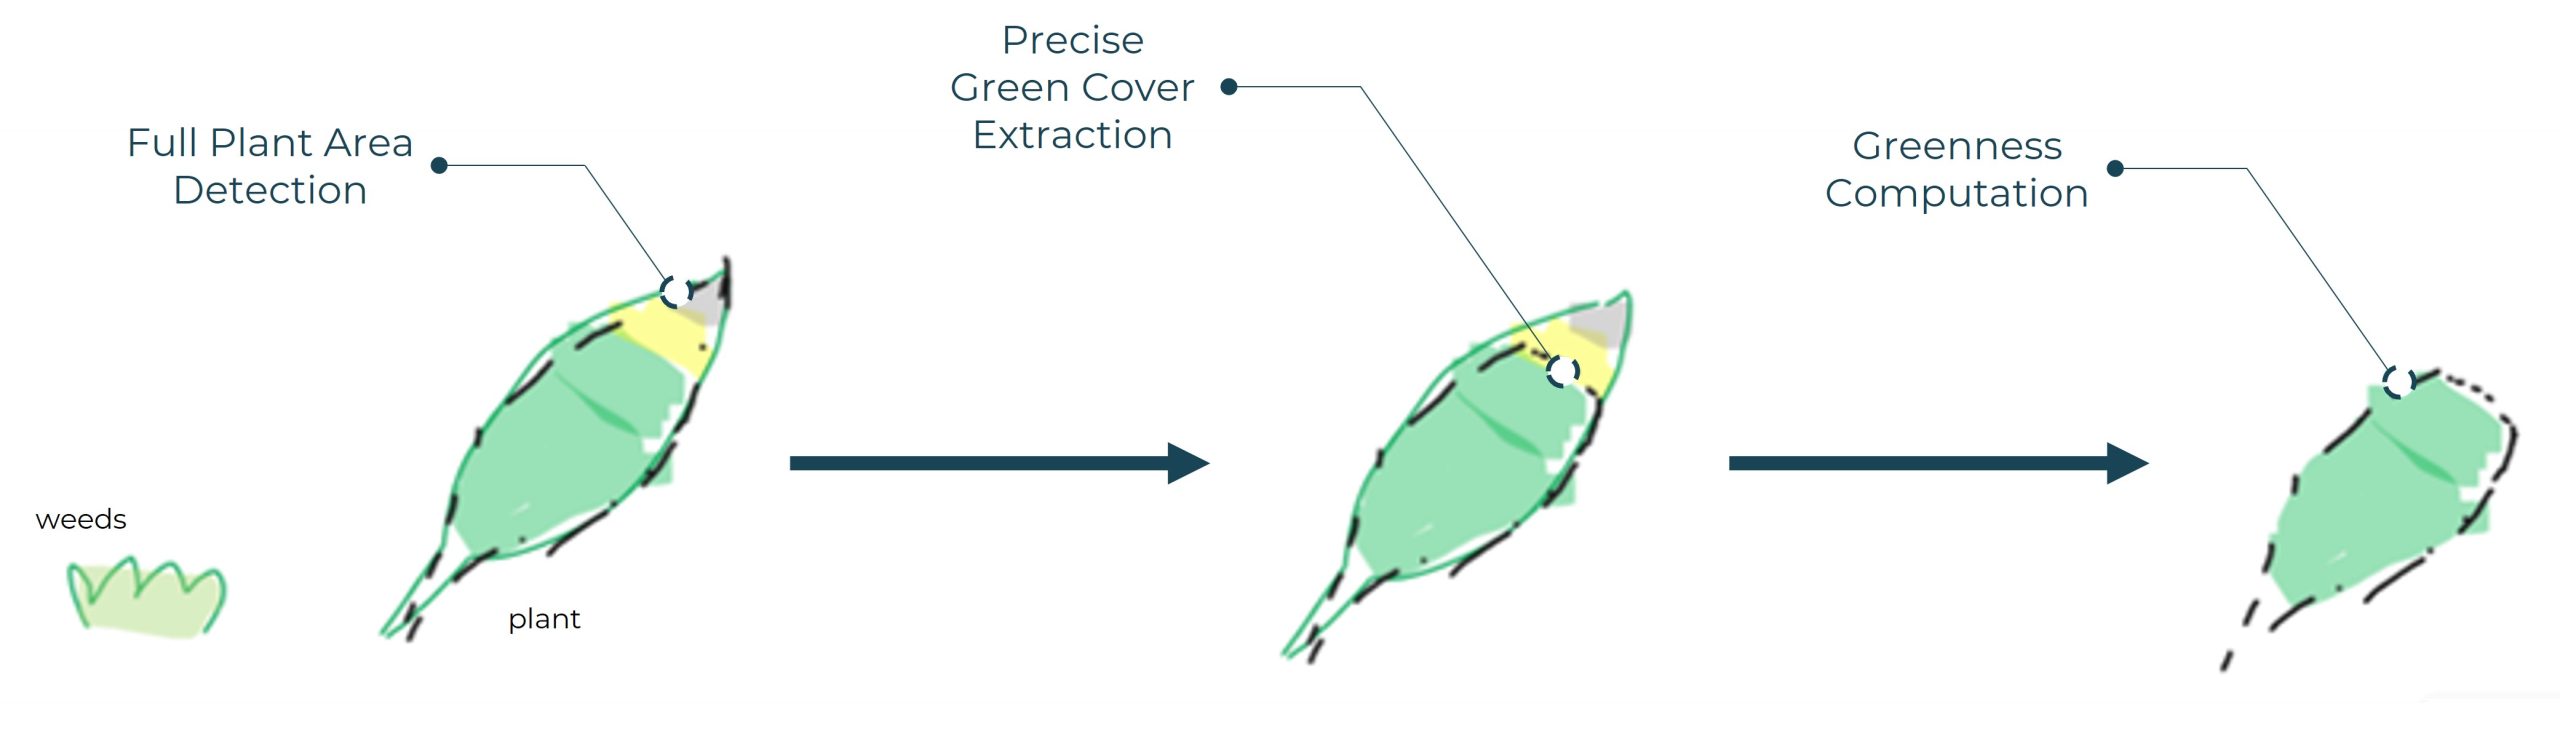
Figure 1: As we make our detection models evolve, we are now able to extract much more precise information than before.
Here is an example of images you can get with the new Mavic 3M; RGB + Multispectral images are acquired at the same time to speed up plant asssessment:
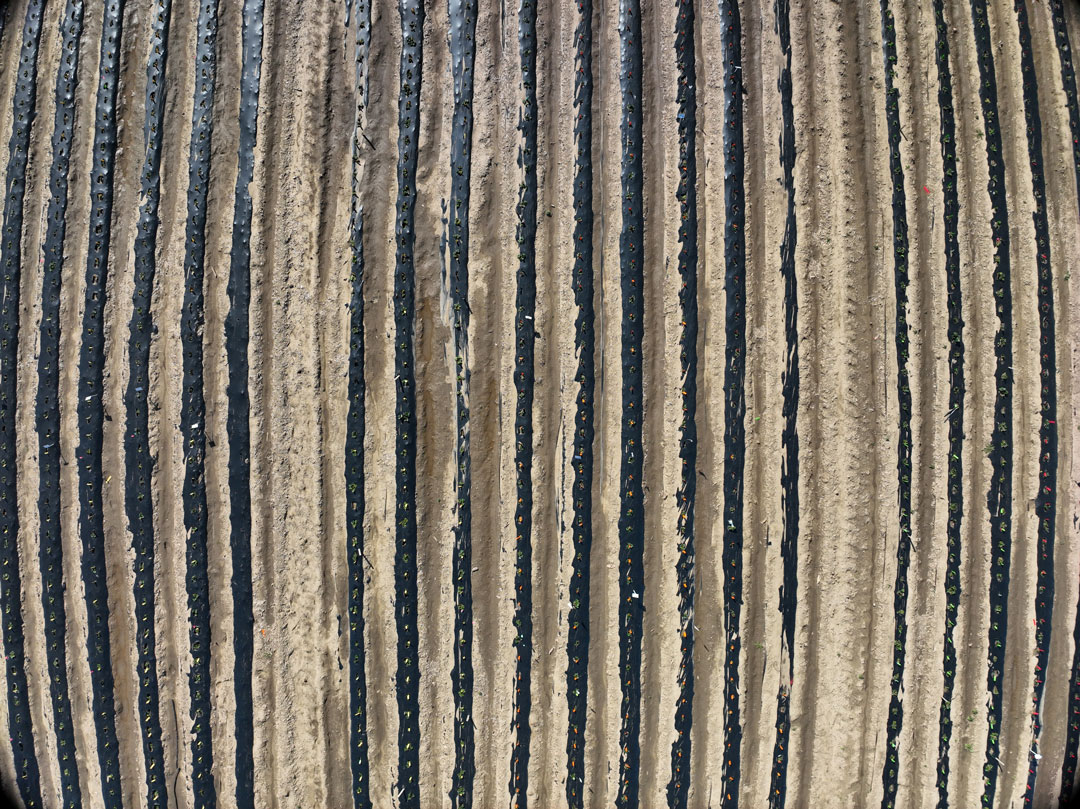
Figure 2: RGB image of Strawberries from Mavic 3M
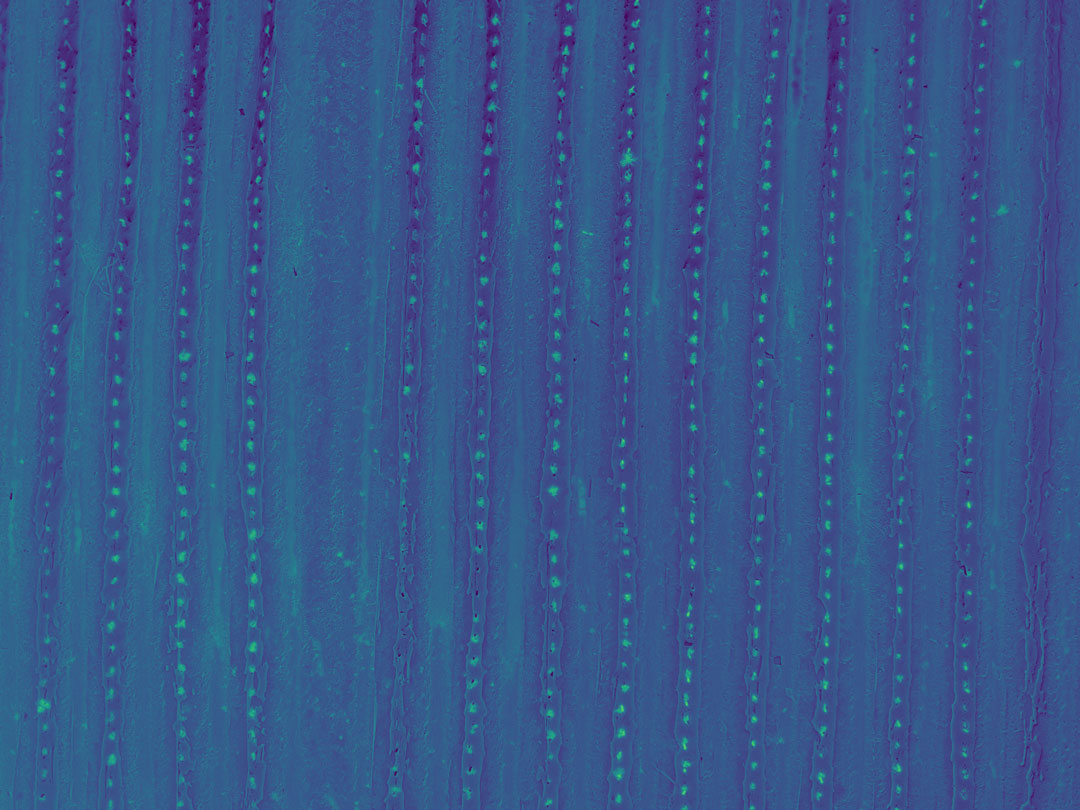
Figure 3: NDVI of Strawberries computed from Mavic 3M
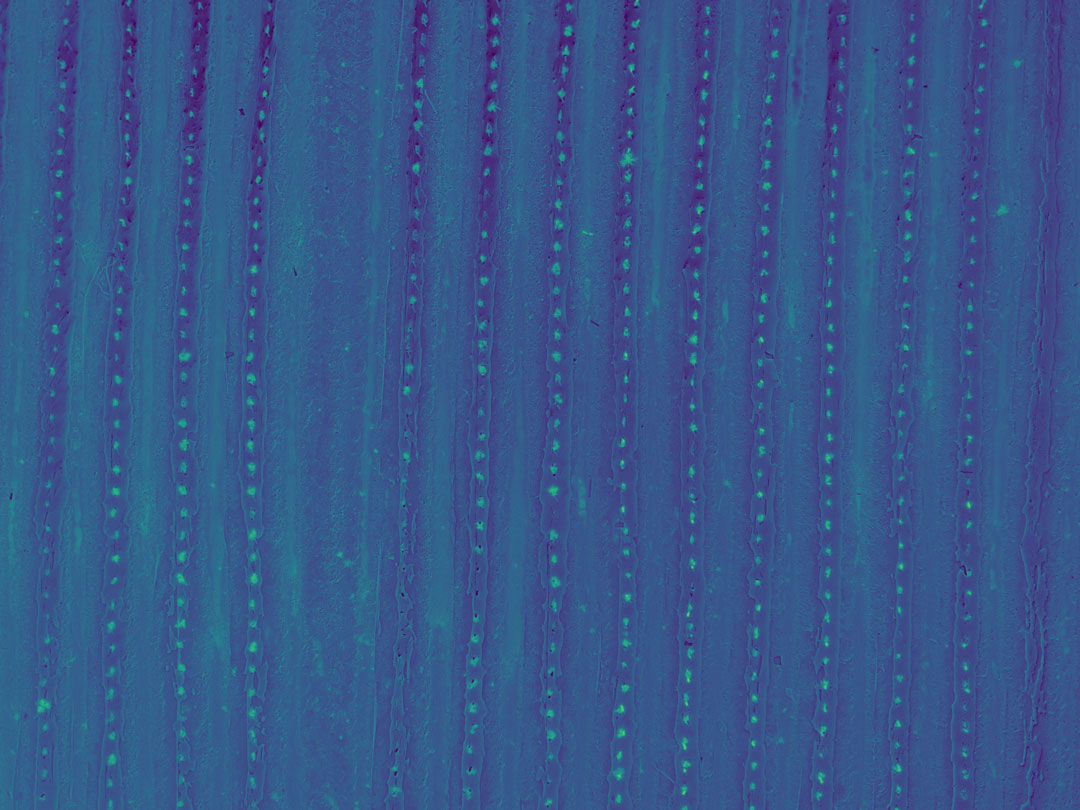
Figure 4: GNDVI of Strawberries computed from Mavic 3M

Figure 5: NDRE of Strawberries computed from Mavic 3M
What as evolved a lot from the previous model from the DJI family, combining an RGB + MS camera, is actually the RGB camera. Indeed, the sensor combination of this new Mavic 3M is way better than the DJI Phantom 4 MS, RGB images being sharper, more balanced and more precise with the new CMOS 4/3 sensor thanks to its 20MP resolution (see example below)
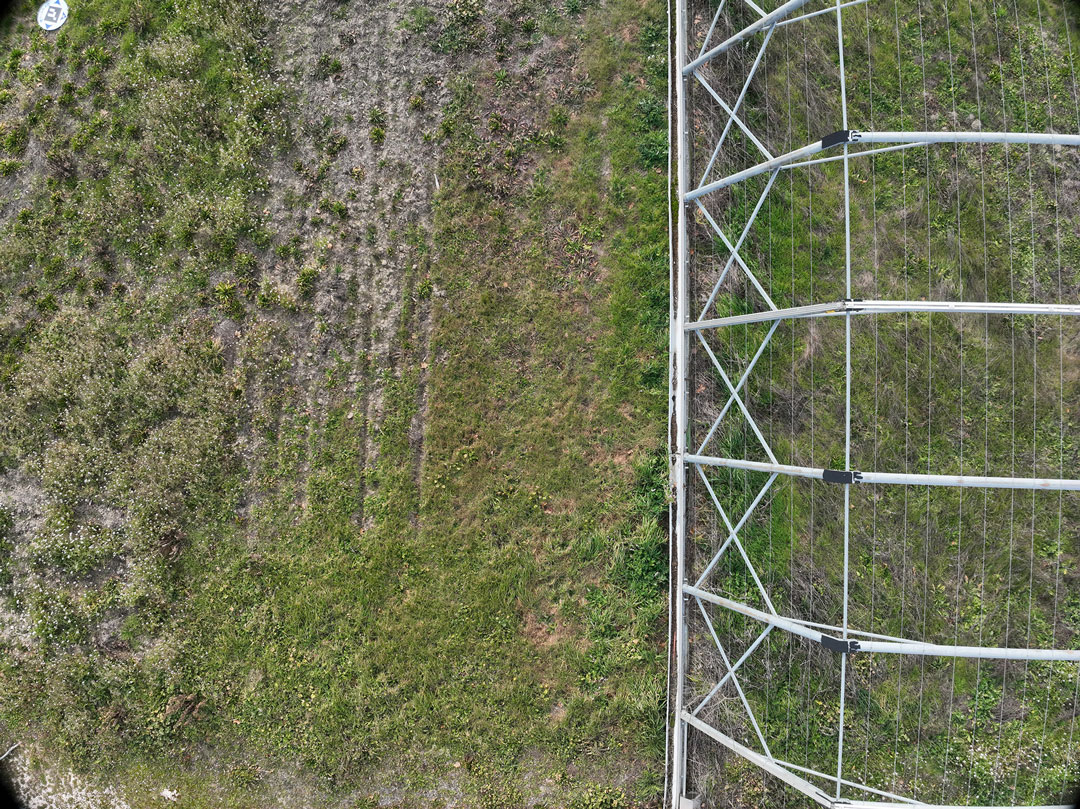
Figure 6: RGB image from the Mavic 3M
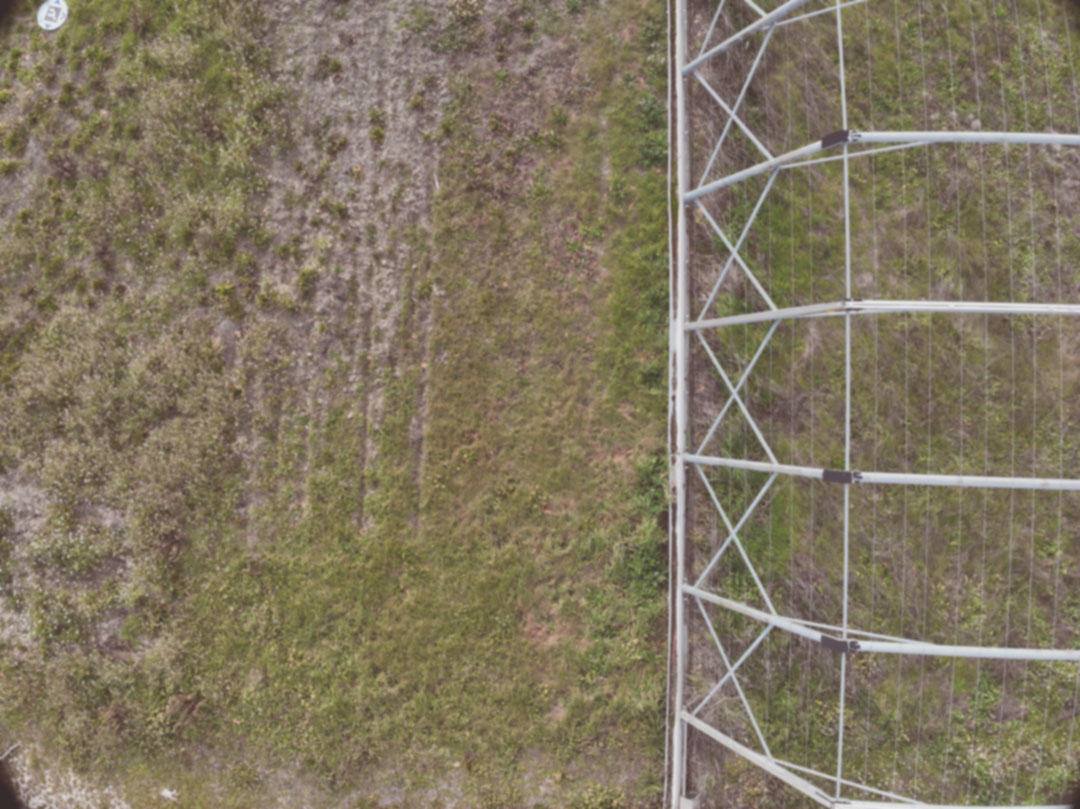
Figure 7: RGB image from the Phantom 4M
Then the multispectral camera as not really evolved, the specs are almost the same, the slight difference is that the Near-infrared (NIR) filter of the sensor is now calibrated at 860nm vs 840nm on the Phantom 4M. In practice this doesn't change anything to assess the plant reflectance in order to extract NDVI, GNDVI or NDRE indices from your images.
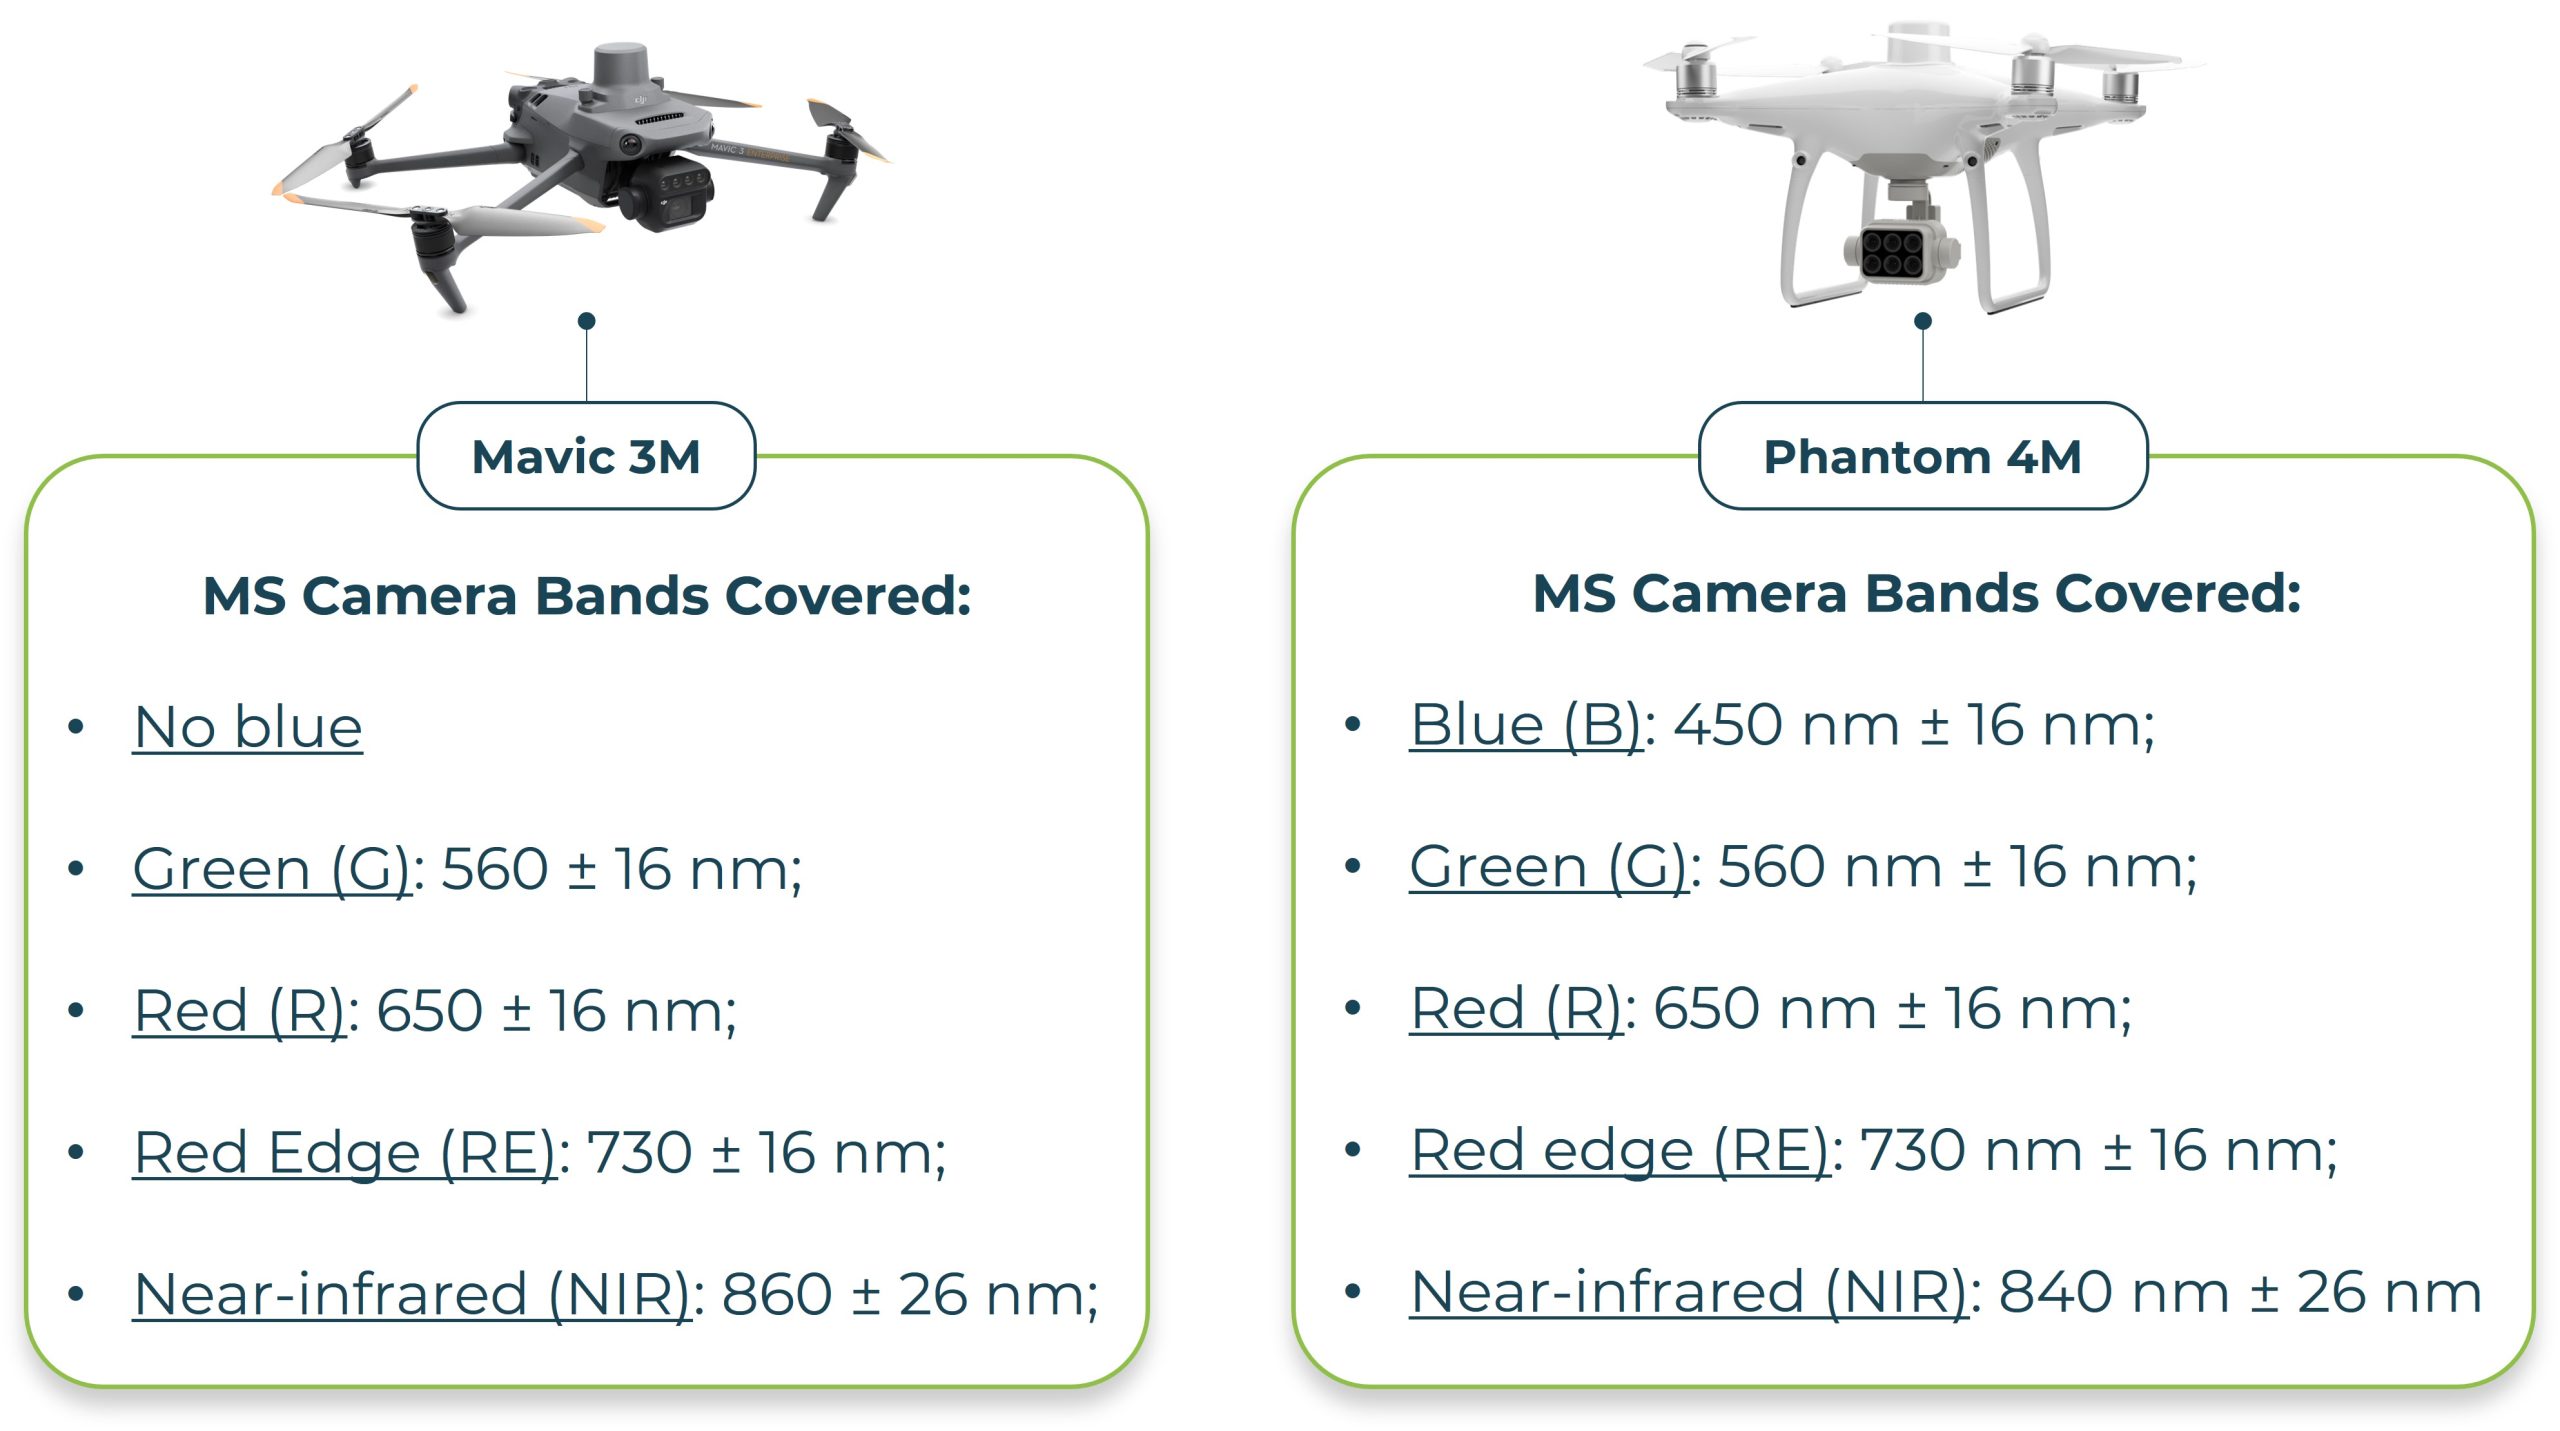
Figure 3: NDVI of Strawberries computed from Mavic 3M
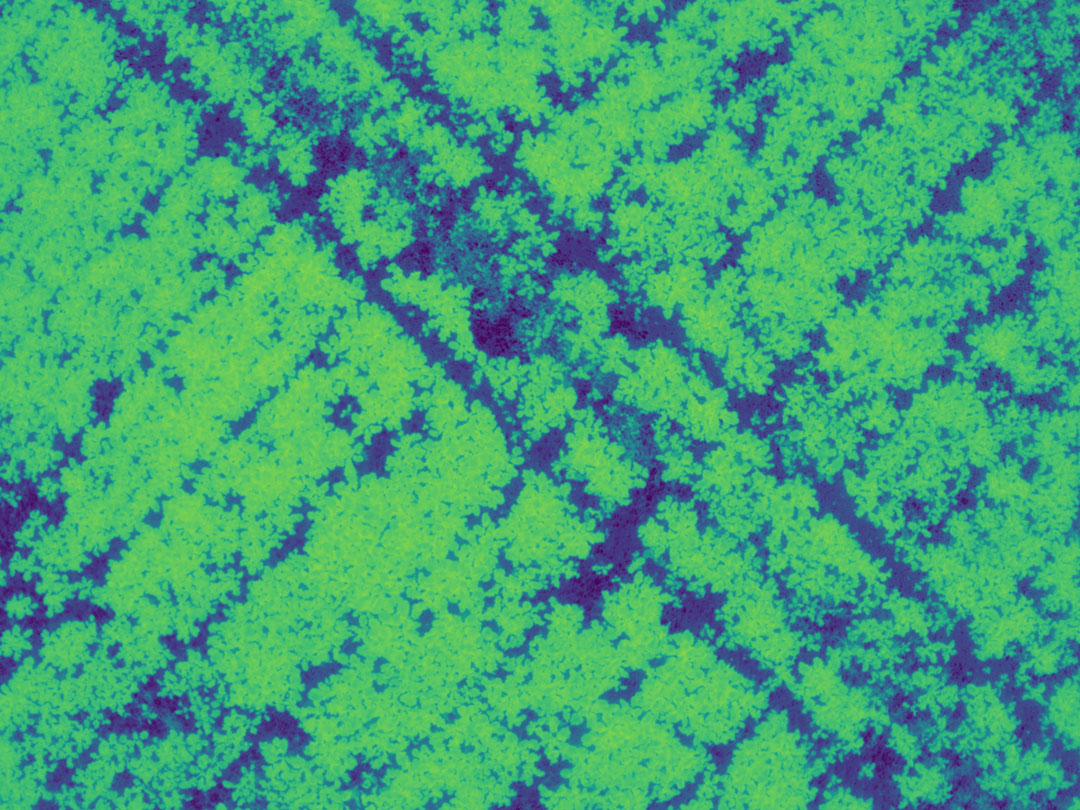
Figure 8: NDVI of Rapeseed computed from Phantom 4M
The blue band is no more included in the MS sensor of the Mavic 3M, indeed this band is not specifically useful in most applications, moreover we can still acces it with the RGB images containing the Red, Green & Blue wavebands.
With this great sensor’s combination, we can now combine RGB + Multispectral image acquisition at the same time, during the same flight, where before 2 separate flights were needed to acquire RGB and MS data. However, you will still need to upload your RGB and MS datasets in 2 different upload sessions to make sure processing will run smoothly.
This new drone also helps us envision merging the best of both worlds (RGB + MS) to dive into much more detailed granularity of information that we can extract from such images. We’ll continue testing and developing modules to access new traits in the future – stay tuned!
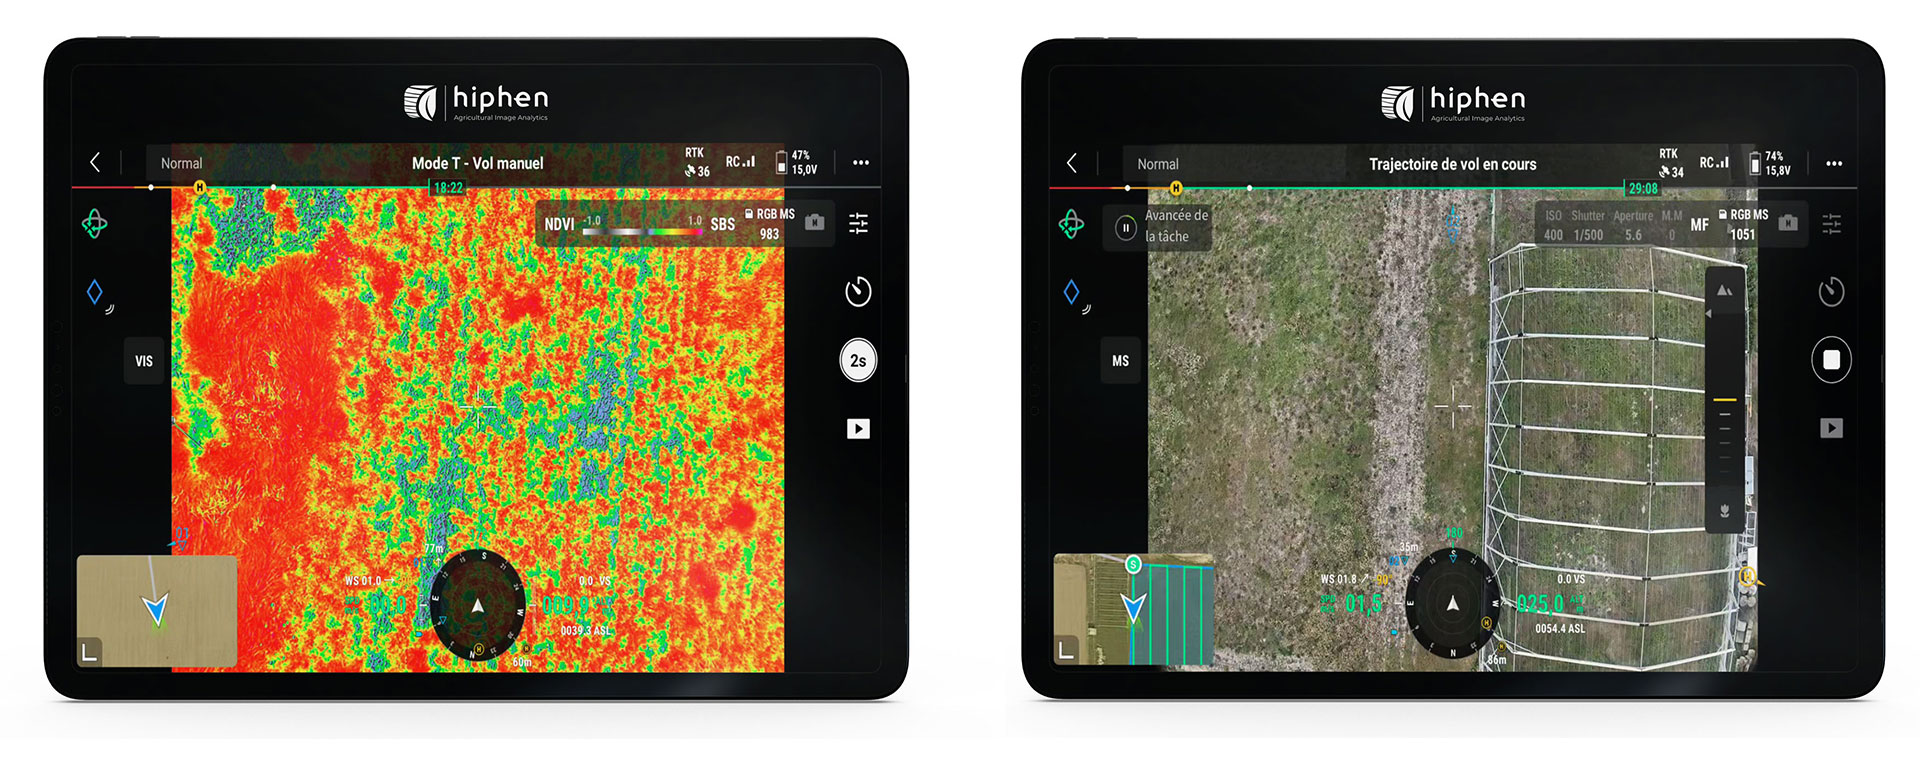
Figure 9: The cameras in action – You can now choose to have an instant visualization of the MS camera with a few vegetation indices like NDVI or NDRE while flying over your trials – Or wether to have an instant RGB camera feedback
RTK means Real Time Kinematic, and this geolocation technology allows a centimeter-level positioning of the device, with real-time synchronization, will flying above your trials. Like the latest generation of portable drones from the DJI family, the new Mavic 3M comes as standard with an RTK-precision GPS module mounted on top of the drone that will ensure great image georeferencing and easy alignments while reconstructing your Orthomosaic.
The battery life is also great, DJI mentions 43 mins of flight duration in perfect conditions. We actually measured it flying for 32 mins above a wheat field at 12M high while capturing both RGB and MS images, with a single battery. It is also more silent and compact than previously. in addition it fits easily in a backpack with the 2 batteries that comes as standard with the drone.
To compare it to the previous Phantom 4M, the battery-life is improved due to the lightness of the device and the improved efficiency of the fast-charging lithium batteries. We need to make further testings on this but it seems like we can have a significant 35% to 50% of additionnal battery-life than the Phantom 4M.
With all those features packed into one device, the great surprise is also the price, selling at around 4,300€, the Mavic 3M is giving access to the best drone technology for less money than before if we compare it to another member of the DJI family, the Matrice 300 equipped with two gimbals + two sensors, which we recommended a lot in the past and that costs around +20,000€ for almost the same technology. With the Matrice 300, the RGB camera would be better, however you’ll access the same range of traits with the Matrice than with the Mavic 3M.
Overall, the new Mavic 3M is more precise, more easy to operate, more reliable in terms of image acquisition, faster and less expensive than ever. The combined sensor head will facilitate you accessing most valubale traits for drone phenotyping such as vegetation indices and radiative transfer traits alongside counting and quality traits within one single flight, with less energy and less money spent. It's probably the biggest revolution in drone phenotyping since the establishment of the Mavic range. We strongly recommand this new Mavic 3M for most of your phenotyping applications.
We will soon make further testing of this Mavic 3M in various conditions and update this post with our latest conclusions. In the meantime, feel free to grab a time to discuss drone image analytics for phenotyping with one of our experts using the calendar below!
Sincerely,
Your Hiphen Team.
1/ Choose a day 📆 > 2/ Select a time slot at your convenience 🕒 > 3/ Confirm the meeting ✅ > 4/ You're all set 🎉
Selecting a Drone to Meet Your phenotyping Needs:
As drones have become better, less expensive, and easier to use, more researchers have been incorporating them into their trial assessment programs. The new generation of drones are bringing more capacity to assess new and previously inaccessible traits such as wheat head count, flower/fruit counting and classification, and phenological stage detection.
Many interesting traits can be assessed with multi-spectral sensors, but many of the most exciting and impactful traits that leverage deep learning tools are extracted from imagery captured with high resolution RGB cameras.
So, if you are thinking about leveraging drone technology to extract new traits to enrich your trial data sets, here are 5 drone features to consider for High-throughput Plant Phenotyping (HTPP).
Pixel count is very important for many of the most interesting and important phenotyping operations. More pixels create higher resolution to be able to classify and count small features in images such as counting thousands of heads of wheat in a plot. Generally, a research grade drone starts at 20 megapixels (MP) like on an Autel Evo II Pro or DJI Phantom 4 Pro V2. Sensors up to 100 MP are available for drones and allow higher resolution at higher altitudes which can help shorten flying times.
Pixel count alone does not tell the whole story. Sensor size is even more important than megapixel count for phenotyping.
Resolution without an acceptable sensor size can be misleading. Larger sensors can have larger pixels which allow each pixel to capture more light and thus create a sharper image. With smaller pixels, less light enters each pixel and if there is not enough signal per pixel, cameras “bind” the pixels together reducing the functional resolution. An example that often confuses people looking at drones on the market now is:
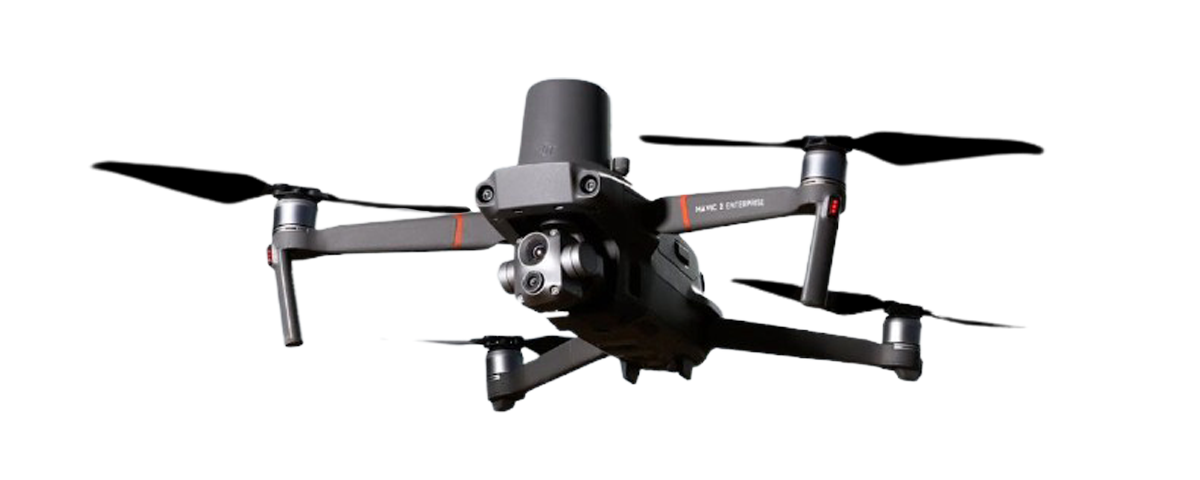
Even though the Enterprise Advanced has a 48mp camera, the small pixels size actually yields images less useful than the larger sensor 20mp on the Mavic 2 Pro. Thus, larger sensors are particularly important for advanced deep learning phenotyping from drones for things like plant count or flower/fruit counting and classification.
There are trade offs around senor field of view (FOV). FOV and altitude define your global image footprint. A narrow FOV generates crisp images better suited for fine grained detail required for counting and classification deep learning. But with a smaller footprint you will need to take many pictures of a field (ei higher overlap) which will take more time and data storage space. For phenotyping applications on objects that have significant height or area (corn or tree crops) this smaller FOV also reduces geometric distortion caused by rendering a 3D object in 2D. So, for most detailed applications, a smaller FOV is preferred for plant phenotyping.
High quality optics yield images with higher sharpness, less distortion, less vignetting, and less chromatic aberration. Unfortunately, there are rarely metrics in specifications that allow you to assess the optics quality of sensors. For drones, unfortunately, all you can use as a guide is price. The higher the quality of the optics, the higher the price. Hasselblad and PhaseOne are 2 sensor providers that generally use high quality optics, but there are many others too.
Shutter type also affects image acquisition. Here are the 3 main types of shutters:
So, how does this boil down to the decisions you will be making on which drone best fits your needs?
Many research teams we work with select an entry-level research drone to get started quickly and then move to the advanced drones when they have a season or two of experience. But others realize the added impact that a more advanced drone can bring to their program, want to realize that value quickly, and will start with an advanced drone configuration.
Below are some examples of the rough cost of each equipment option and some of the systems we’ve had the best experience with.
Entry-level Research Grade Drones – fixed sensors:
Advanced Drones – accommodate multiple sensors:
With higher resolution and larger sensors, you can fly at higher altitudes and fly faster and still acquire higher quality images in less time. These drones can carry multiple sensors which can be swapped in and out depending on your needs. This provides flexibility but can make operating more complex because the sensor and the drone are often not integrated. We currently use the DJI Matrice 300 and are very satisfied with its performance, flexibility, and ease of operation. The Matrice 300 costs roughly 10 000$ for the drone alone. Then you will need to add the cost of a gimbal and cameras. For the RGB camera options that really make these drones capable of delivering unique traits, here are several of the most common sensors:
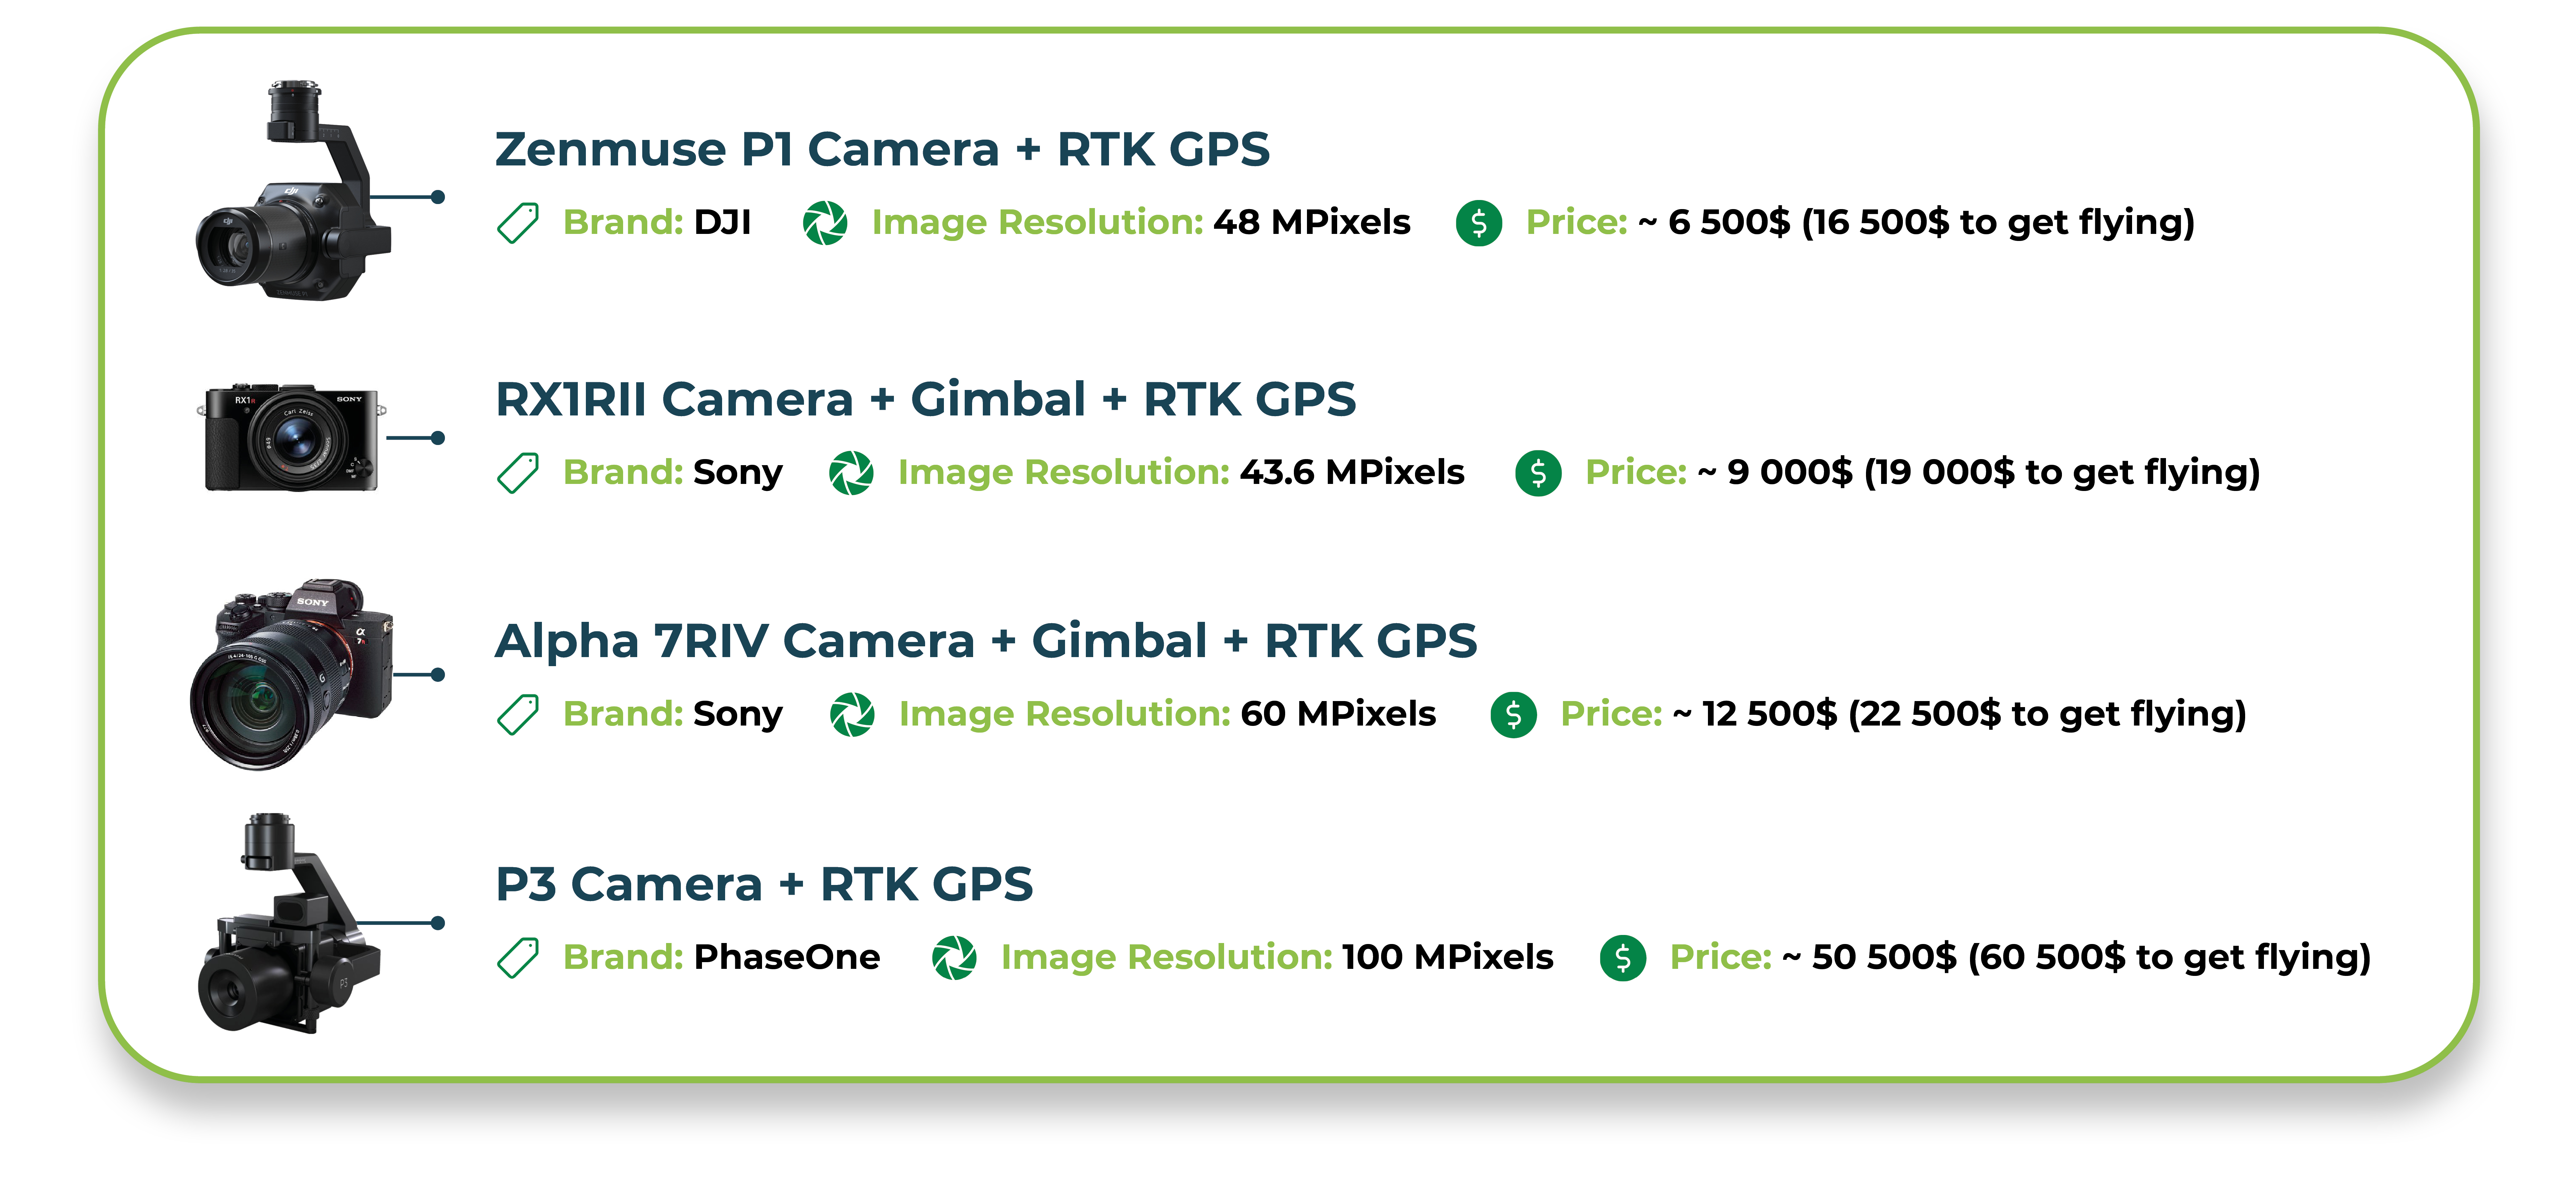
Technical Specs Of The Sensors:
Overall, you need to determine the traits that will add the most value to your research programs and select the right tool for the job.
If you want help thinking through which traits are accessible and which drones and sensors are best suited to your specific needs, simply find a time on our calendar below and we will be happy to discuss your options and help you make the appropriate choice for your needs and budget:
1/ Choose a day 📆 > 2/ Select a time slot at your convenience 🕒 > 3/ Confirm the meeting ✅ > 4/ You're all set 🎉
When you are a company from the seed breeding industry or others, the objective of setting up drone flights for plant phenotyping in a research program is to digitize, simplify and improve the measurement of plants and field with sensors thanks to a precise and unique methodology for all your trials, regardless of their location in the world.
Today, setting up a drone acquisition protocol for agricultural image analytics is a process that some consider long and sometimes expensive. However, companies specialized in image processing for plant phenotyping can accompany the actors of the agricultural ecosystem to set up such projects, and this is where Hiphen can help.
From advice on the most suitable equipment for your project, to flight procedures, data processing and beyond, Hiphen accompanies you all along your phenotyping journey to enable you to access frictionless phenotyping with drones.
Implementing drone flights into a research program is journey that can be divided into 6 mains phases, some of them are recurring, and there are several people involved in such project so first, lets focus on the key players and their roles before to start.
We have listed exhaustively the key players involved in implementing drone flights for plant phenotyping projects in the table below. Each of them are important because it's crucial to understand that the initiative is a chain and not the sum of its links. People from several departments are sometimes involved and providers can also be a part of the project (especially for the drone pilots), so that's why a binding phase needs to take place at the very beginning of the project, as we will see later.
Thus, here are the players that you need to identify within your organization before to start, and their role in the initiative:
| Name | Role |
|---|---|
| Client Management | Decision-makers on client side. They are involved in the major steps of the project. |
| Breeding team | A motivated team with a nominated contact point whose role is to secure ground observation and synchronize observations and flights with the whole team. |
| Project Coordinator (Client Side) | Coordinator of the project on a client side. He is a member of the breeding team and oversees the ground measurements, of the tele pilots planning's, of making the link with Hiphen's project coordinator, of the upload of the datasets to our data platform and of sending updates upon the project's progress or issues. |
| Project Coordinator (Hiphen Side) | Global coordinator of the project, he helps to define the scope of the project and helps to select the device(s)/sensor(s). He also helps to define the traits, the validation process and the phenological stages to fly at with the help of Hiphen's agricultural remote sensing experts. He Generate and send the SOPs and send feedback upon the acquired/uploaded data. Most importantly, he oversees the data processing of the selected traits. |
| Field Acquisition Operator(s) | Whether drone tele pilot with a diploma within the client's organization or external service providers, here also with a contact point involved in the meetings and updates for a better project's coordination. The field acquisition operator(s) oversee acquiring research-grade image datasets following strictly the protocol sent by Hiphen's project coordinator. |
In some cases, people from your organization could cover several roles, but this gives you a precise overview of the resources needed to implement drone flights into your research program.
Now that the key players are identified, it's time to focus on the main steps of the implementation process. Here is the summary of the different phases:
For each phase we several steps to complete and several people involved in, so let's dive deeper into each phase.
It is basically an introductive meeting to let all the stakeholders to get to know each other's and their role in the initiative. As we said before, this step is crucial to make sure everyone in the organization and in the project understand that it's a process that must be followed in the right order to become successful. This is obviously a one-off phase and all the players, and the service providers if some are involved in the project at any time, must take part in this introductive meeting.
It's s also a one-off phase but this one must take place for every trial if there are many located in different places. In this second phase, you must at least:
With this phase, we are aiming at performing all the preparatory and legal steps to be able to trigger drone flights on demand later, whenever you need in the season. Finally, to give a timeframe for this phase, overall, it can last from 2 to 6 months based on our previous experiences. It can be more for some countries since local restrictions apply for drone providers (like DJI in the US for instance) or if you encounter any issues with your civil aviation authority.
With phase number 3 coming up next, we are entering the phases that are recurring every new project during the research program, knowing that a research program can last several years (we usually say that a breeding cycle lasts an average of 7 years).
The first phase which is recurring is the project's definition, and by that we mean that it's time the define the objective and stakes of the project. One project usually refers to one growing season. Here is what you need to do at least:
This third phase is a key pillar of the project and sets the basis of implementing an easy-to-use decision support tool into your research program. Duration of this step is around 2 to 3 weeks depending on your organization.
No surprise here, this phase seals the project for the upcoming season when all the paperwork and payments have been figured out between you and Hiphen. This doesn't take too much time; we consider 2 weeks as a reasonable timing.
The penultimate phase of implementing drone flights for plant phenotyping projects is planning the season:
We consider taking 2 to 3 weeks to plan the season properly before being able to fly the drone for plant phenotyping projects. Also note that this phase and the next one are aiming at giving you access to analytics to support breeding decisions. So, following these steps in the right order will ensure the smooth running of the project.
The final phase of the process, this one objective is to let you collect data for real-time decision thanks to the drone flights and Hiphen's data processing expertise. To make sure the project will be a success, there are a few more steps to complete such as:
Timing this phase is almost impossible since all projects are different and since this phase lasts the entire growing season. So, it depends mostly on the crop(s) concerned and on the number of flights that are needed to compute the selected traits.
Now we have covered the entire process of implementing drone flights for plant phenotyping projects based on our own experience with CGIAR and other institutions and companies. To summarize all the steps and phases, we have put together a more digestible infographic for you to understand the whole process:
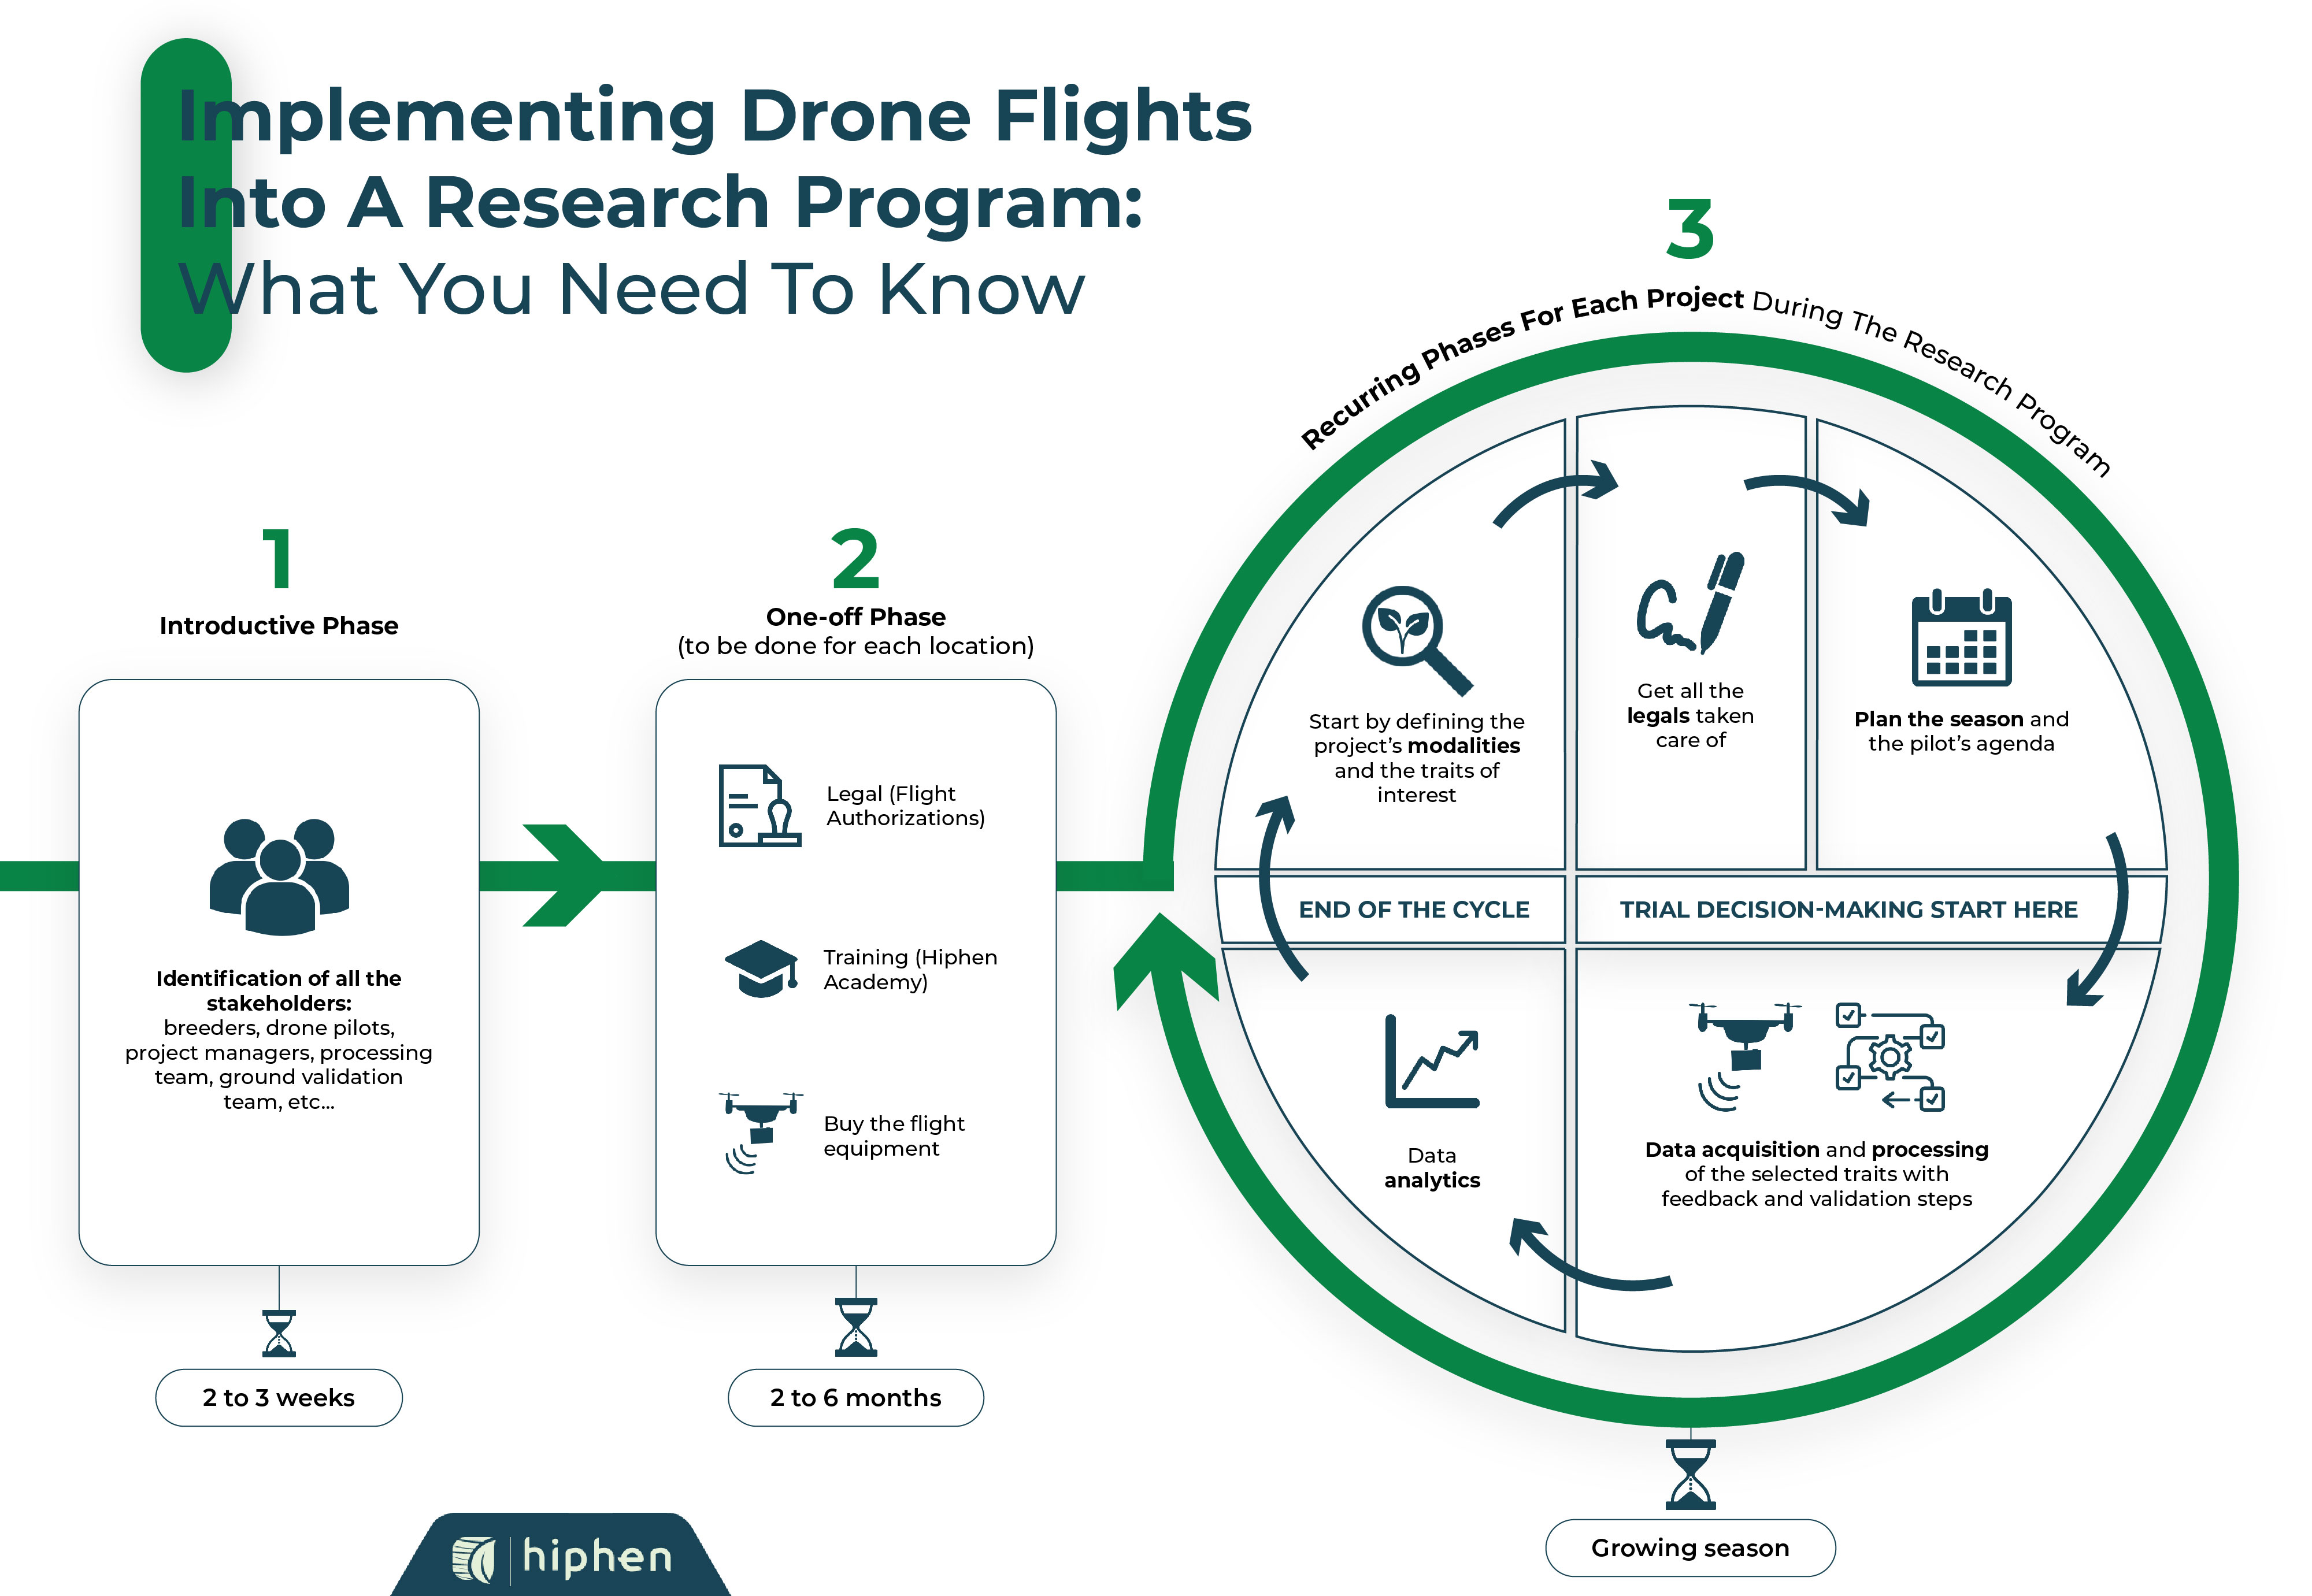
Feel free to contact us should you have any question about a specific phenotyping trait at www.hiphen-plant.com/contact/. We look forward to hearing from you!
Speak soon,
Your Hiphen team.
You probably already crossed the word "trait" in scientific presentation or in papers, but you are still confused about what is exactly a phenotyping trait? At Hiphen, we always use the term "trait" to define all the different measurements that we can make for your plant phenotyping projects.
Generally speaking, a phenotyping trait, also called phene, is a quantitative or qualitative characteristic of an individual resulting from the expression of its genome in a given environment. This term is not restricted to plants and a trait can be determined at the scale of an organ, a plant or a canopy. The collection of traits, or phene, constitute the phenotype of the individual. In consequence, Plant phenotyping is the science of measuring traits to determine plant or canopy phenotype.
At Hiphen, we are specialist of non-destructive traits assessments thanks to our in-house technology to collect and analyze images from drones or phenomobiles. It allows to calculate traits multiple times during the season as opposed to destructive assessments. Monitoring the phenotyping allows to explain the quantitative and qualitative performance of your field. However, the term "trait" covers a lot of different reality: let's take a deep dive!
The measurement of traits with high-throughput plant phenotyping produces variables: a discrete or continuous quantity that quantifies the traits that can then be used to compare different individuals. Traits availability and the precision of the associated variables depend both on sensors' technological development and interpretation methods maturity.
However, a phenotyping trait can be from a very different nature. At Hiphen, we define categories of traits:
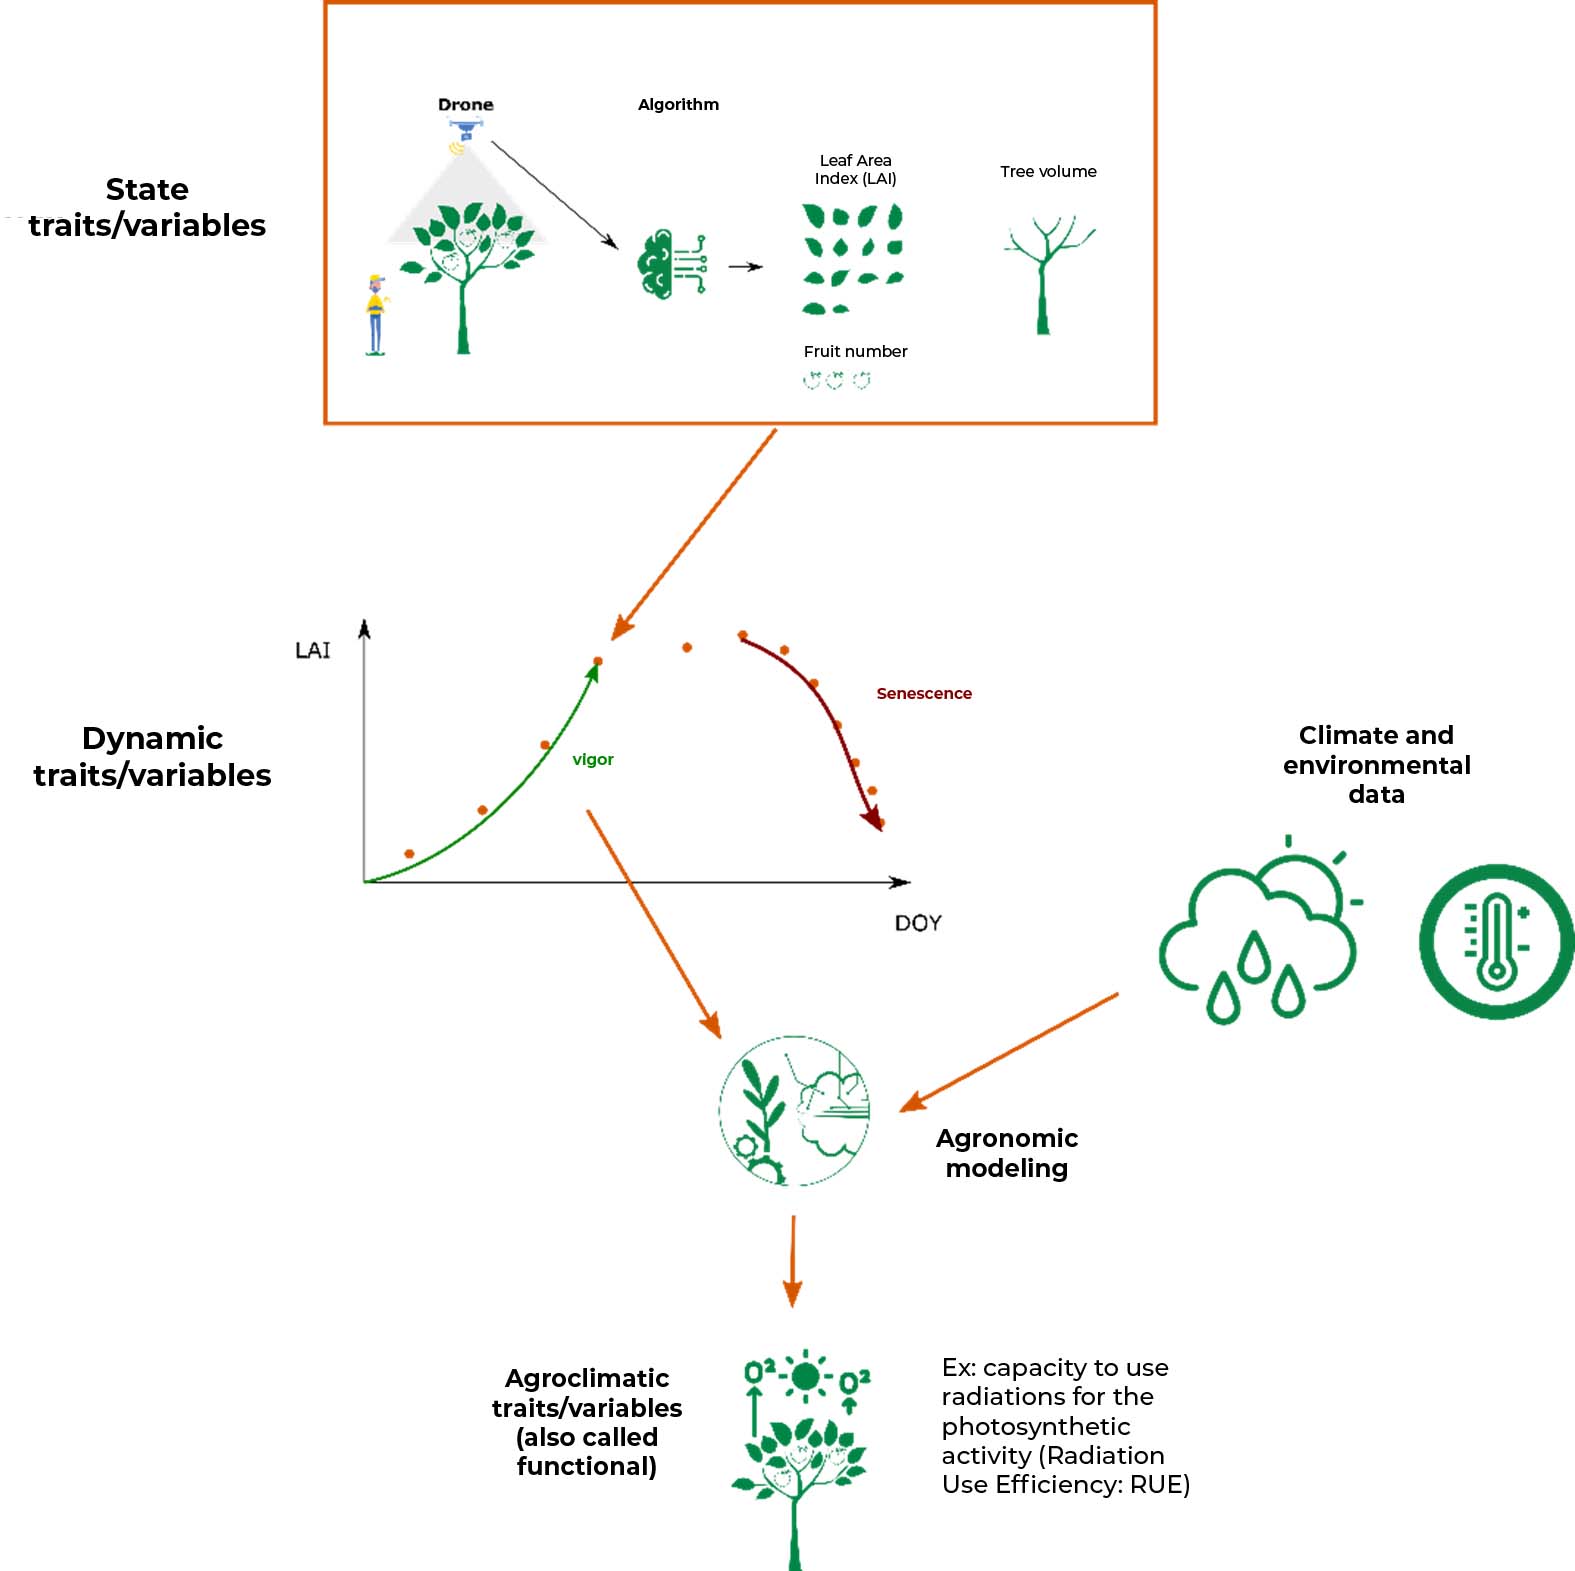
For instance, we present in the diagram how at Hiphen we will evaluate the photosynthetic efficiency of your crop. After your UAV flights, we will be able to interpret your raw data into state traits/variables (step 1) (remember, it can be biophysical, biochemical, or sanitary!). By repeating your flights during the growing season at key phenological stages we will be able to integrate over time the state traits/ variables and transform them into dynamic traits (step 2) such as vigor or senescence (stay green). We can transform these dynamic traits into true agronomical traits (step 3) by combining them with environment information using agronomic modeling. Meanwhile, you just have to relax, sit back and enjoy clean, qualitative information from your trial on our data platform: Cloverfield.
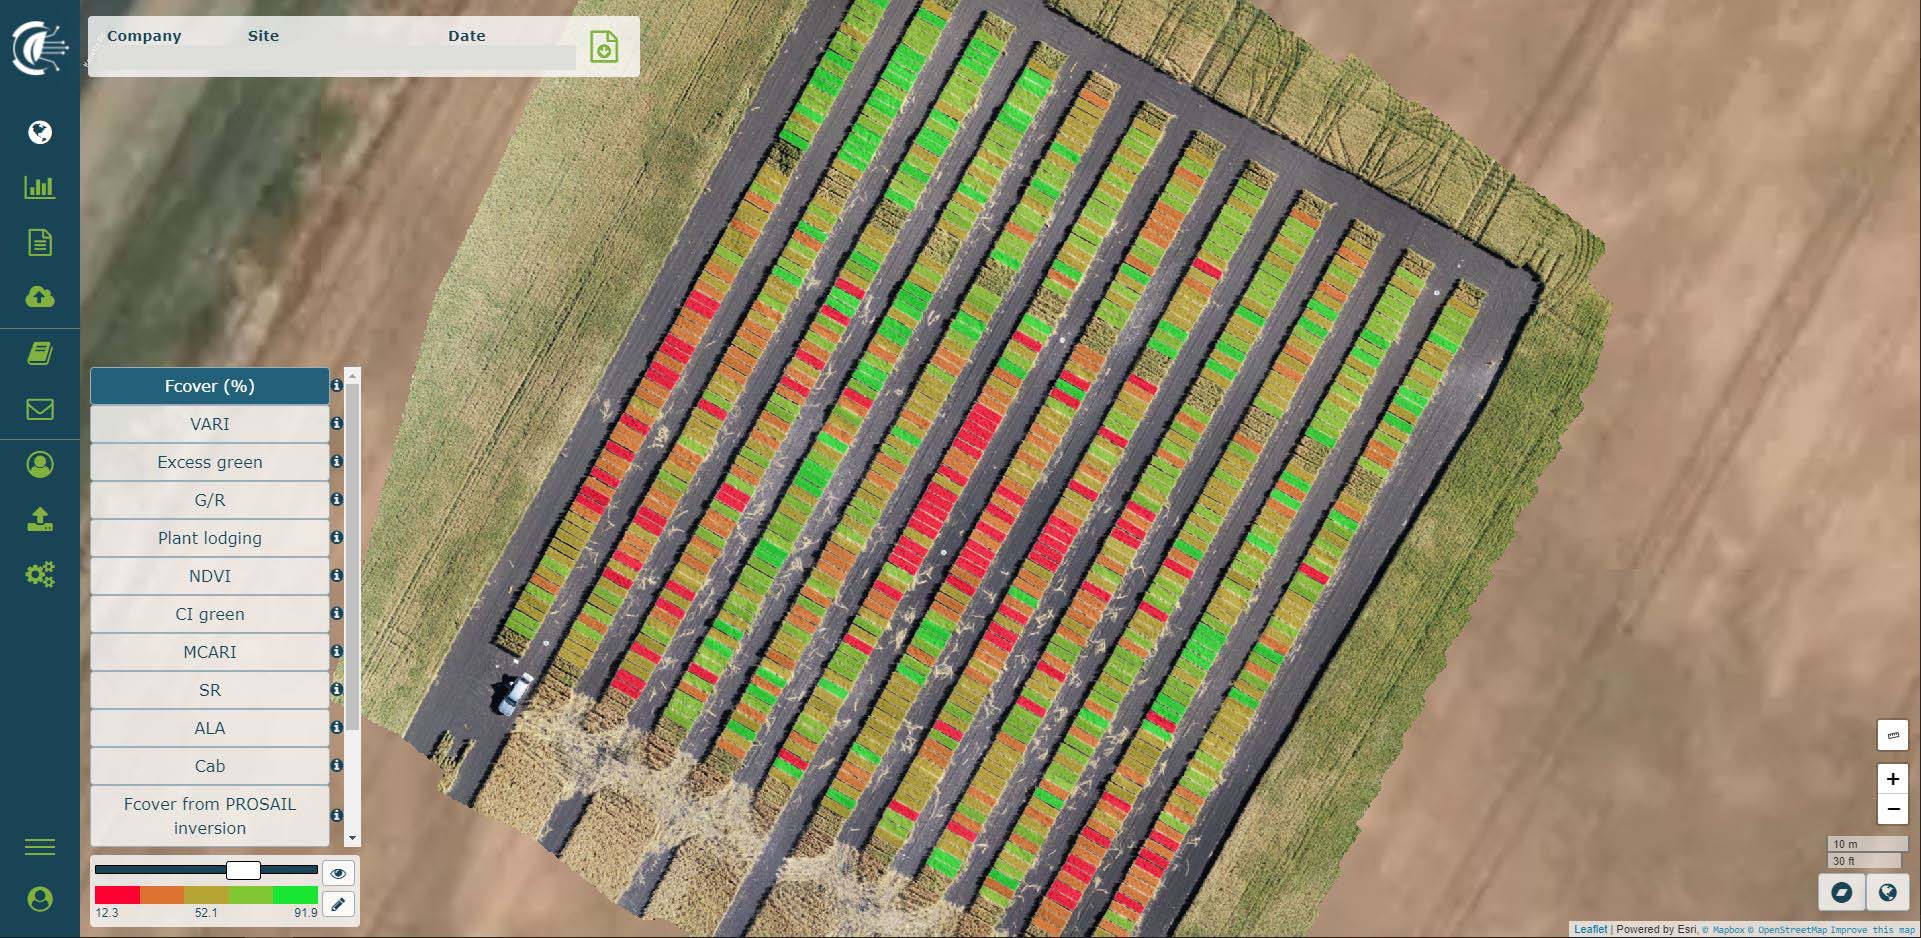
By the way, here is an example of the distribution of a trait (green fraction or Fcover here) in Cloverfield:
Feel free to contact us should you have any question about a specific phenotyping trait at www.hiphen-plant.com/contact/. We look forward to hearing from you!
Speak soon,
Your Hiphen team.
The states traits can be measured directly on the canopy and take exactly one value at a precise time. They can be categorized into three groups:
Example of state traits/variables:
Dynamic traits are based on repeated observations of state traits. Popular dynamic traits among breeders are the early vigor or the stay green. The early vigor is the plant or canopy growth speed, while the stay green is the plant or senescent canopy rate. Specific characteristics of the plant architecture plasticity are evaluated dynamically, such as the leaf rolling. Phenological traits are also dynamic traits that are measured by detecting qualitative changes in plant morphology. In wheat, tillering, stem elongation and heading or flowering are evaluated by monitoring biophysical traits such as plant height or wheat head density.
Several definitions of functional traits exist in the literature due to the concept being explored in the context of plant phenotyping and ecology. C.M Caruso in the International Journal of Plant Science vol. 181 proposes that "functional traits are generally considered aspects of plant phenotypes that influence growth, survival, and reproduction by mediating interactions with the biotic and abiotic environment". We propose to define functional traits as traits describing canopy, plants, or organ reactions to the environment. Since they account explicitly for the environmental 17 conditions on some processes, they are expected to be less sensitive to some environmental factors. They will therefore be more heritable than most of the other traits. Efficiency traits are commonly used functional traits that evaluates the efficiency with which elements are used by the plant to grow. They include the radiation (RUE), water (WUE) and nitrogen (NUE) use efficiencies.
Before discussing the current state of play of the drone industry in agriculture, it's interesting to jump back to the roots of using drone equipment for agricultural imaging.
We can identify the birth of professional drone manufacturing back in 2010 when a few startups started to show up with the objective to bring Unmanned Aerial Vehicle (UAV) into production for business purposes. At that time, the agricultural sector started to identify use cases for drone phenotyping projects, and the most important KPI that the industry was looking for at that time was the surface coverage of the device. So basically, the early adopters wanted to be able to assess their field trials at large scale in a high-throughput fashion, and fixed-wings devices were the best-fitting equipment to match their expectations. Thus, the traits that they wanted to investigate with such drones were mainly multispectral traits for fertilization modulation purposes.
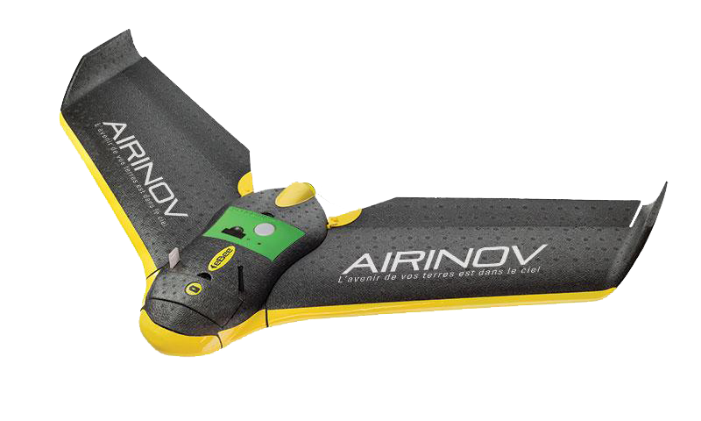
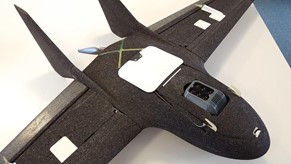
Companies such as Airinov and Delair were providing great drones at that time, but they quickly started to become outdated for crop assessment, here is why.
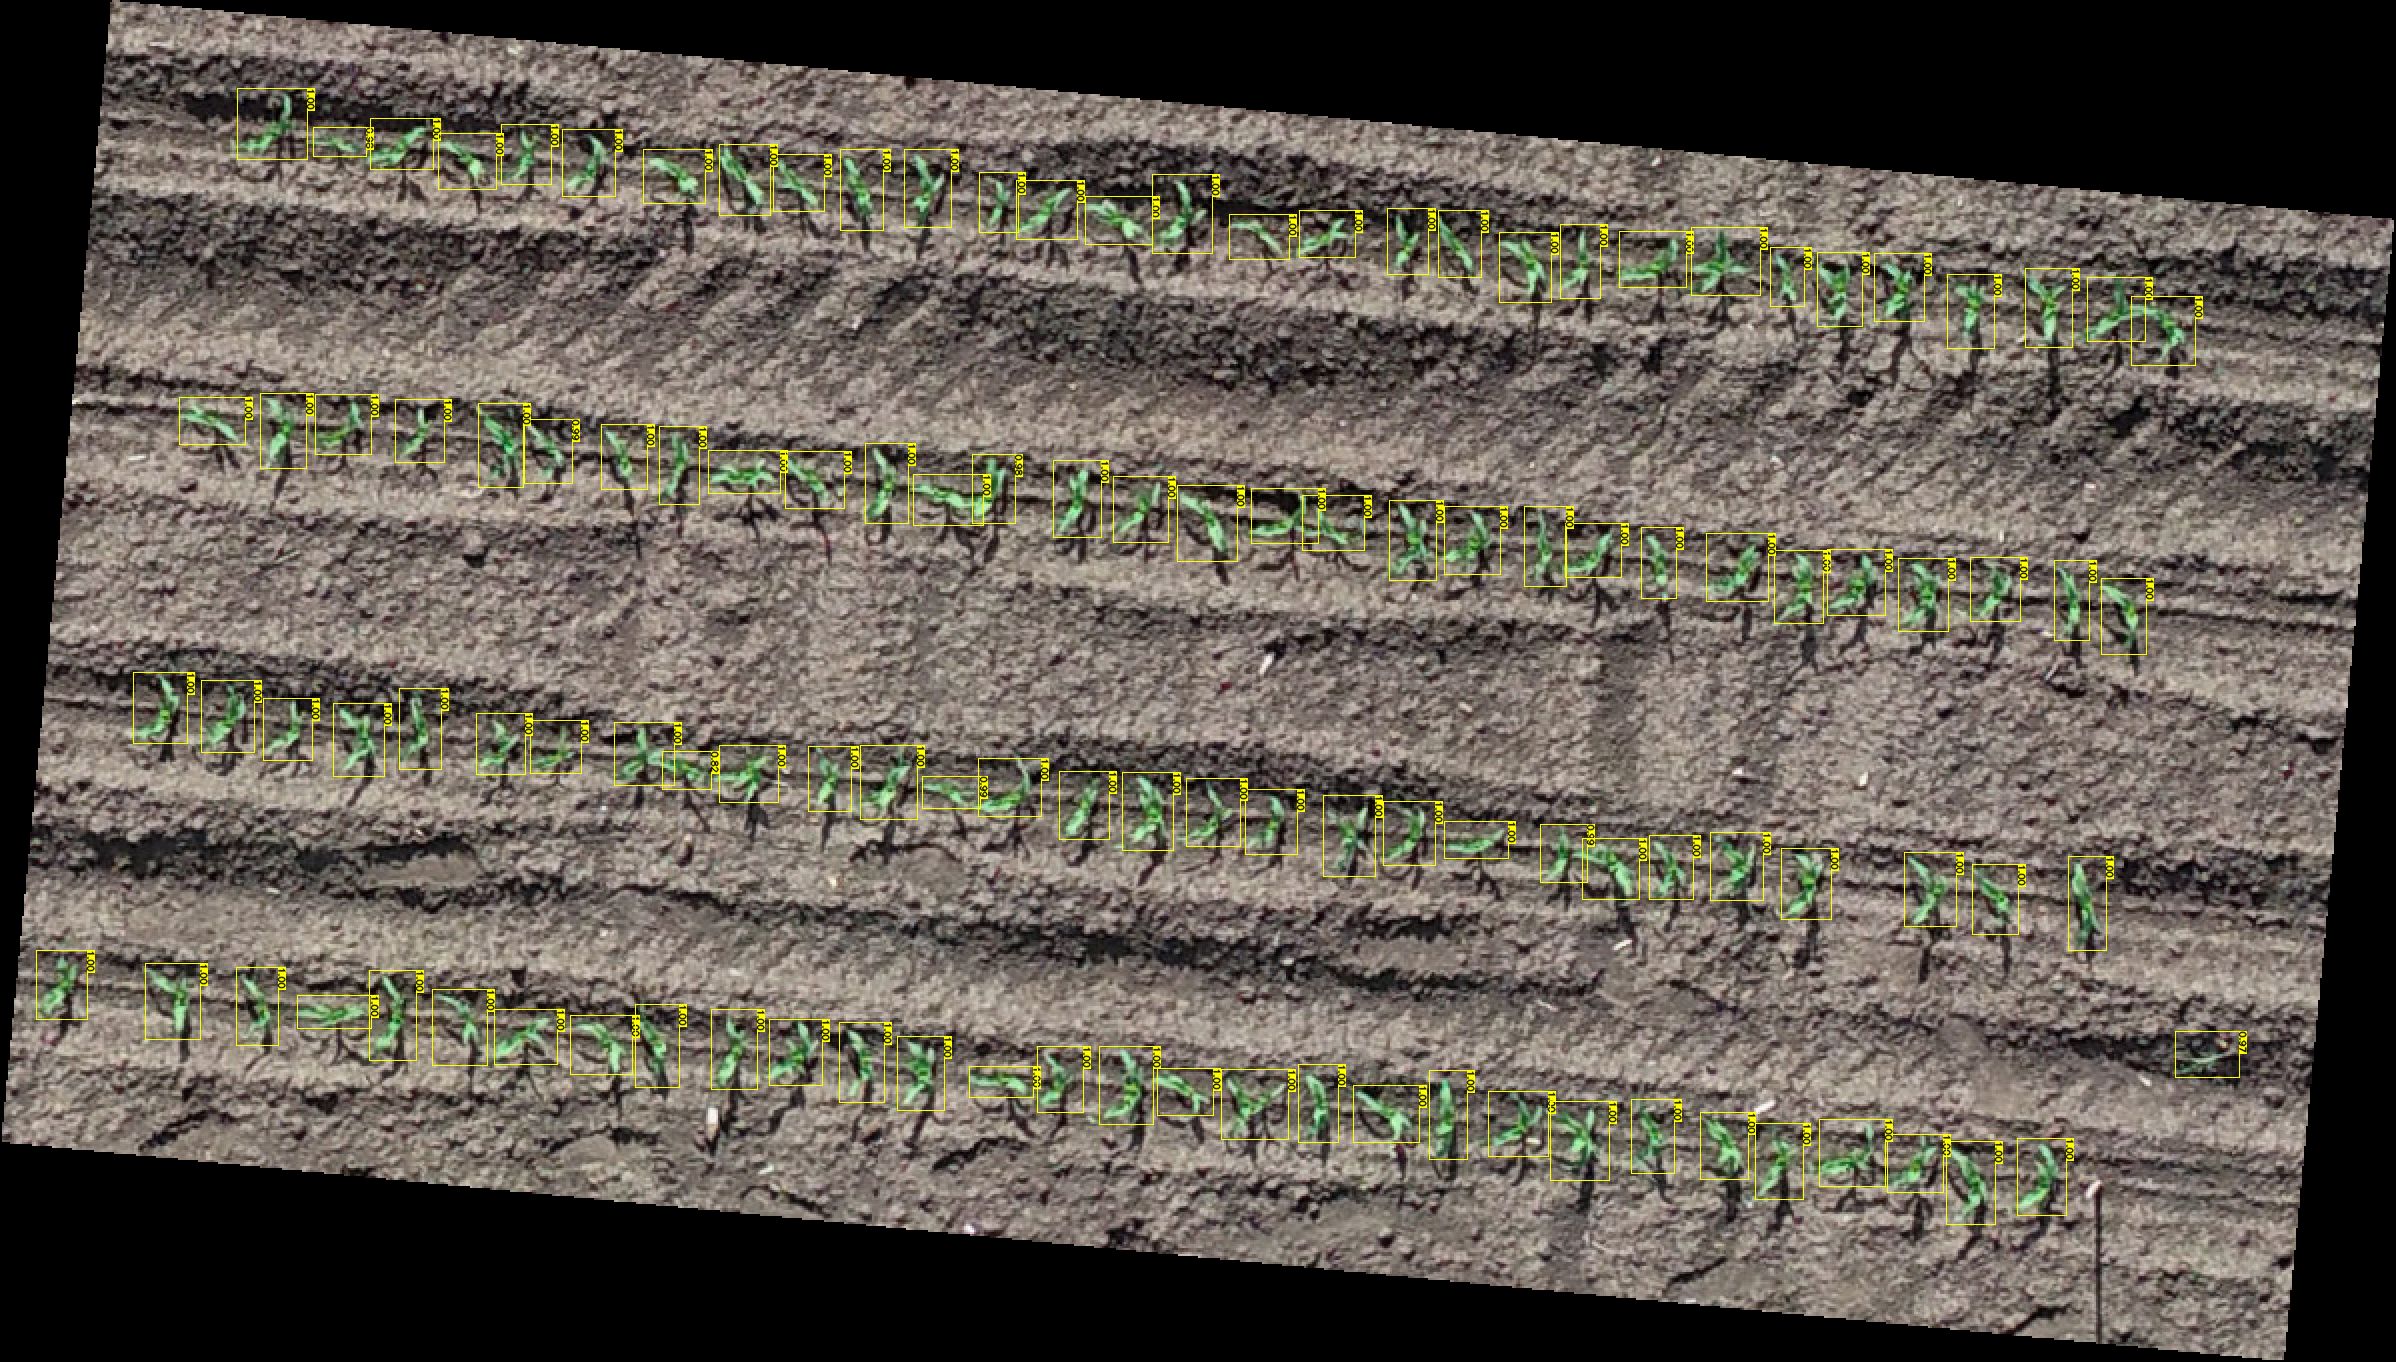
Around 2015, other companies such as Planet and ESA with the sentinel-2, came up with a totally different device approach: the satellite, but aiming at assessing field trials in the same way that drones did. Therefore, the drone industry had to adapt, that's the time were a common interest of the agricultural sector surfaced to use drones for smaller plant features inspections, at trial level, such as the canopy coverage (Fcover) and the plant count, for a few crops. Here is an example of drone phenotyping on maize:
Following the popular demand, the KPIs of interest became the image resolution and the flight configuration, meaning that quadcopter drones became the go-to devices, with their good-resolution embedded sensors and their improved maneuverability. Below you can find a picture of one of the first quadcopter drone phenotyping device to date. And as we like to call them at Hiphen, these devices can be categorized as the "DYI drones" because of their exposed wires and modeling-like esthetic.
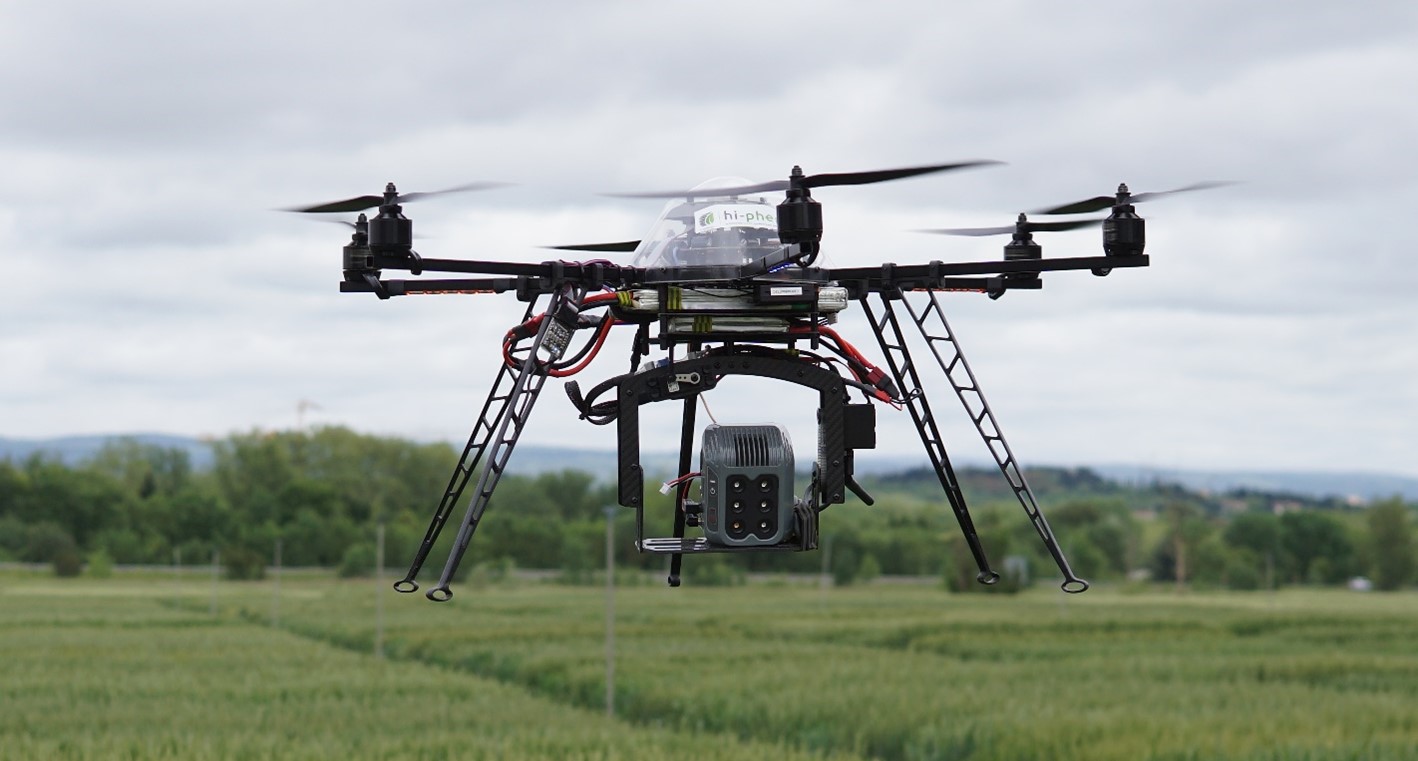
But the main drawback with the introduction of such "handmade" devices was the price point and also, they were not so easy to use. This new technology has for consequence a high price sensibility that made it sometimes not accessible to everybody's means. So, time was needed to widen access to this kind of equipment, and that's the time when DJI came out in 2018.
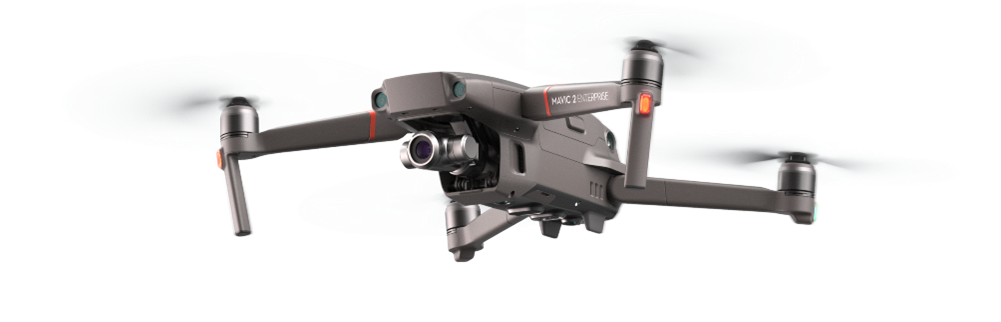
With the Mavic range (see the Mavic 2 Enterprise above), DJI brought a revolution to the market. Portable devices with embedded sensor that can be flown easily using a tablet or a small remote controller, that was clearly a game changer. Thus, more people started to being interested by drone phenotyping and to use them in their trials so, ever since at Hiphen, we have been working on drone data pipelines to develop new traits and to help you to uncover new plant features assessments remotely.
Then In 2020, we can say that drone phenotyping became more accessible with more offerings and more competition from companies such as Autel at least, which implied price drops for this kind of technology. From there, more and more people started to use drones in their field trials on a daily basis, that was the time of drone usage democratization. In addition to that, Artificial Intelligence (AI) is really reaching maturity now and we start to identify new possibilities for plant phenotyping with drones. So, on the one hand drones are now used by more and more crop researchers to collect data upon their crops' behavior, and on the other hand, new use cases are emerging since the technology is still improving. To bring answers to these new use cases, sensors providers such as DJI, SONY and PhaseOne have recently brought to the market high-resolution cameras that allow to give another dimension to drone flights. We are now able to assess more traits than never before, within one single image, thanks to the P3, P1 and L1 (LiDAR) sensors.
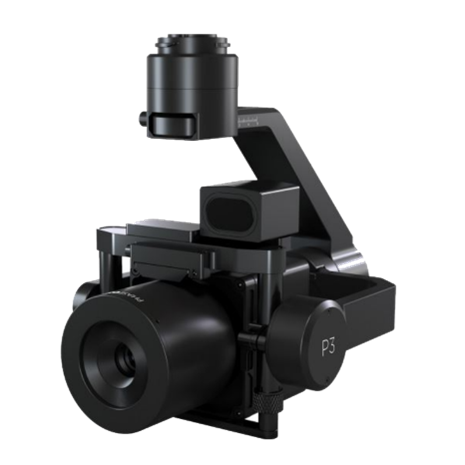
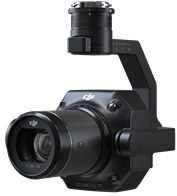
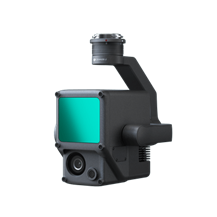
Is it worth the investment though? Well, it depends on the traits that you want to assess and on your budget obviously.
Therefore, at Hiphen we now envision to focus on making large scale assessments of simple plant features such as plot quality, plant lodging, plant count, early vigor and so on, with low-costs drone equipment because we now have well-vetted data pipelines for these devices and sensors. By low-costs drone equipment we don't mean cheap, but affordable such as the DJI Mavic 2 and its competitors because now they represent a great value for price. This kind of equipment is perfect to assess simple plant features at scale because the traits require standard resolution, and the embedded sensor of these drones are suitable to get the job done.
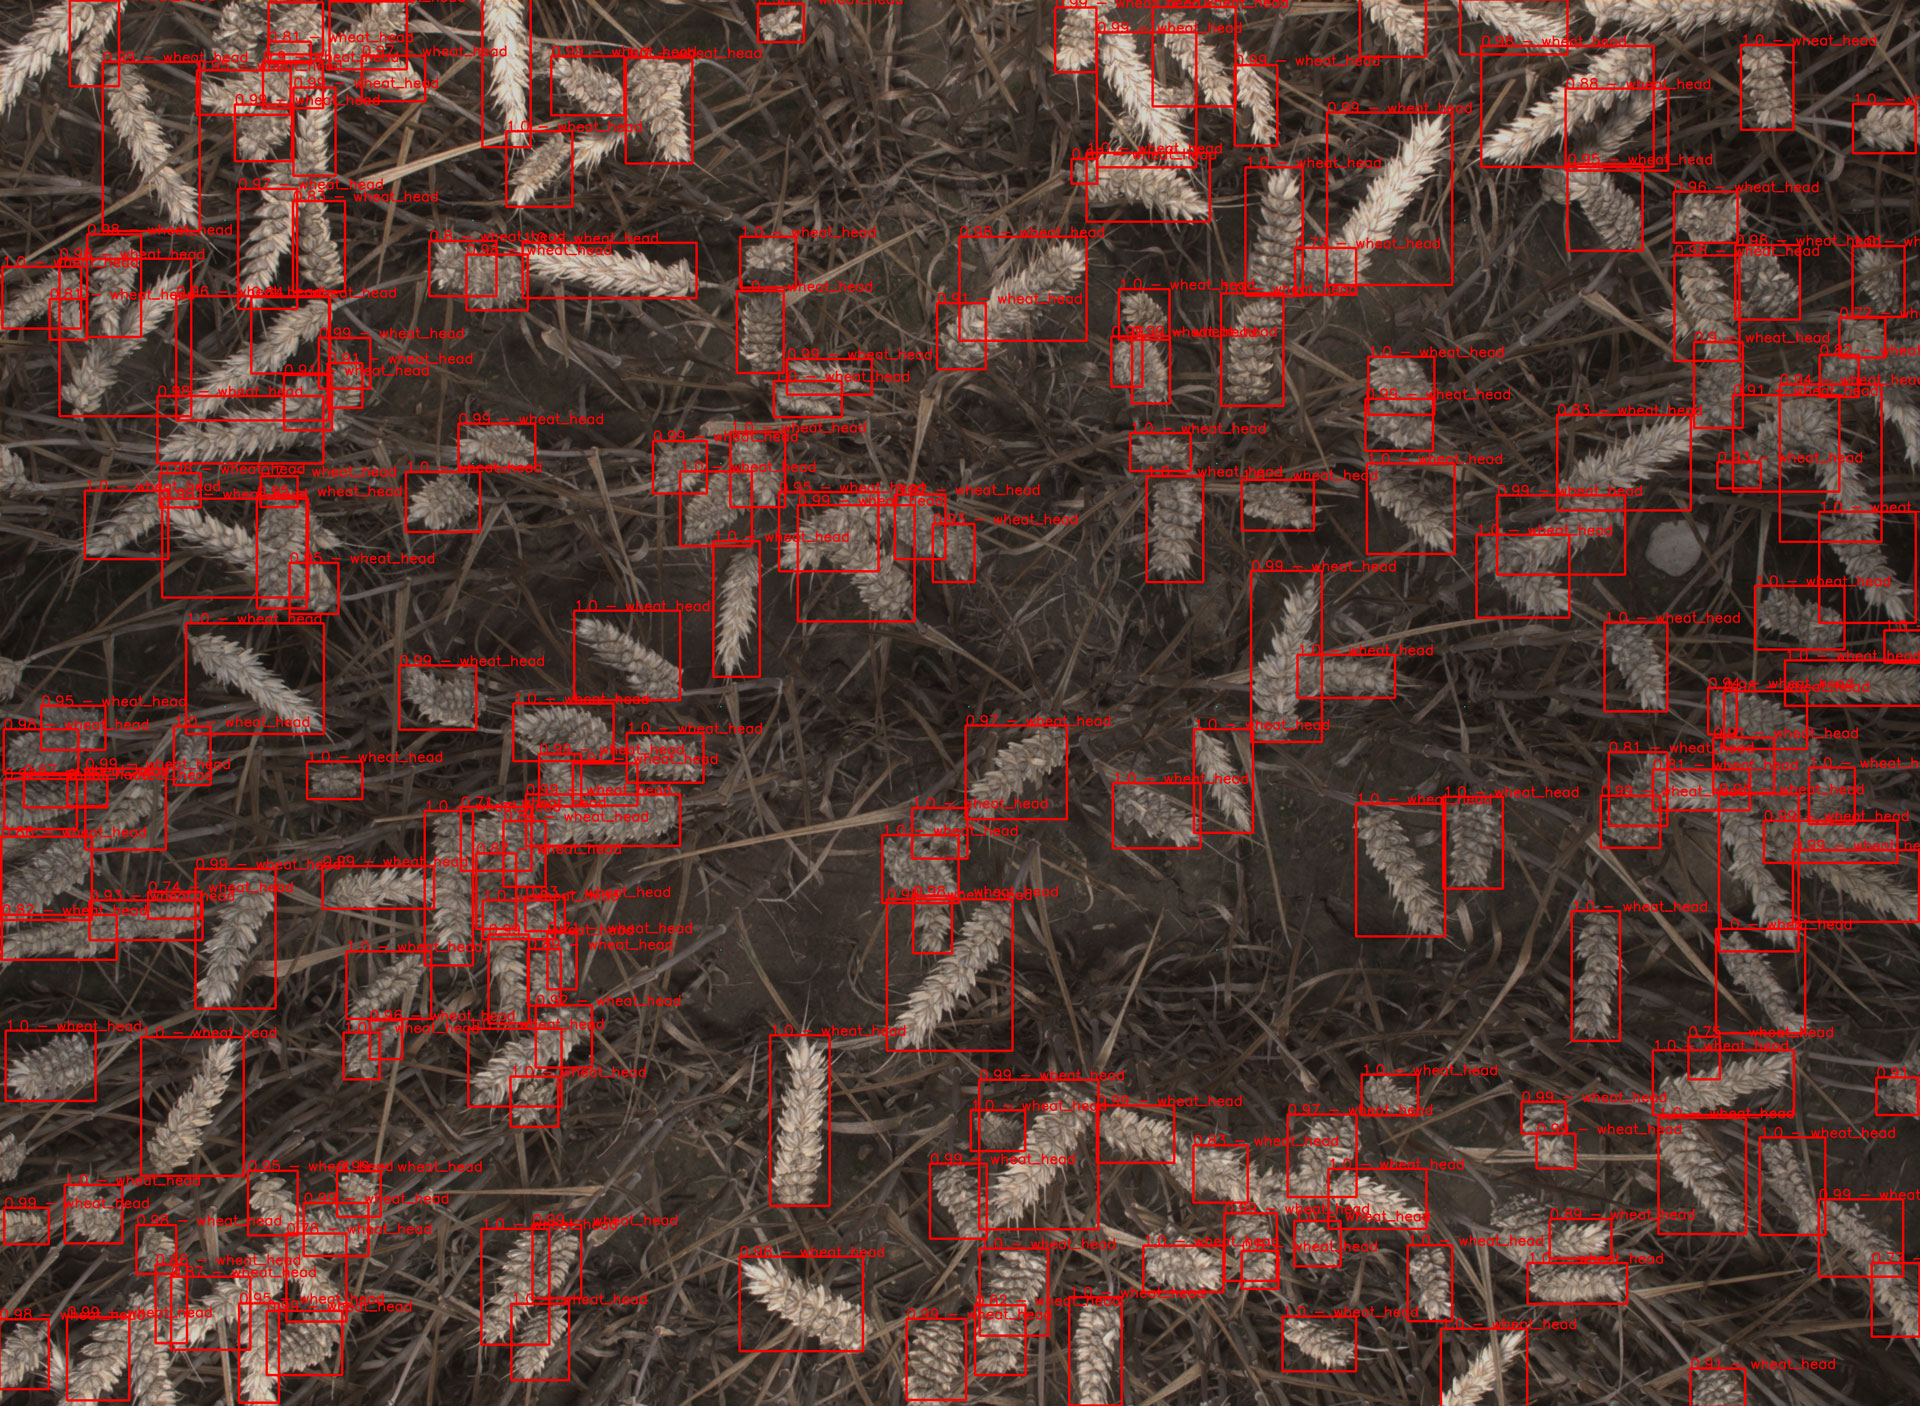
In addition, we are starting to scale up complex plant features assessments, which necessitate more image resolution, such as yield estimation, organ counting and diseases detection at least, using higher-resolution drone equipment. Here is wheat head counting for instance:
However, exactly as it did in 2015 with quadcopter drones, these new high-resolution drones and sensors are quite expensive while entering the market. As it stands for now, we really think that they are suitable if you have a precise and urgent need of this kind of equipment for current phenotyping projects, otherwise, our data pipelines are on point to assess routinely a lot of agronomic traits from our portfolio to help you to add valuable phenotypic data to your research programs.
To conclude, drones are now reaching maturity for plant phenotyping purposes. Indeed, a lot of devices and sensors can help you to answer your needs whatever your budget is. Stay connected to discover our drone equipment comparative table coming soon!
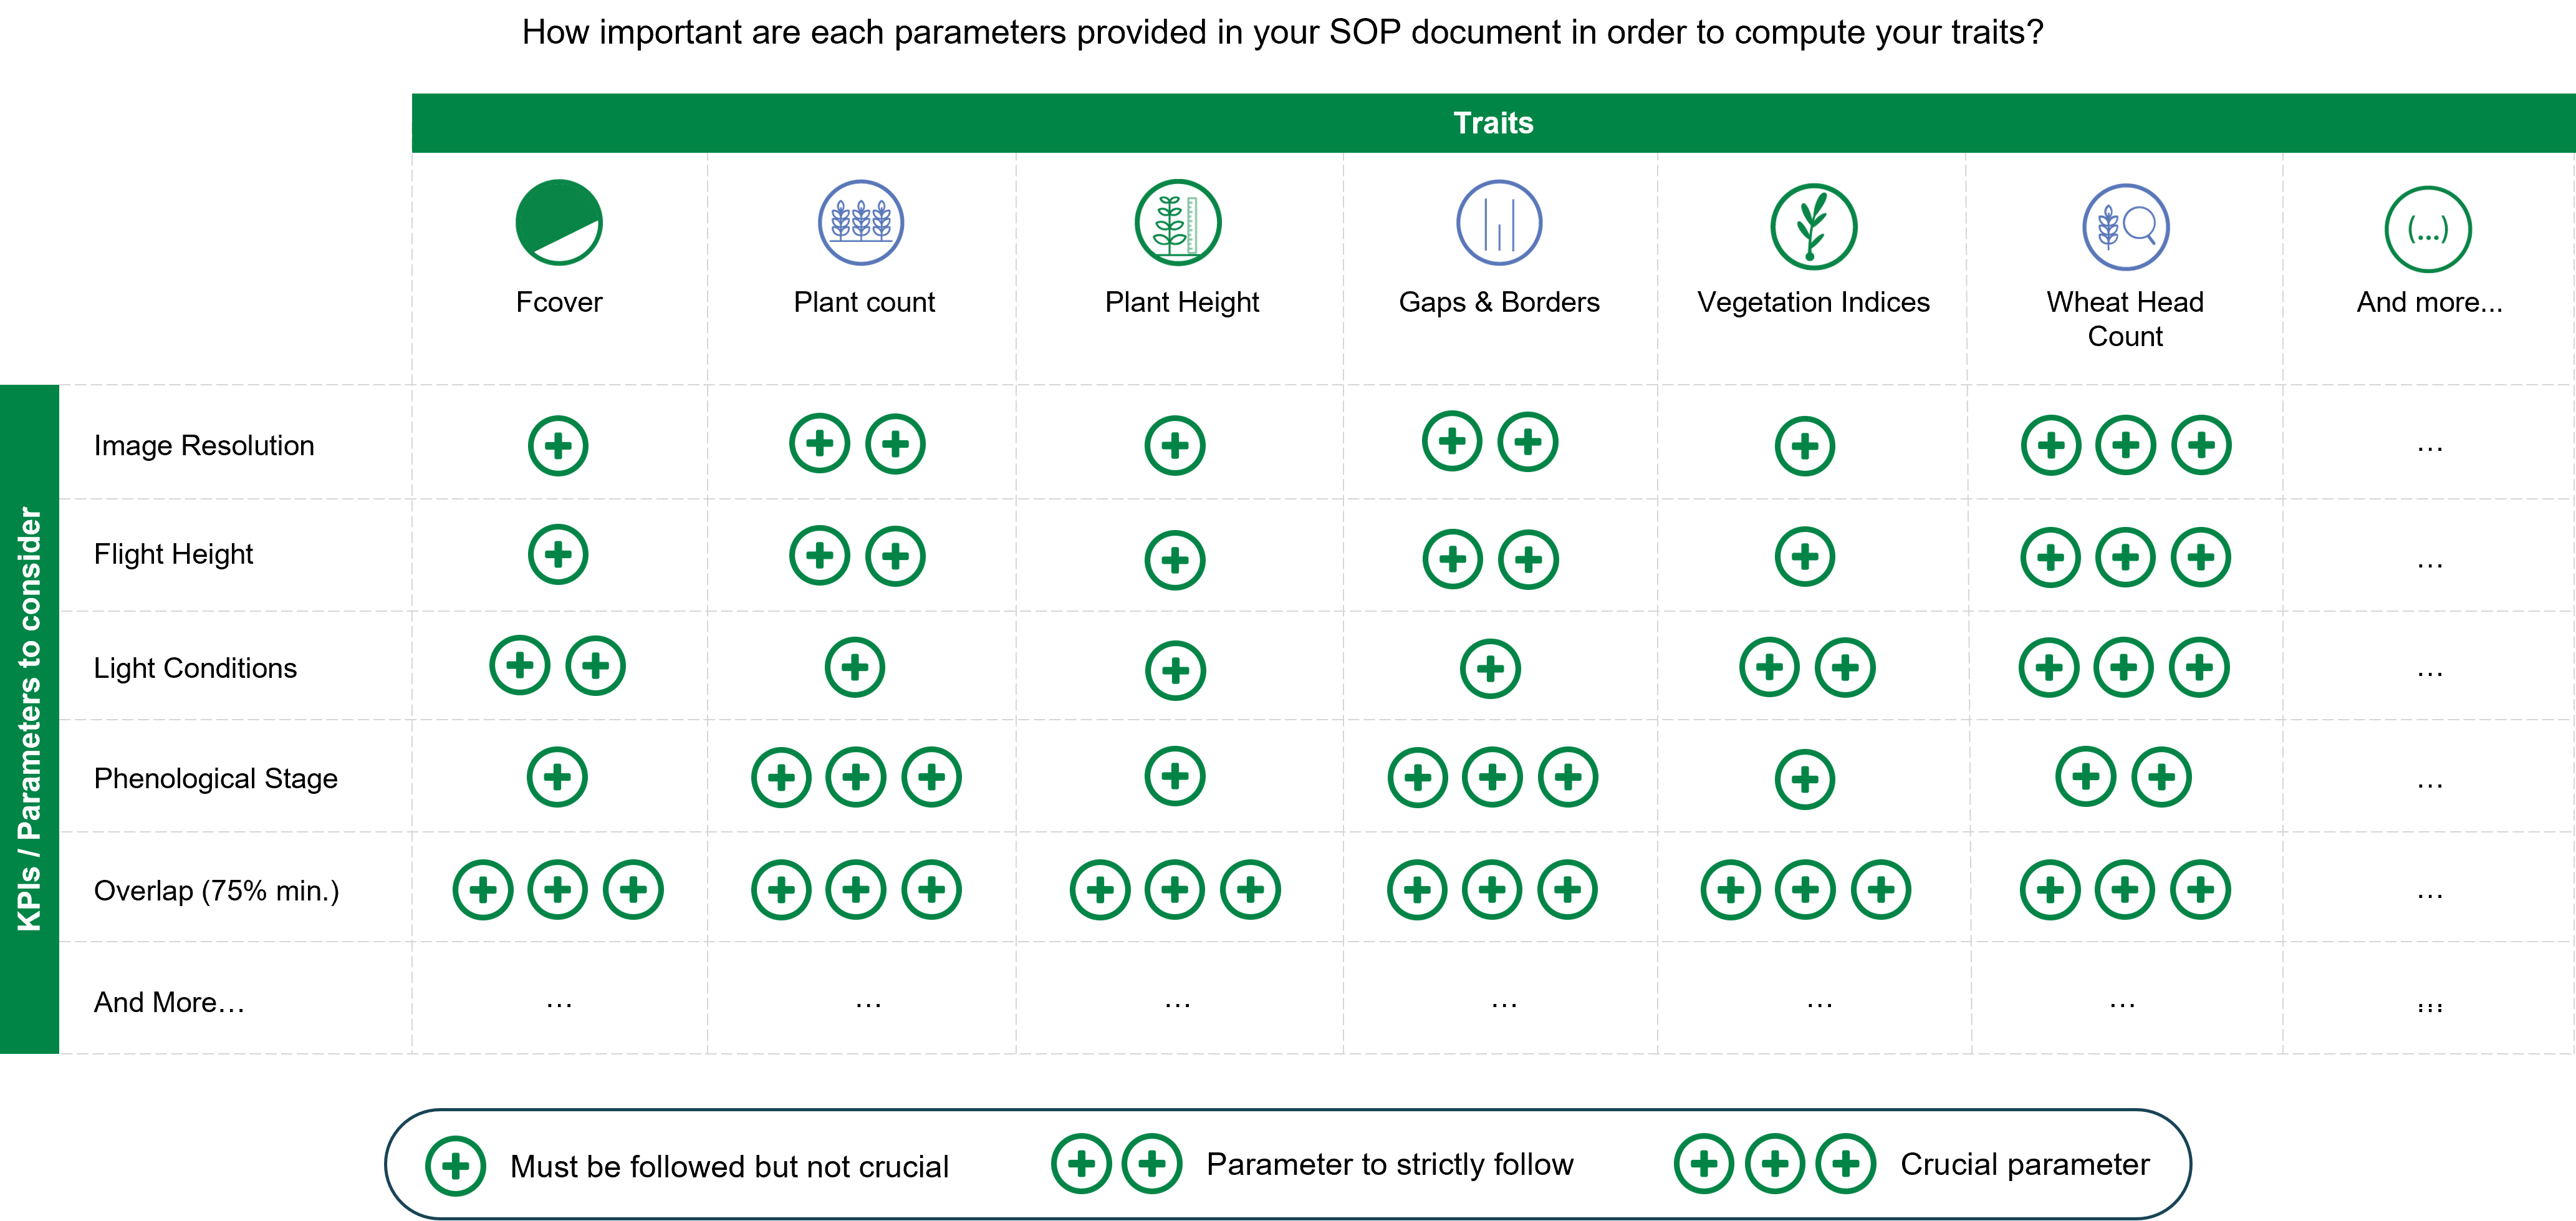
Meanwhile, don't forget that the right sensor for your projects should adapt to the requirements of the traits you want to compute and not the other way around. You can find some examples in the table below:
At Hiphen, we always give our best to extract maximum value from your field trial datasets to help you answer your phenotyping ambitions with quality-focused data. Thus, we are here to accompany you in your phenotyping journey from helping you to select the best-fitting device all the way through to providing you with the best recommendation and flight procedures, for a fast and accurate data processing of your selected traits.
Feel free to contact us should you have any question at www.hiphen-plant.com/contact/. We look forward to hearing from you.
Speak soon,
Your Hiphen team.