
Cloverfield v2.8.0 – October 04th, 2023
New features have recently been added to Cloverfield™, your plant phenotyping online platform, and in this blog post we are going to take a deeper dive into those 6 new features:
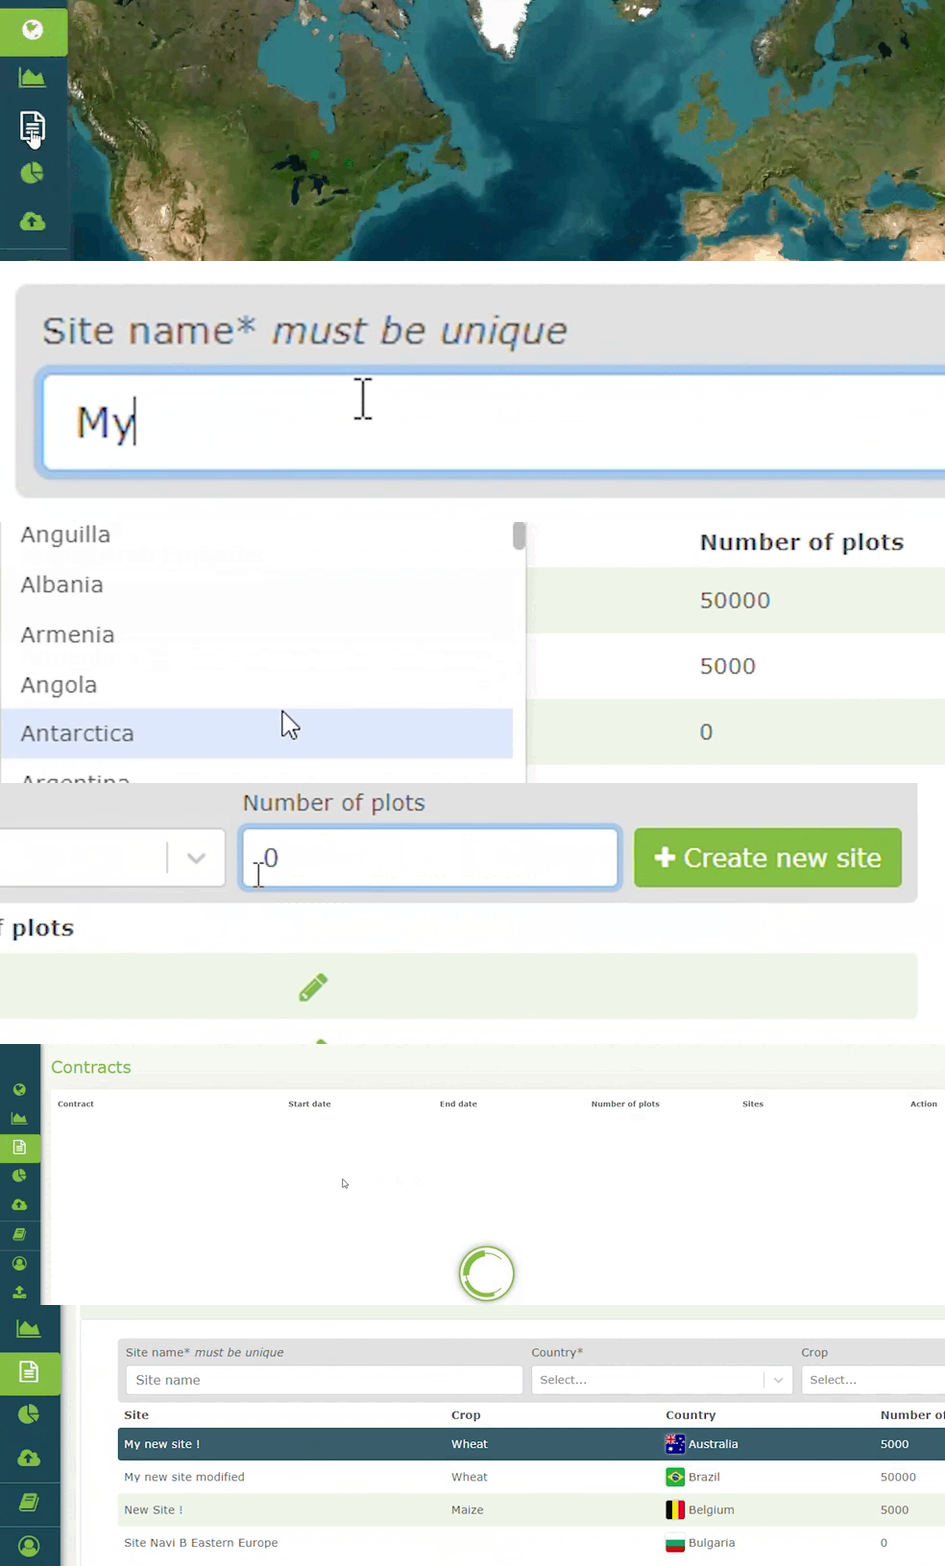
You can now autonomously manage the creation of new trial sites directly through Cloverfield™. Add a new location or change its name without having to ask your Hiphen Campaign Manager. Only accessible for users with 'Admin' rights assigned to the contract.
💎 User value: Save time and be autonomous with your campaign management.
⚙️ Use Cases:
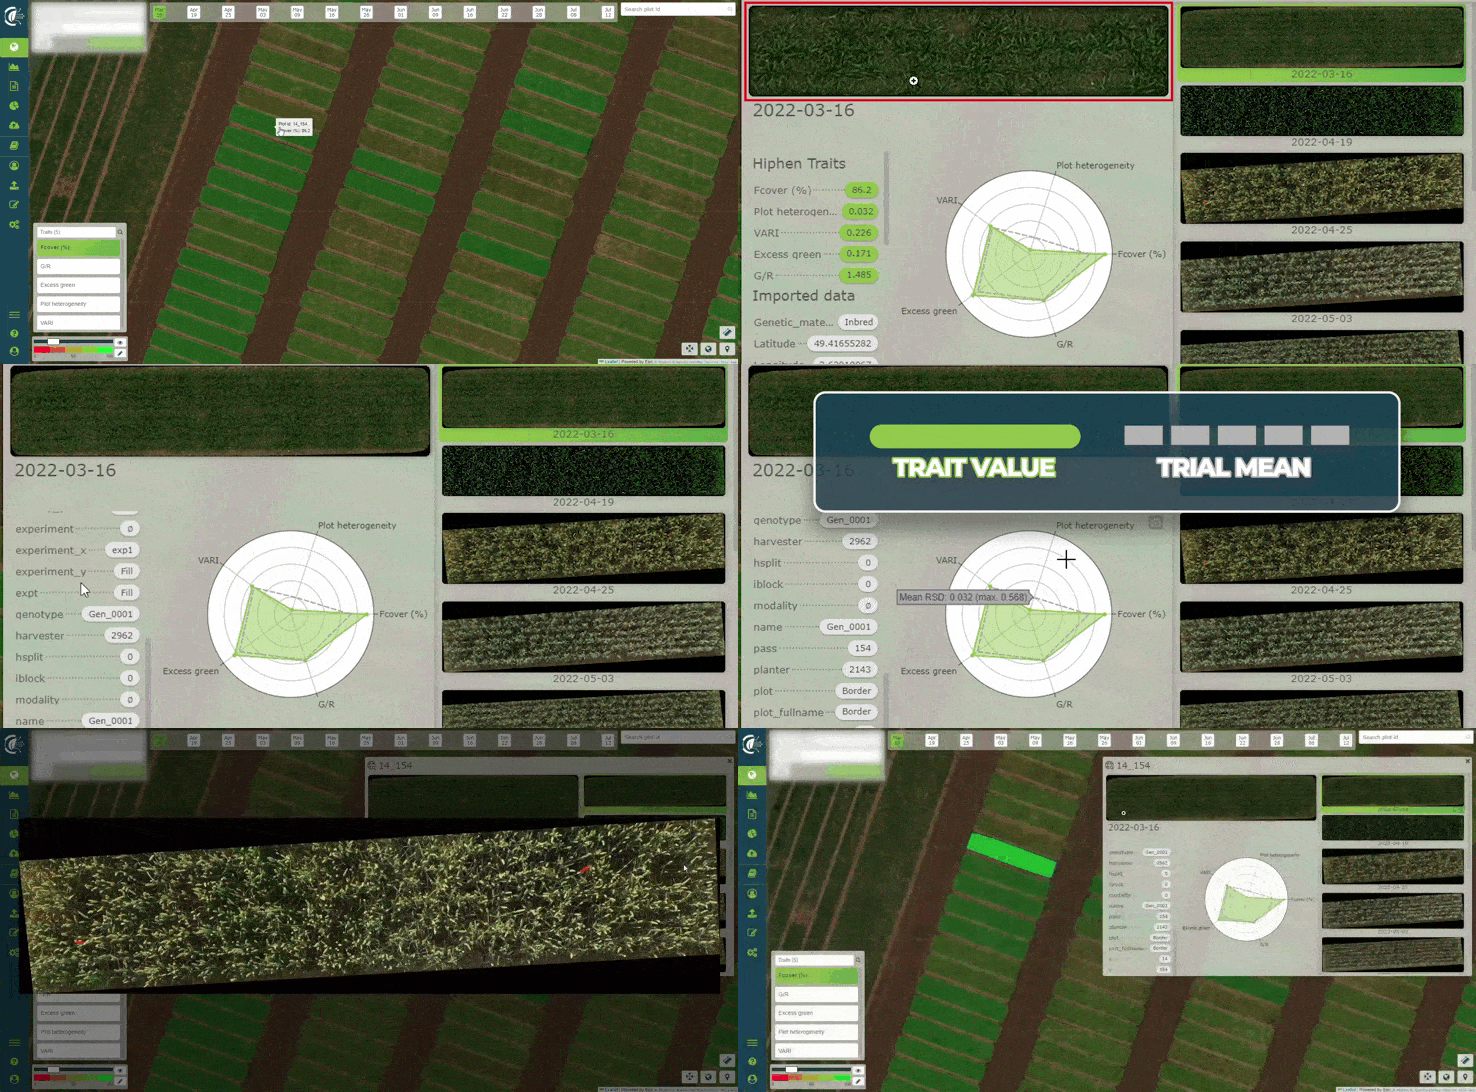
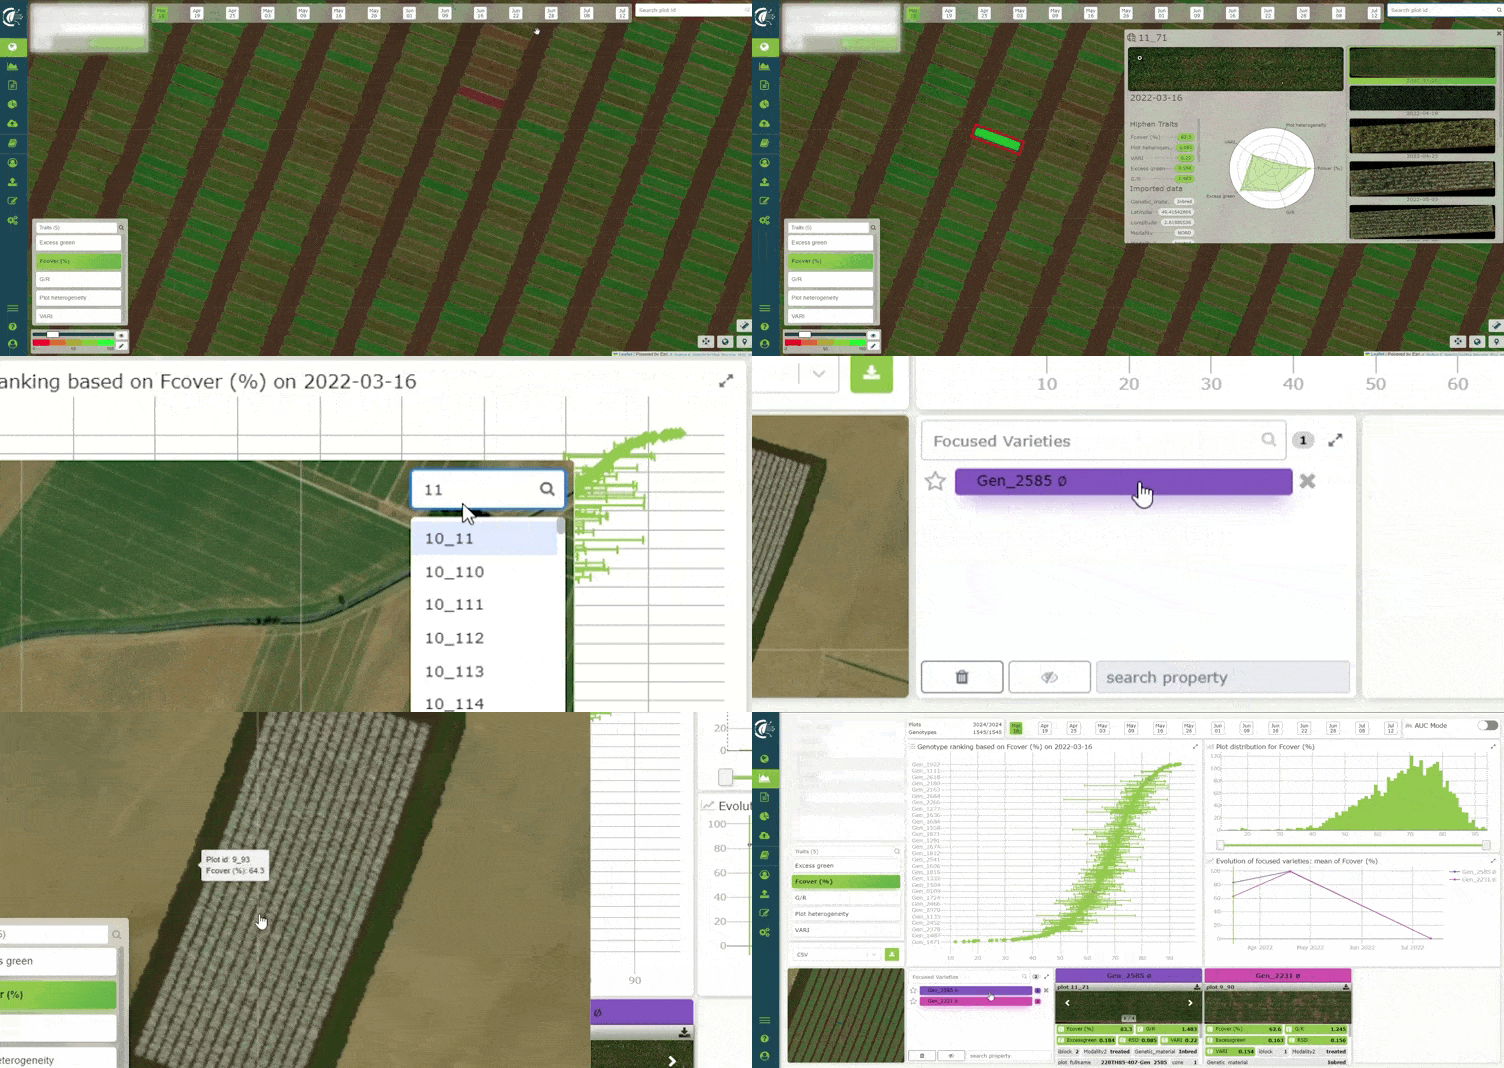
Clicking on a plot in the map view will give you access to a new window that displays next to each other the plot images from each flight. You can now efficiently visualize a single plot’s evolution through time in one click.
The new window also provides the trait results computed for the selected plot at the selected date. Finally, a new spider chart helps to efficiently assess how the plot performed versus the trial’s mean.
💎 User value: Access plot information and history at once for faster inspection and decision-making during the campaign.
⚙️ Use Cases:
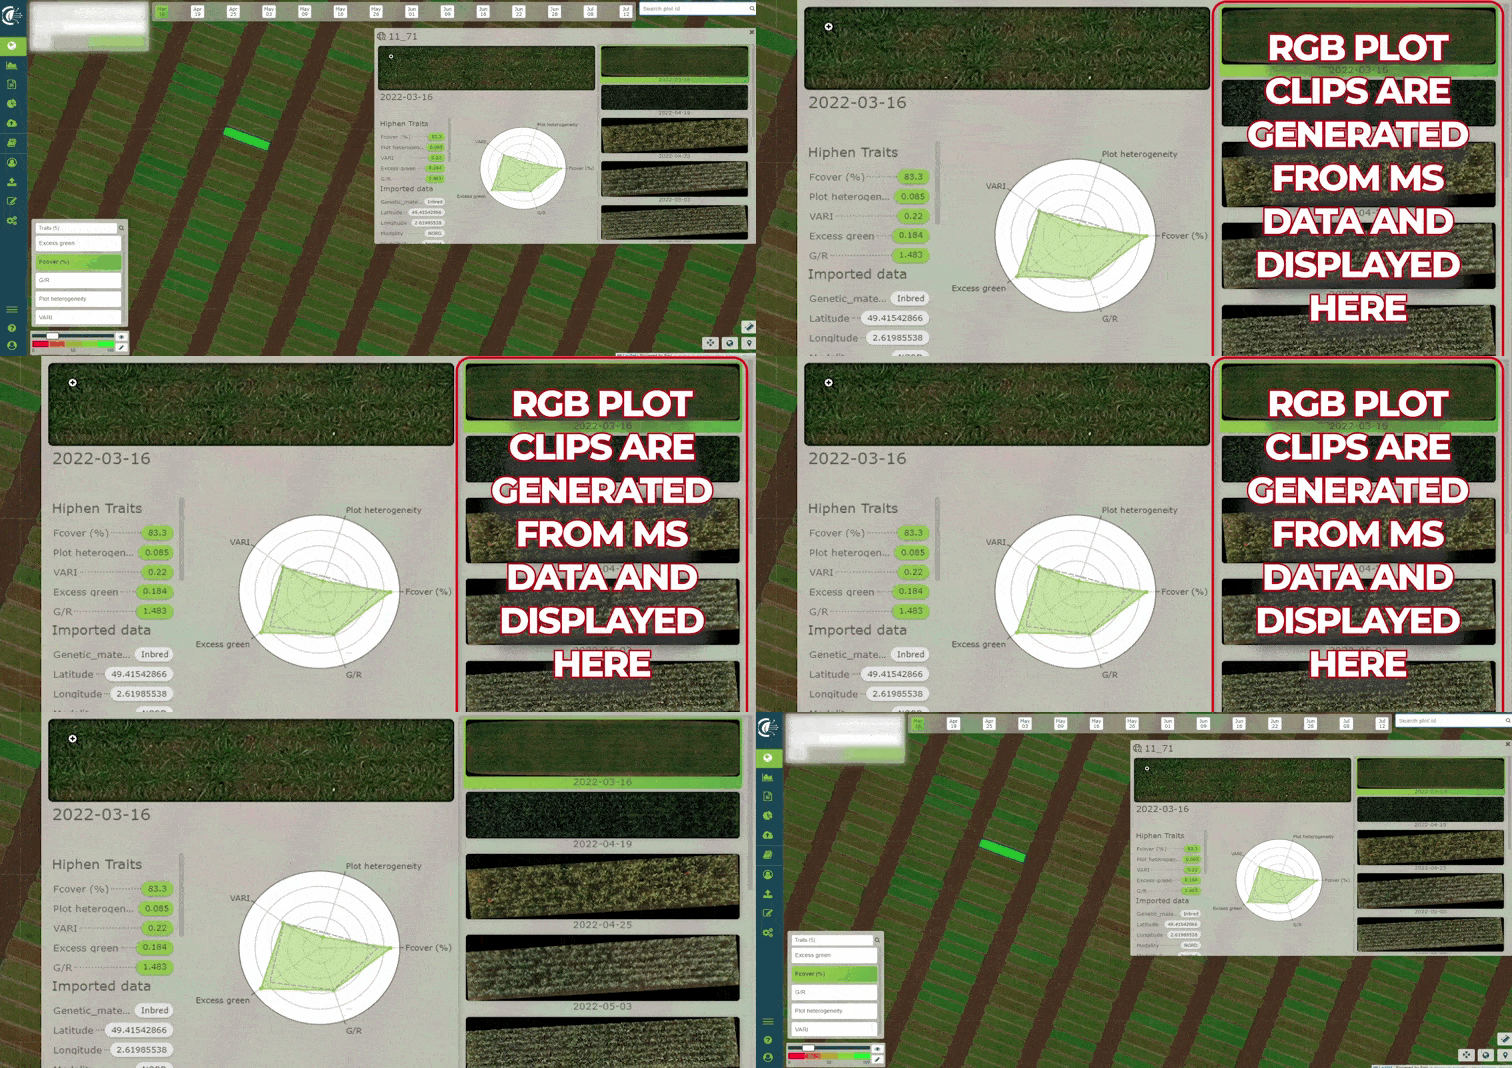
For future multispectral flights, RGB plot clips will be generated from the orthomosaic and posted into the analytics tool. Just as it is the case for RGB flights, you’ll then be able to inspect multispectral plot imagery in more details directly from Cloverfield™.
**💎 User value:**Check the raw image of your plot acquired with a MS sensor.
⚙️ Use Cases:
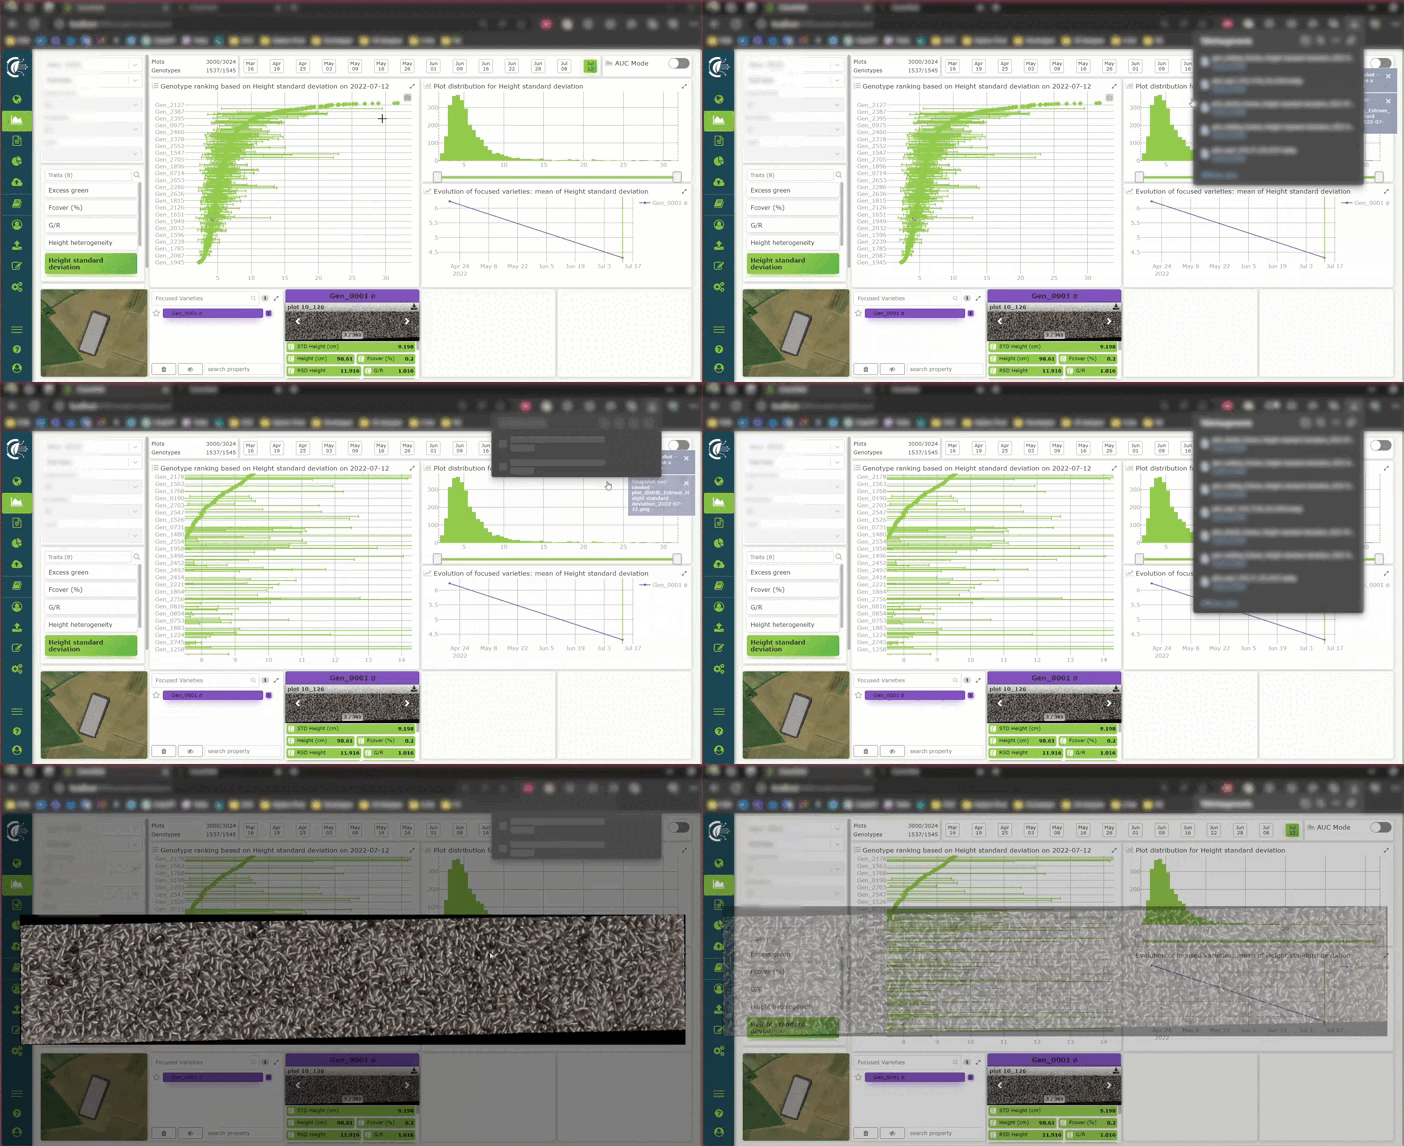
Download graphs displayed in the Analytics tool and any plot clips to insert them into your presentations and internal communication. The file format will be an image (.webp) which will following the following file naming convention: site name_date_plot name.webp.
**💎 User value:**Boost your internal communication about the results of your trial programs.
⚙️ Use Cases:
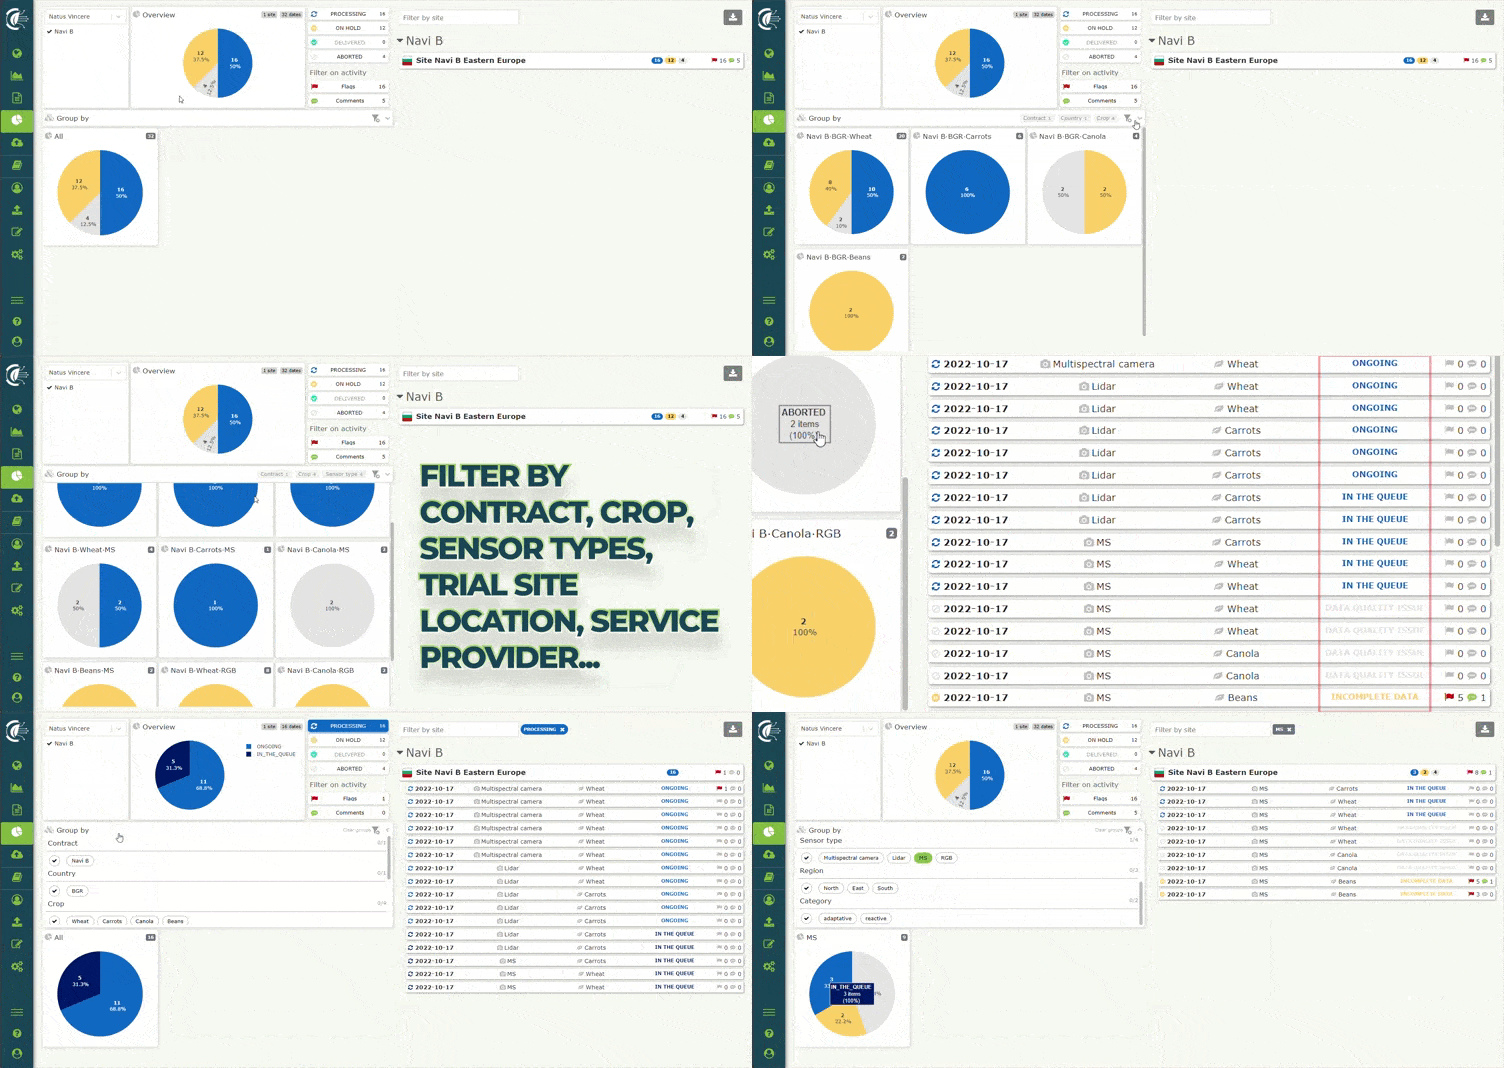
We have refreshed the design of the monitoring tool that keeps you informed of the data processing progress for each flight you upload. The page ergonomics has been improved and we added new filters based on your feedback. You can now group specific filters to get a more granular and custom progress tracking update. Filters include campaign, region, country, crop and sensor type.
You can also filter flags and comments posted by your Hiphen Campaign Manager in a more intuitive manner. This allows you to very efficiently focus on datasets that require your attention.
💎 User value: Get all the transparency you need about data processing progress, pinpoint flights that require attention and use this tracking tool for your own internal reporting.
⚙️ Use Cases:
In the map and analytics pages, at the top right corner of the map, enter a specific plot name in the search bar to pinpoint its position on the plot map and select it.
Once the search bar is used, we will automatically suggest you to add the plot of interest to the 'plot exploration' section of the analytics page.
**💎 User value:**Save time exploring specific plots of interest.
⚙️ Use Cases:
For more information, reach out to your Hiphen Campaign Manager. Stay tuned for the next Cloverfield™ features release update next month.
Sincerely, Your Hiphen Success Team.

As agriculture continues to embrace digital transformation, the advent of data-driven technologies has ushered in a new era of precision farming and sustainable practices. At the heart of this transformation lies the Application Programming Interface (API), a set of functions and protocols that enables seamless data exchange and communication between applications, operating systems, and web servers.
In the realm of data-driven agriculture, APIs play a pivotal role in empowering farmers, researchers, and agribusinesses to harness the full potential of the data they and third-parties are collecting.
In this blog post, we will delve into the numerous benefits of APIs in the agriculture realm, with a focus on the integration of the Cloverfield application and how it leads to automation, efficiency, and secure data exchange.
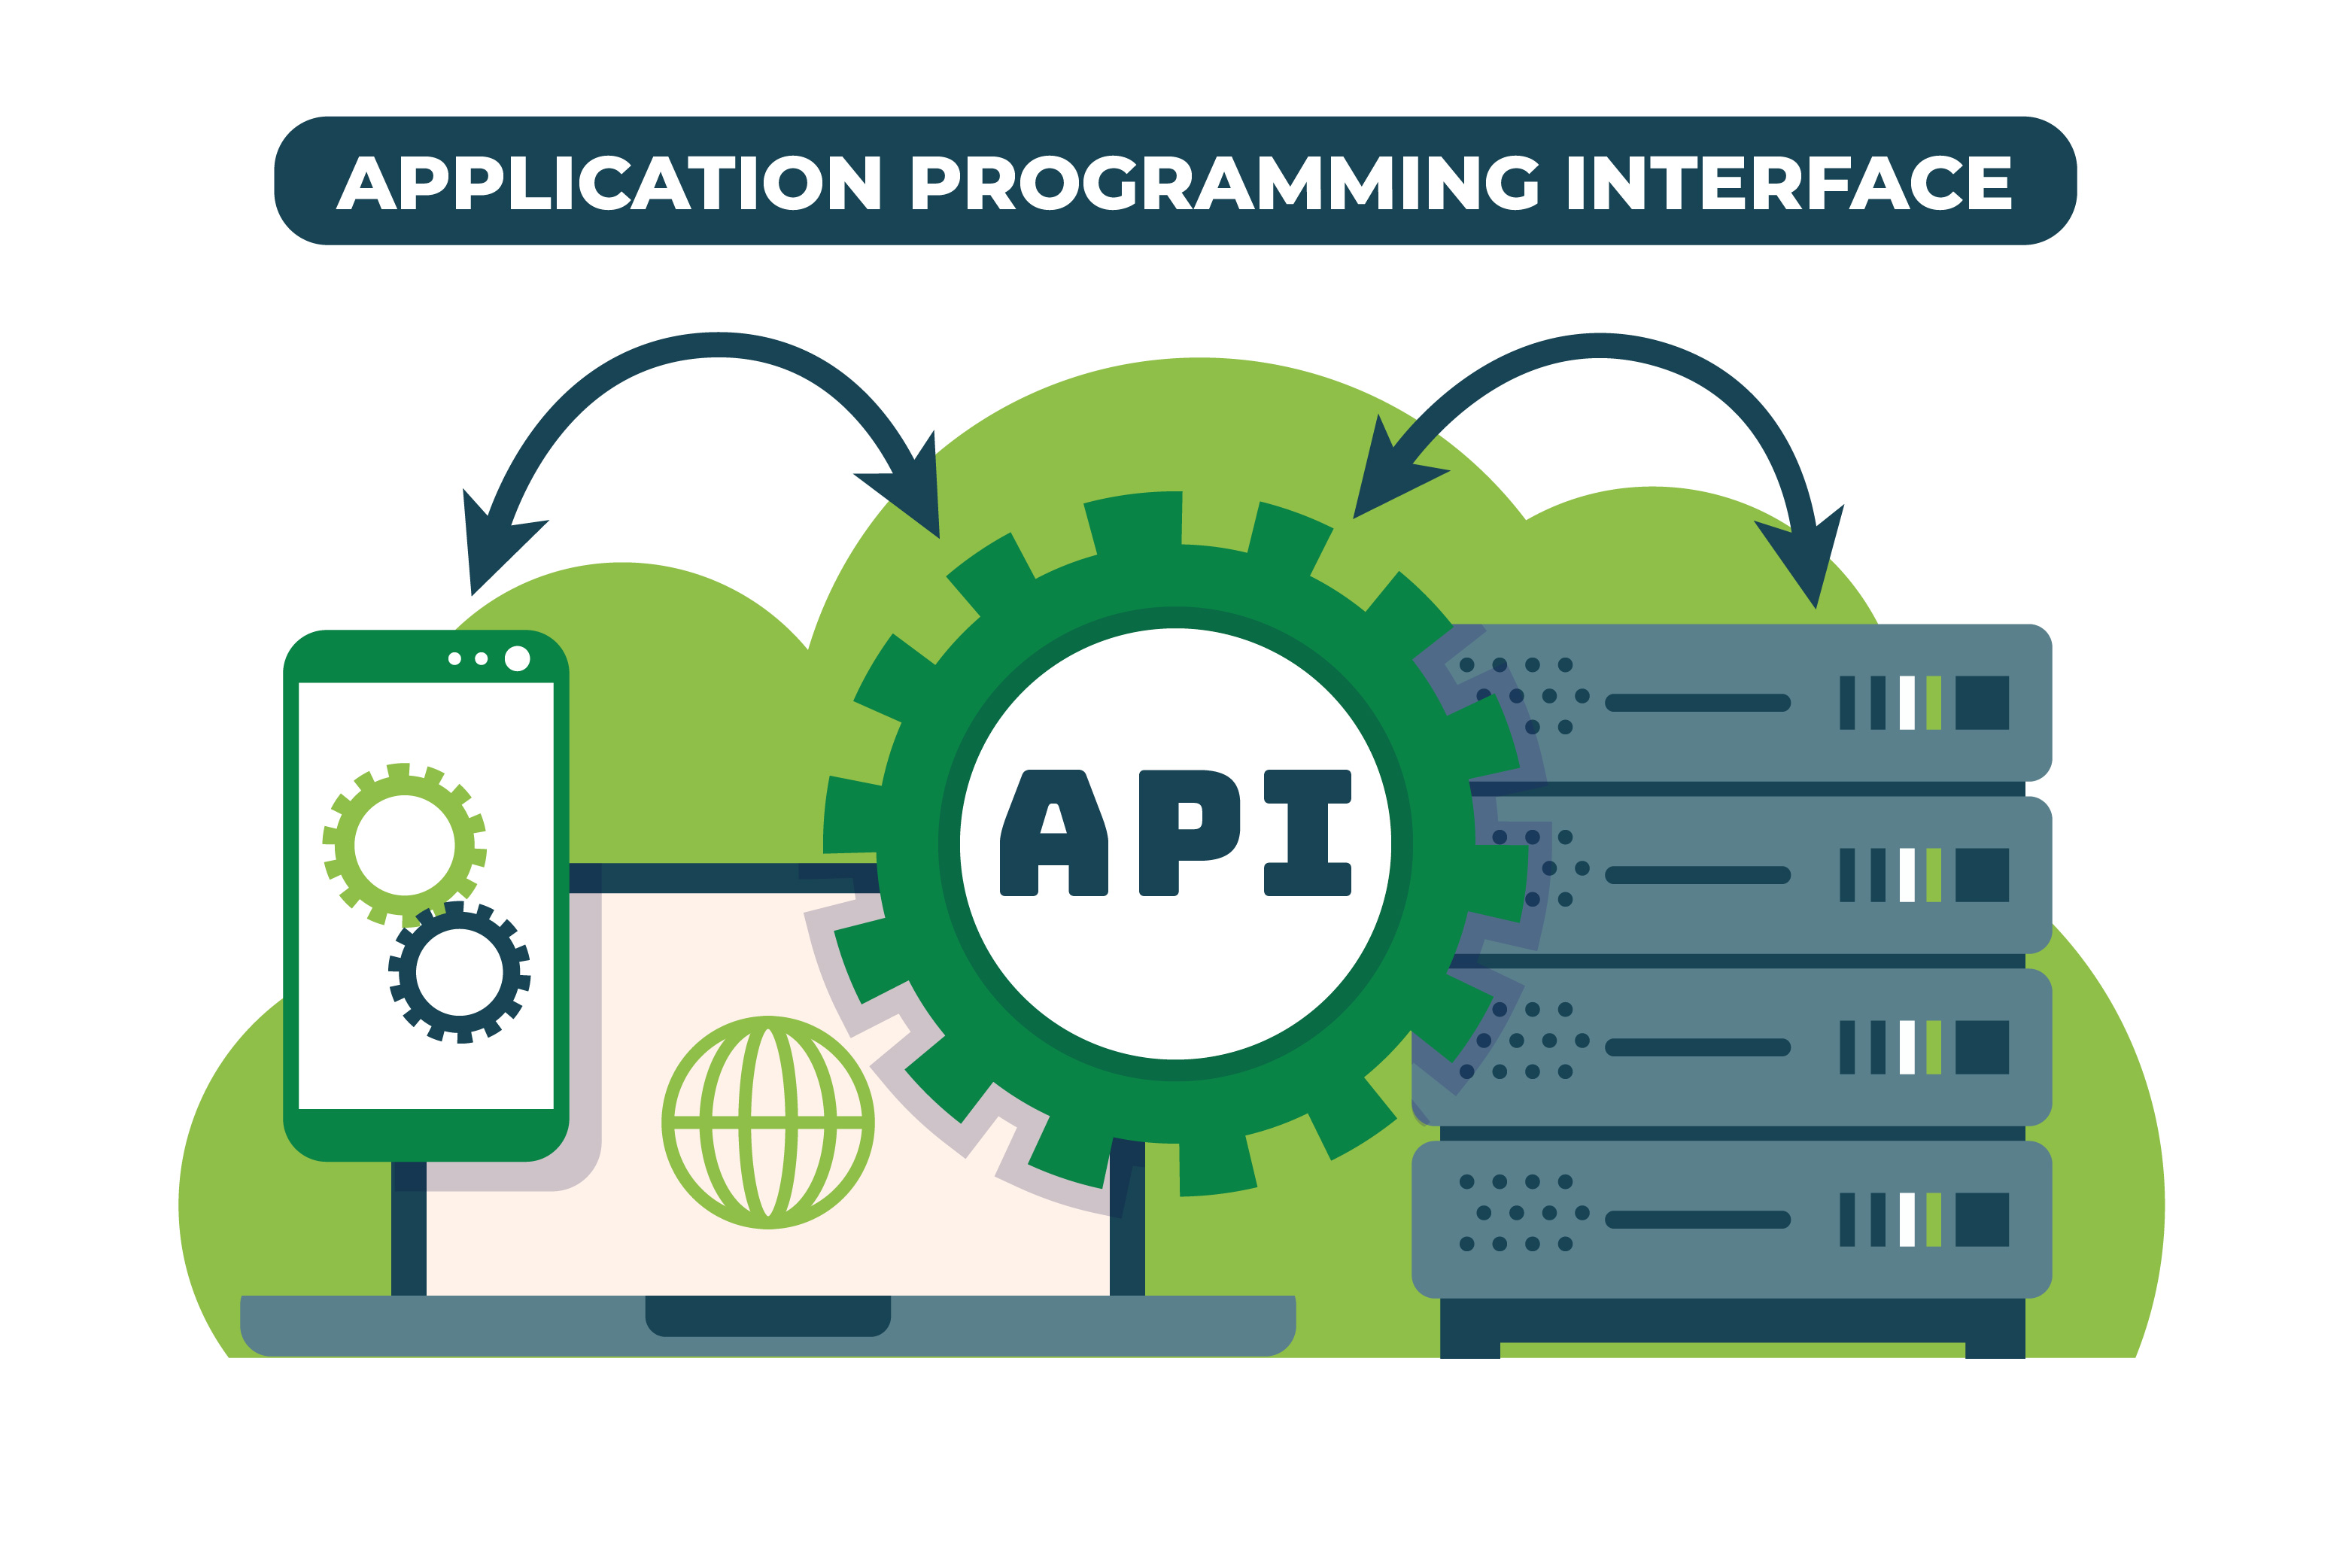
An API connects one service to another to share and exchange information automatically and securely.
The agriculture sector generates vast amounts of data from diverse sources, including weather stations, soil sensors, drones, and satellite imagery. API-driven integration facilitates the seamless exchange of this data, allowing stakeholders to access and combine information from different platforms. By providing a unified view of the data, APIs empower decision-makers to gain valuable insights and make informed choices to boost plant research, crop management and resource optimization.
In the context of the Cloverfield application, APIs enable the automation of tasks that once required human intervention. By integrating Cloverfield with other applications through APIs, researchers can effortlessly collect and analyze data without manual effort, saving valuable time and resources to focus on what matters the most.
Precision agriculture is at the forefront of modern agricultural practices, and APIs are instrumental in its success. These interfaces enable client applications to securely communicate with Cloverfield, exchanging datasets and retrieving valuable results from the processing of plant assessments. Through APIs, researchers, product developers and producers gain access to real-time and historical data, such as weather forecasts, soil health reports, and crop performance metrics.
Armed with this data-driven knowledge, researchers can implement accurate decision-making processes. They can optimize breeding cycles, trial quality assessment, product performance evaluation, harvest quality and plant stress assessments, all leading to increased crop yields and improved resource efficiency that help shaping the agriculture of tomorrow.
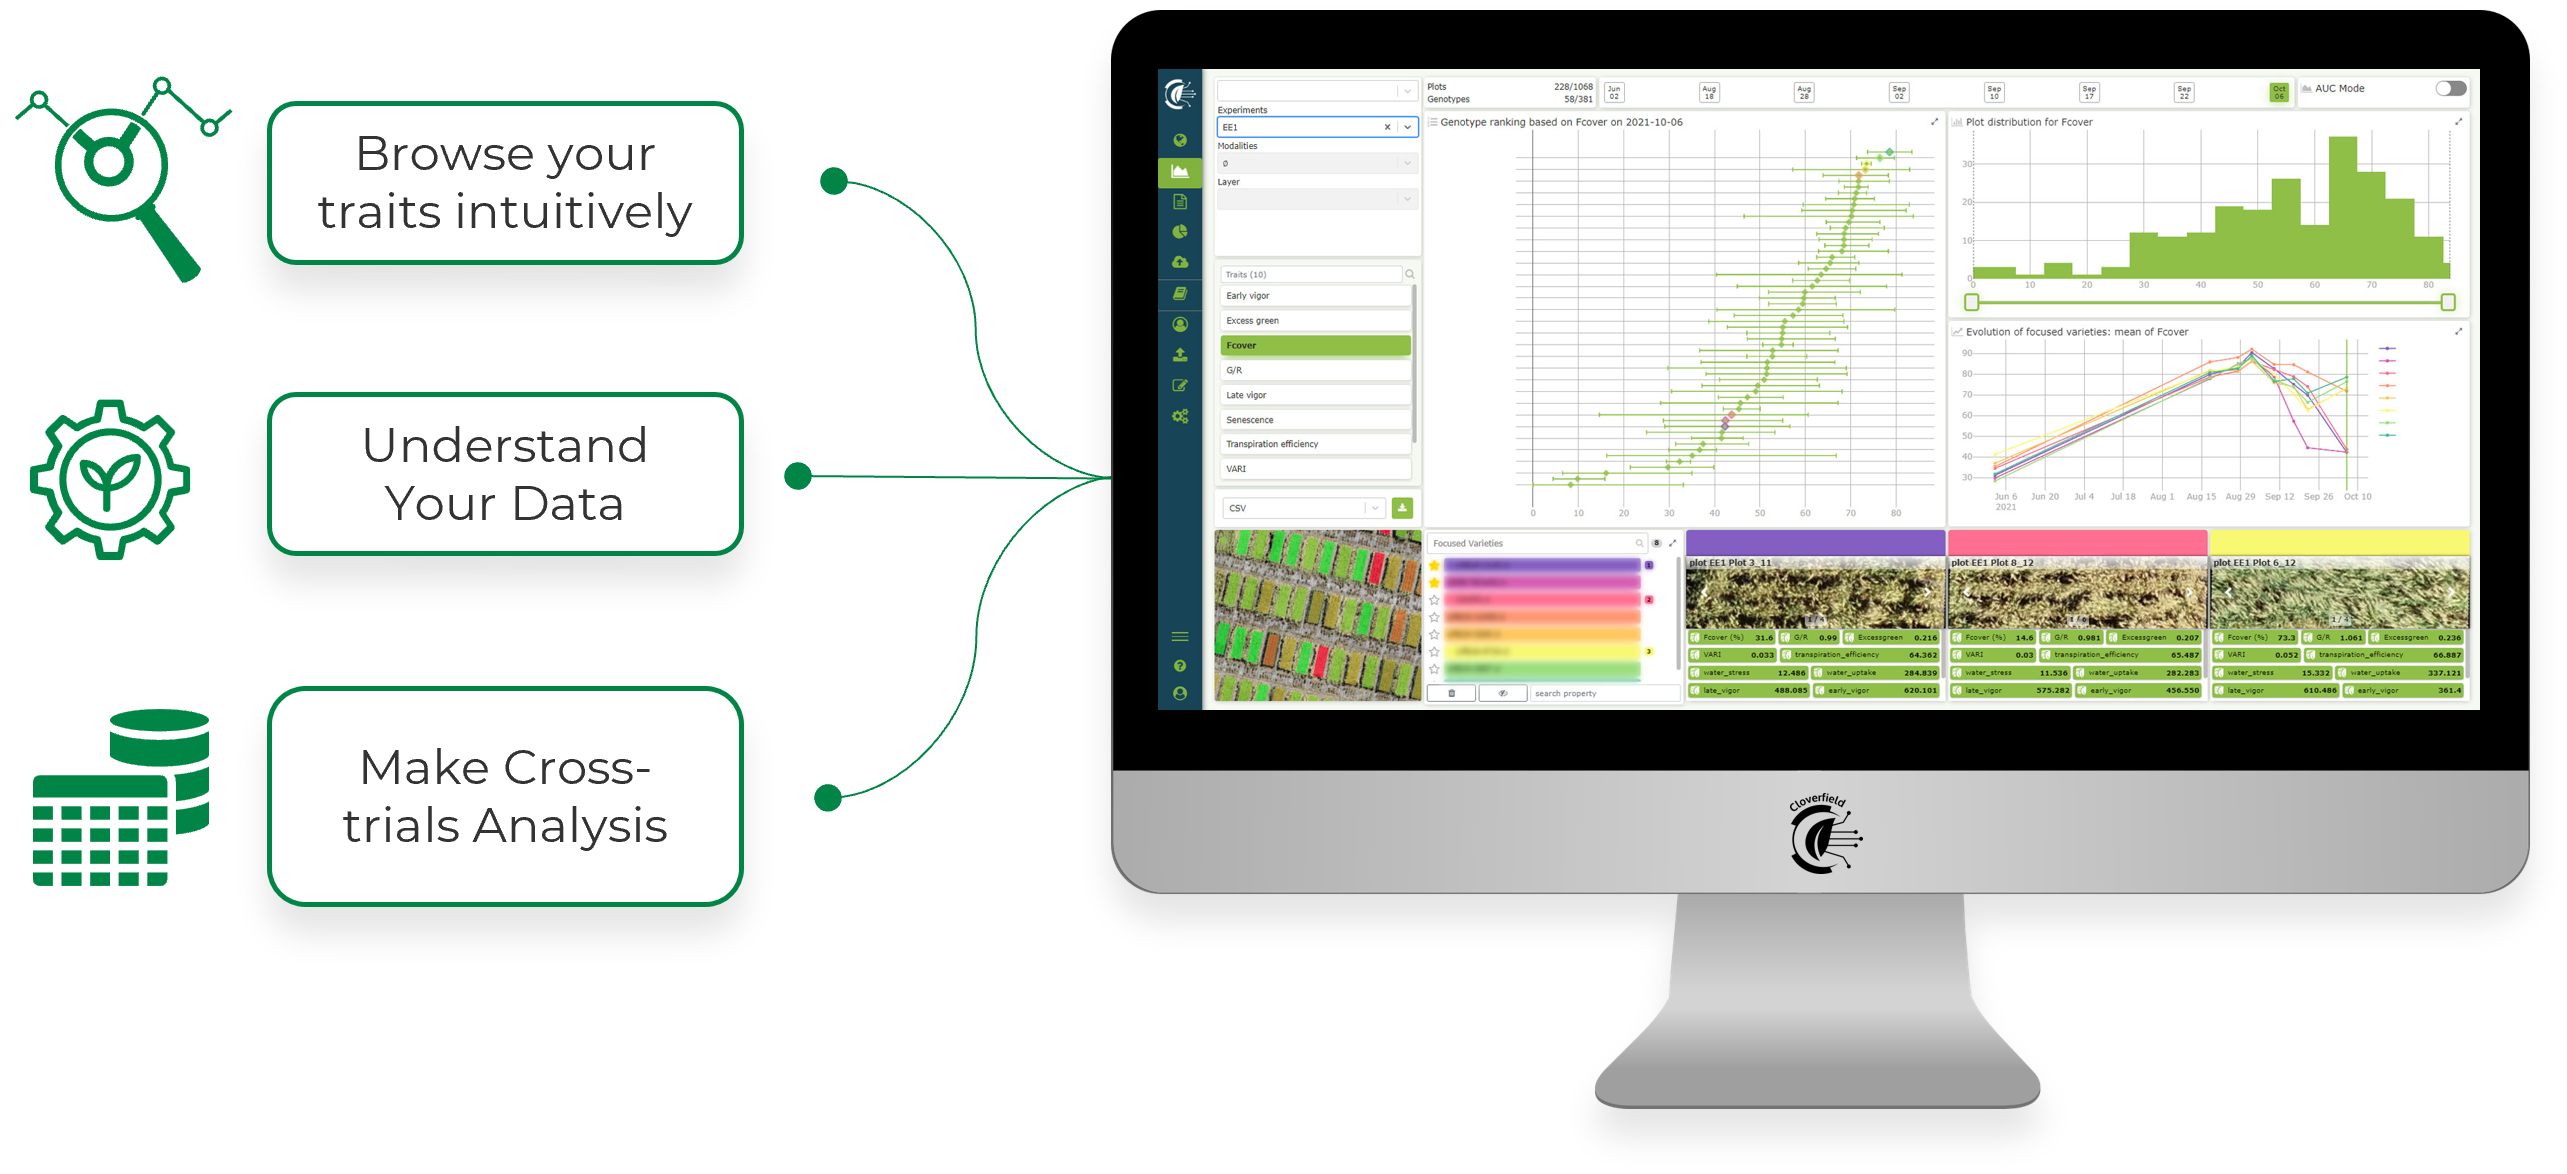
Cloverfield™ Data Platform is using APIs to collect and share information.
Data security is paramount in any industry, especially agriculture, were sensitive information impacts food production and supply chain management. In the Hiphen context, where APIs facilitate communication between client applications and the Cloverfield data platofmr, data exchange is conducted securely.
APIs offer robust authentication and encryption mechanisms, ensuring that data is transmitted safely, and only authorized users can access it. This secure environment fosters collaboration among different stakeholders, such as farmers, researchers, and agribusinesses, leading to knowledge-sharing and innovation within the agricultural community.
APIs have emerged as indispensable tools in the data-driven agriculture realm, transforming traditional agricultural practices into efficient, data-powered operations. Through seamless data integration and connectivity, APIs allow stakeholders to harness the full potential of agricultural data, paving the way for deeper research and improved seed breeding based on phenotypic data assessment.
The integration of the Cloverfield application through APIs brings automation, efficiency, and secure data exchange to the forefront of agriculture. However, it is essential to acknowledge that setting up API integration may require the expertise of an IT team. Nonetheless, the benefits of enhanced decision-making, increased efficiency, and collaboration make it a worthwhile investment.
As the agriculture industry continues to embrace data-driven technologies, APIs will play an even more significant role in shaping a greener, more sustainable future for global agriculture. By leveraging APIs effectively, researchers and agribusinesses can optimize resources and drive innovation in the pursuit of food security and a thriving agricultural sector.
Sincerely,
Your Hiphen Team.
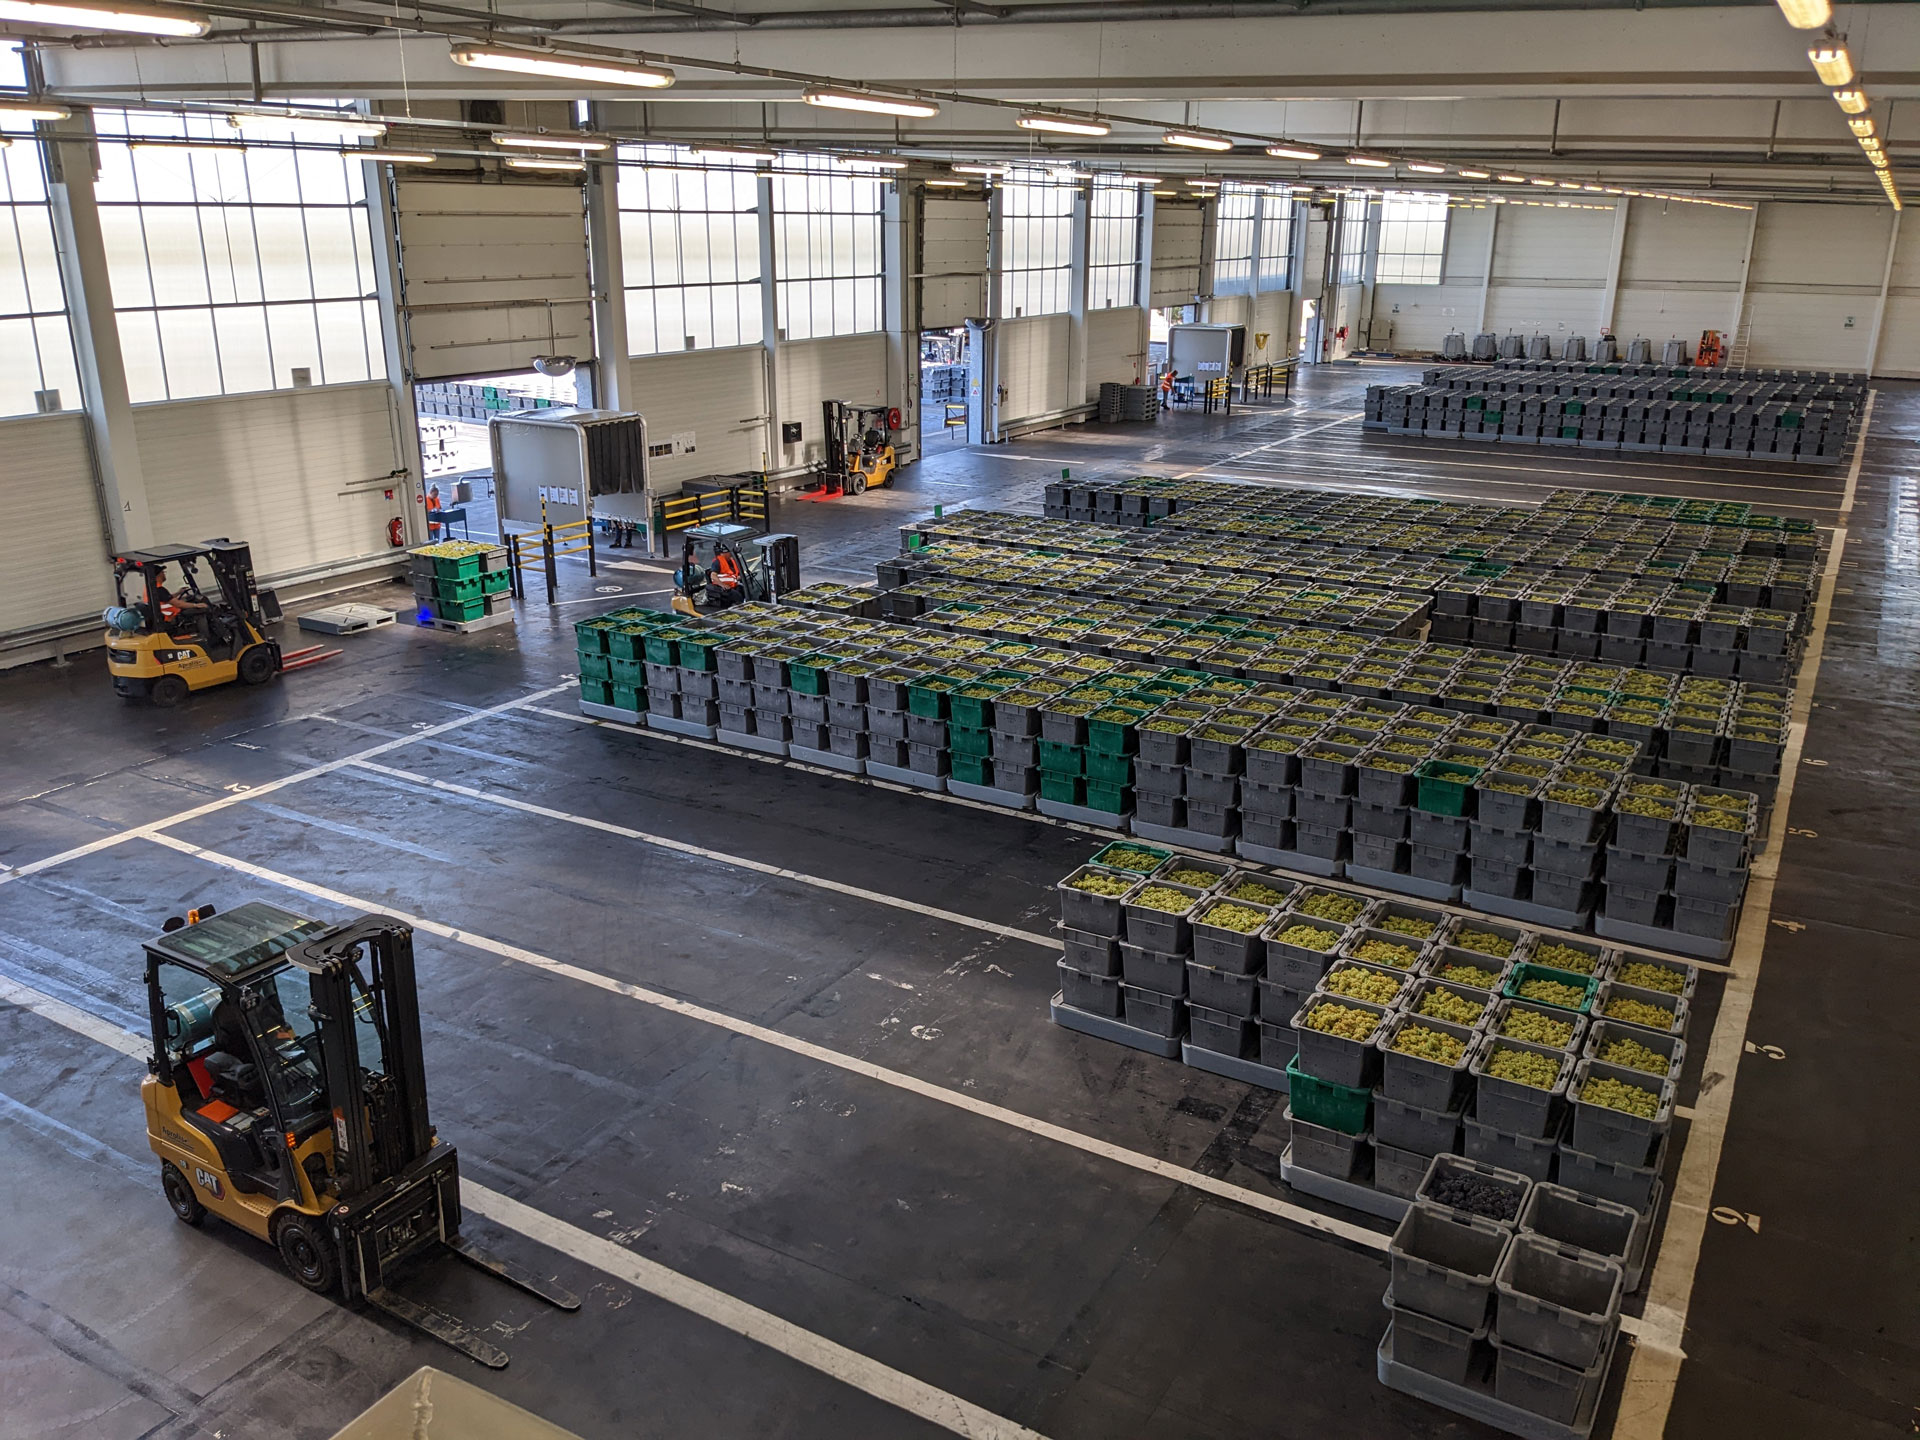
A grape pressing center where the real-time post-harvest quality assessment take place.
The Champagne region of France is known for its exquisite sparkling wine, and the grape harvest season is a crucial time for champagne producers. As the climate continues to change, grape growers and winemakers face new challenges every year. To adapt and thrive in this dynamic environment, legacy champagne house Moët & Chandon has partnered with Hiphen, a cutting-edge imaging solutions provider, to revolutionize grape quality assessment at harvest. In this blog post, we will explore the significance of the grape harvest season in Champagne, the pivotal role of environmental factors, and how Hiphen's PhenoStations are making a difference.
For champagne producers, the grape harvest season is the most critical and hectic period of the year. The quality of grapes harvested during this time directly influences the flavor, aroma, and overall quality of the champagne produced. Traditionally, grape harvesting in the Champagne region begins in late August or early September and can extend for several weeks. During this time, vineyard workers meticulously collect grapes, ensuring that the finest fruit is selected for vinification. However, with large vineyards, many providers and a short harvesting time frame, it's a tough job to precisely monitor the quality of every grape that comes into the pressing facilities by human eye.
Climate change is having a profound impact on grape growing and winemaking worldwide, and Champagne is no exception. The region is experiencing more unpredictable weather patterns, including hotter summers and unpredictable rainfall. These changes can lead to various challenges for grape growers, including the risk of diseases and fungi in the vineyards such as Botrytis Cinerea or Acid rot among others*.*
While monitoring and mitigating these environmental factors is helpful to make yield estimations early in the season, assessing the quality of the harvested fruits is crucial to ensuring a successful harvest and maintaining the high standards of champagne production. This is where Hiphen's innovative PhenoStation® technology comes into play.
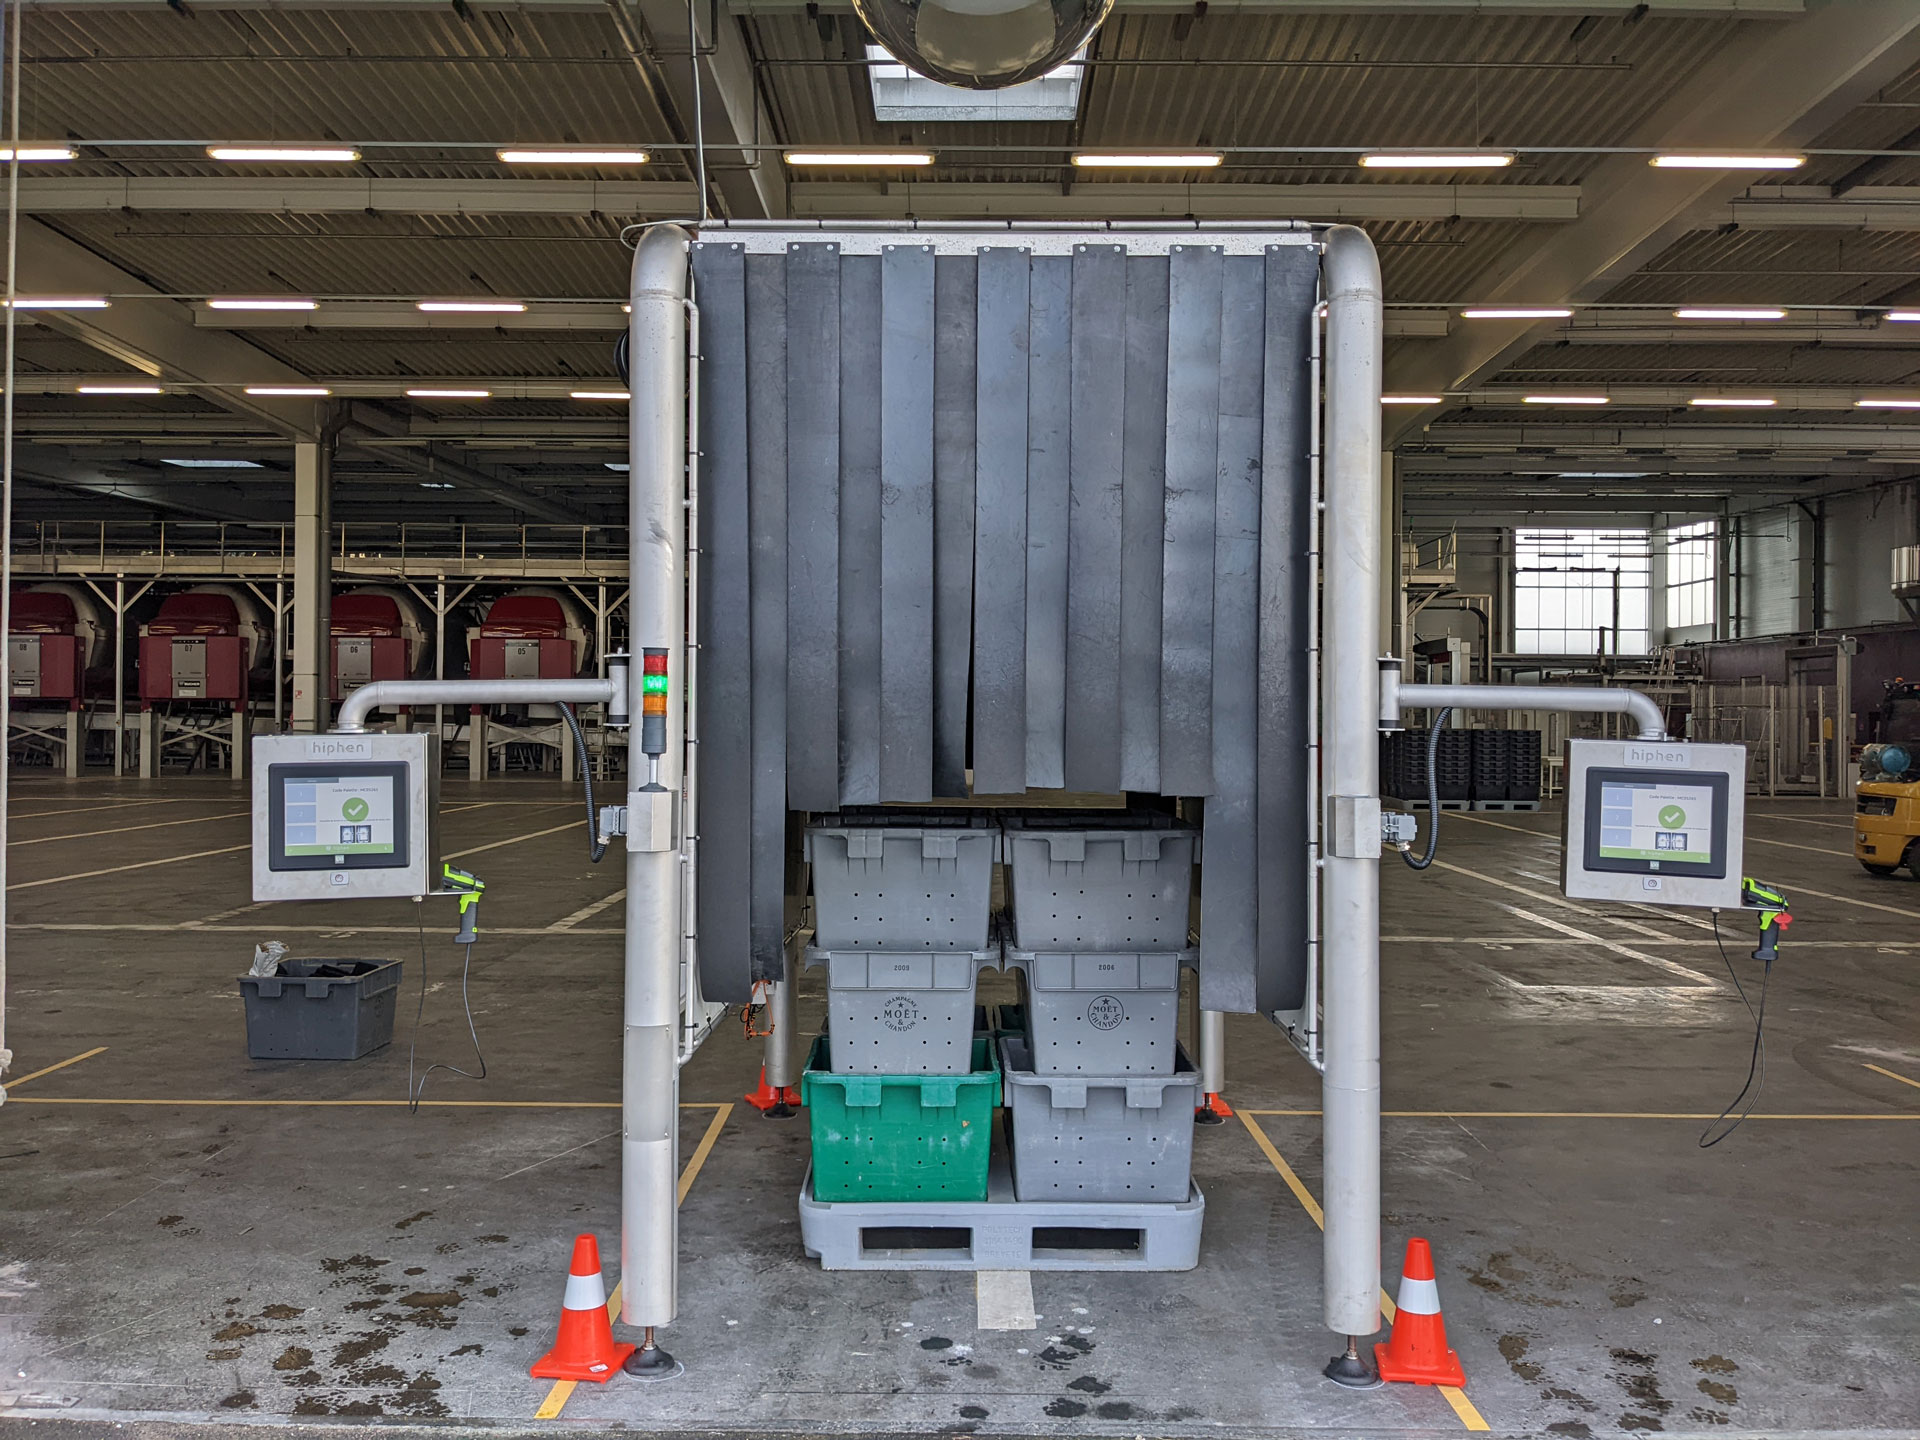
A closer look at Hiphen's PhenoStation® tailor-made for Moët & Chandon pressing centers.
Hiphen, an agricultural imaging solutions company at the forefront of innovation, is supporting Moët & Chandon during the grape harvest season by providing real-time grape quality assessments. Their cutting-edge approach involves collecting imaging data to create homogenous grape batches before the vinification process begins. The tailor-made solution integrates seamlessly into the operational workflows, so it doesn't take more time using a PhenoStation® than making more "traditional" grape batching based on eye scoring.
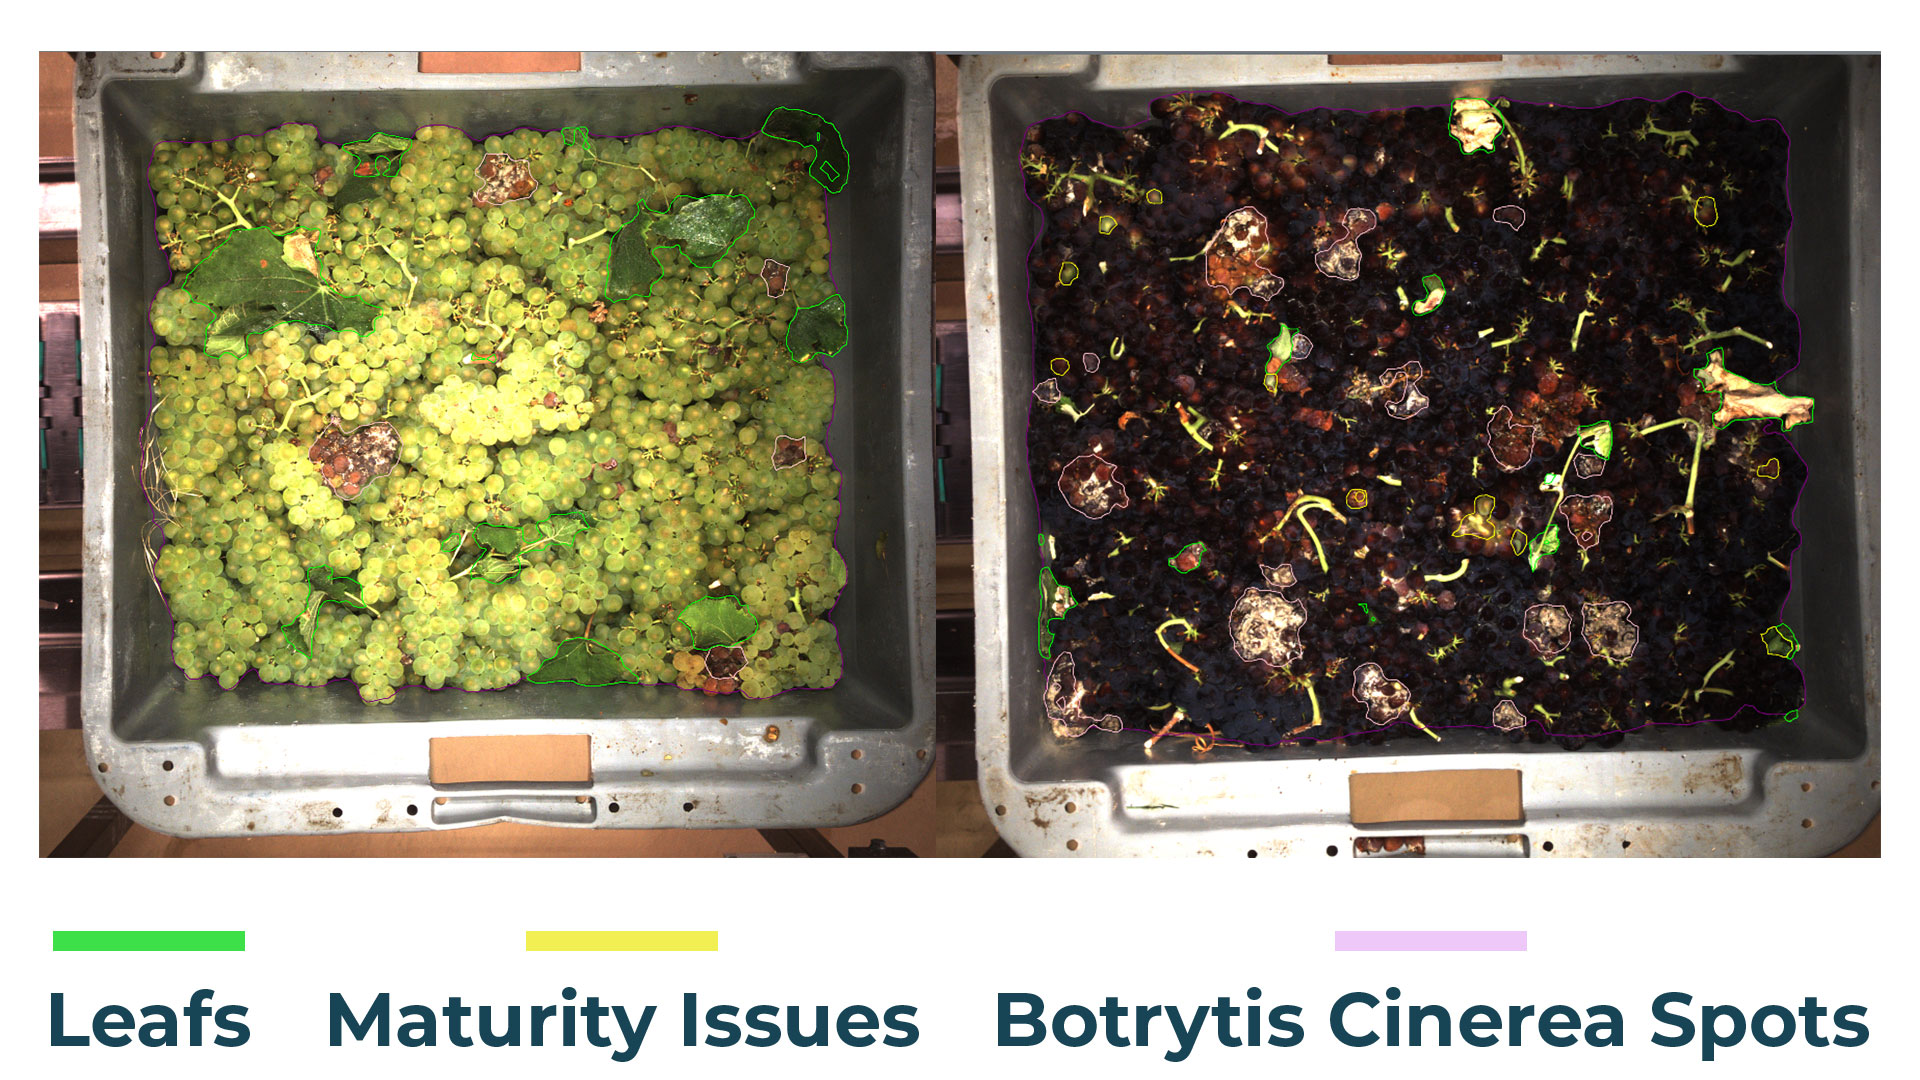
Hiphen's PhenoStation® work tirelessly, monitoring grape crates 24/7 during the entire harvest period. These stations help identify and track potential issues, such as diseases or fungi, but also maturity issues, allowing for proactive and non-destructive measures to be taken. By doing so, they ensure that only the healthiest grapes are used in champagne production, maintaining the exceptional quality that consumers expect from Moët & Chandon products.
Several articles have highlighted the collaboration between Moët & Chandon and Hiphen during this years and previous grape harvest season. Experts and medias have commended the partnership for its forward-thinking approach to post-harvest quality assessment through imaging solutions:
📺 French TV report
🎬 Sparkling Wine Forum 2023
If you're intrigued by the intersection of technology and winemaking, join us at VITeff (The biggest European Sparkling Wine Technology Exhibition) to discover more about Hiphen's PhenoStation® and its impact on post-harvest quality assessment. Our experts will be on hand to answer your questions and provide insights into how the system adapts into your operational workflow.
Find more information about VITeff at: https://www.viteff.com/
For a firsthand look at how Hiphen's technology is transforming the grape harvest season in Champagne, watch our video. It's available in both French and English, so you can dive deep into the details of this exciting collaboration.
🇺🇸 English 🇺🇸
🇫🇷 Français 🇫🇷
To conclude, the grape harvest season in Champagne is a time-honored tradition that is now adapting to meet the challenges posed by climate change and environmental factors from one vintage to another. Thanks to innovative technology like Hiphen's PhenoStation®, champagne producers like Moët & Chandon can adapt and thrive while maintaining the exceptional quality that has made Champagne a symbol of celebration worldwide. This collaboration between tradition and technology is paving the way for a prosperous future for the Champagne region and other wine and sparkling beverages production areas around the globe.
1/ Choose a day 📆 > 2/ Select a time slot at your convenience 🕒 > 3/ Confirm the meeting ✅ > 4/ You're all set 🎉
In today's fast-paced world, the agriculture sector faces numerous challenges, such as feeding a growing population, addressing climate change impacts, and optimizing resource utilization. Fortunately, the integration of Artificial Intelligence (AI) in agriculture has brought about a transformative shift in the industry. AI's potential to enhance efficiency, precision, and productivity has captured the attention of farmers, researchers, and agribusinesses worldwide. However, it is crucial to acknowledge that AI is a tool, and human expertise remains essential to drive its successful implementation. This article explores the revolutionary impact of AI in agriculture and the importance of a human-in-the-loop approach.
AI has emerged as a powerful tool in agtech applications, promising to revolutionize various agricultural practices. By automating tedious tasks, processing large datasets, and recognizing patterns, AI helps make data-driven decisions more efficiently and accurately. From sowing and irrigation to pest management, crop monitoring and harvesting, AI-driven technologies offer a plethora of benefits for farmers and researchers nowadays.
Amid the rapid advancements in AI technology, it is crucial to remember that humans play a central role in driving these tools. Rather than replacing human expertise, AI complements it, providing researchers with valuable insights and recommendations. Agriculture involves diverse cultures, genetics, and environments, leading to what experts' term "vintage effects." These unique nuances require human knowledge and expertise to assess effectively.
To harness the true potential of AI in agriculture, it is essential to have mechanisms in place to monitor AI's performance and control model drift, also known as "data drifting" or "concept drifting". This helps ensure an efficient use of AI technology globally, by estimating the robustness and precisions of the model that process images to calculate plant traits. Two significant examples of AI-powered data models in agriculture are:
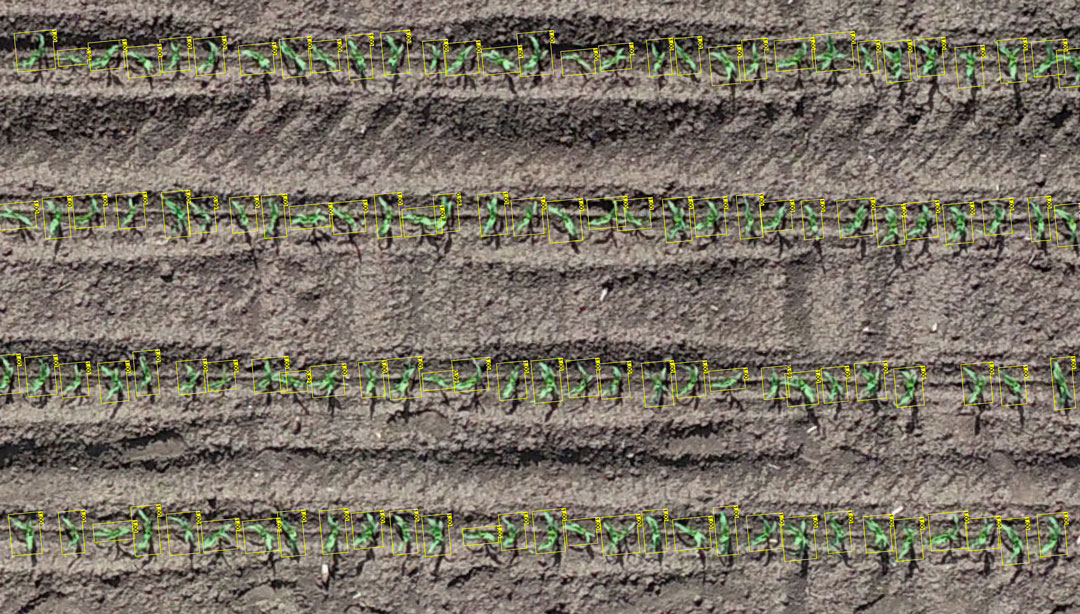
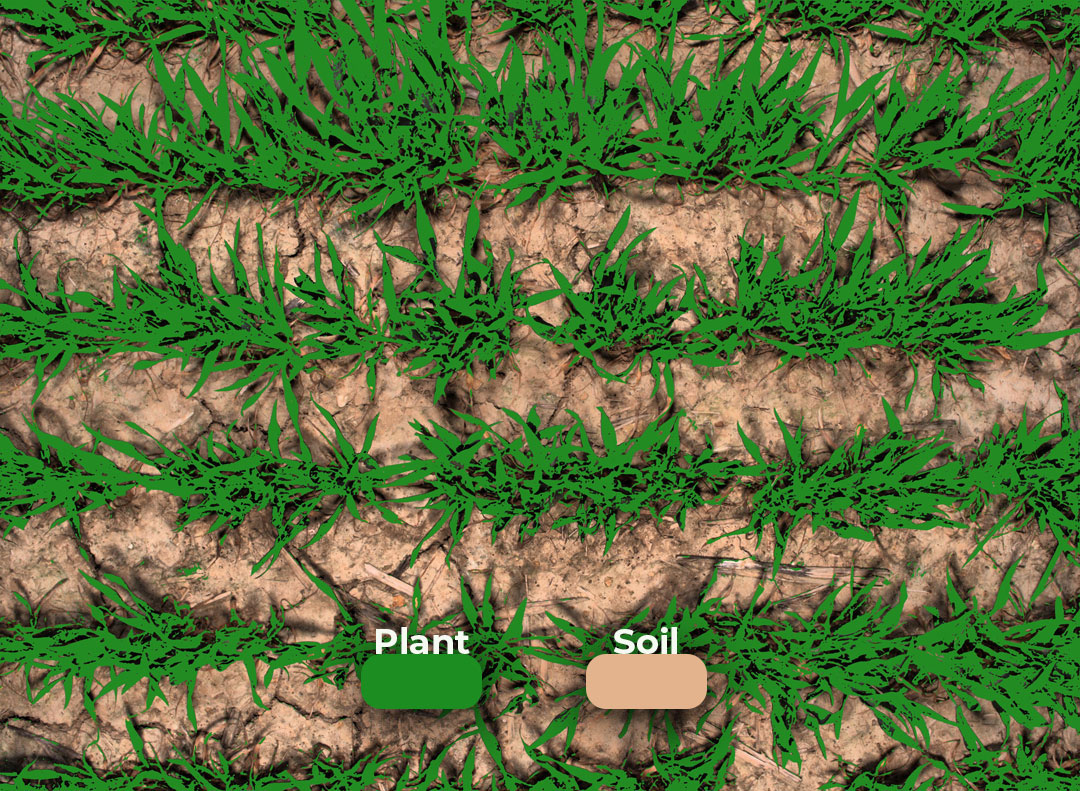
To ensure AI's reliability and robustness, engineers within AgTech companies must develop digital tools that document the evaluation of AI models for each "vintage" scenario. By continuously monitoring and improving these tools, organizations can offer clients cutting-edge solutions that cater to their specific needs and challenges. Below is an illustration of Hiphen's homegrown model drifting dashboard developed specifically for the use of AI in agricultural research applications.
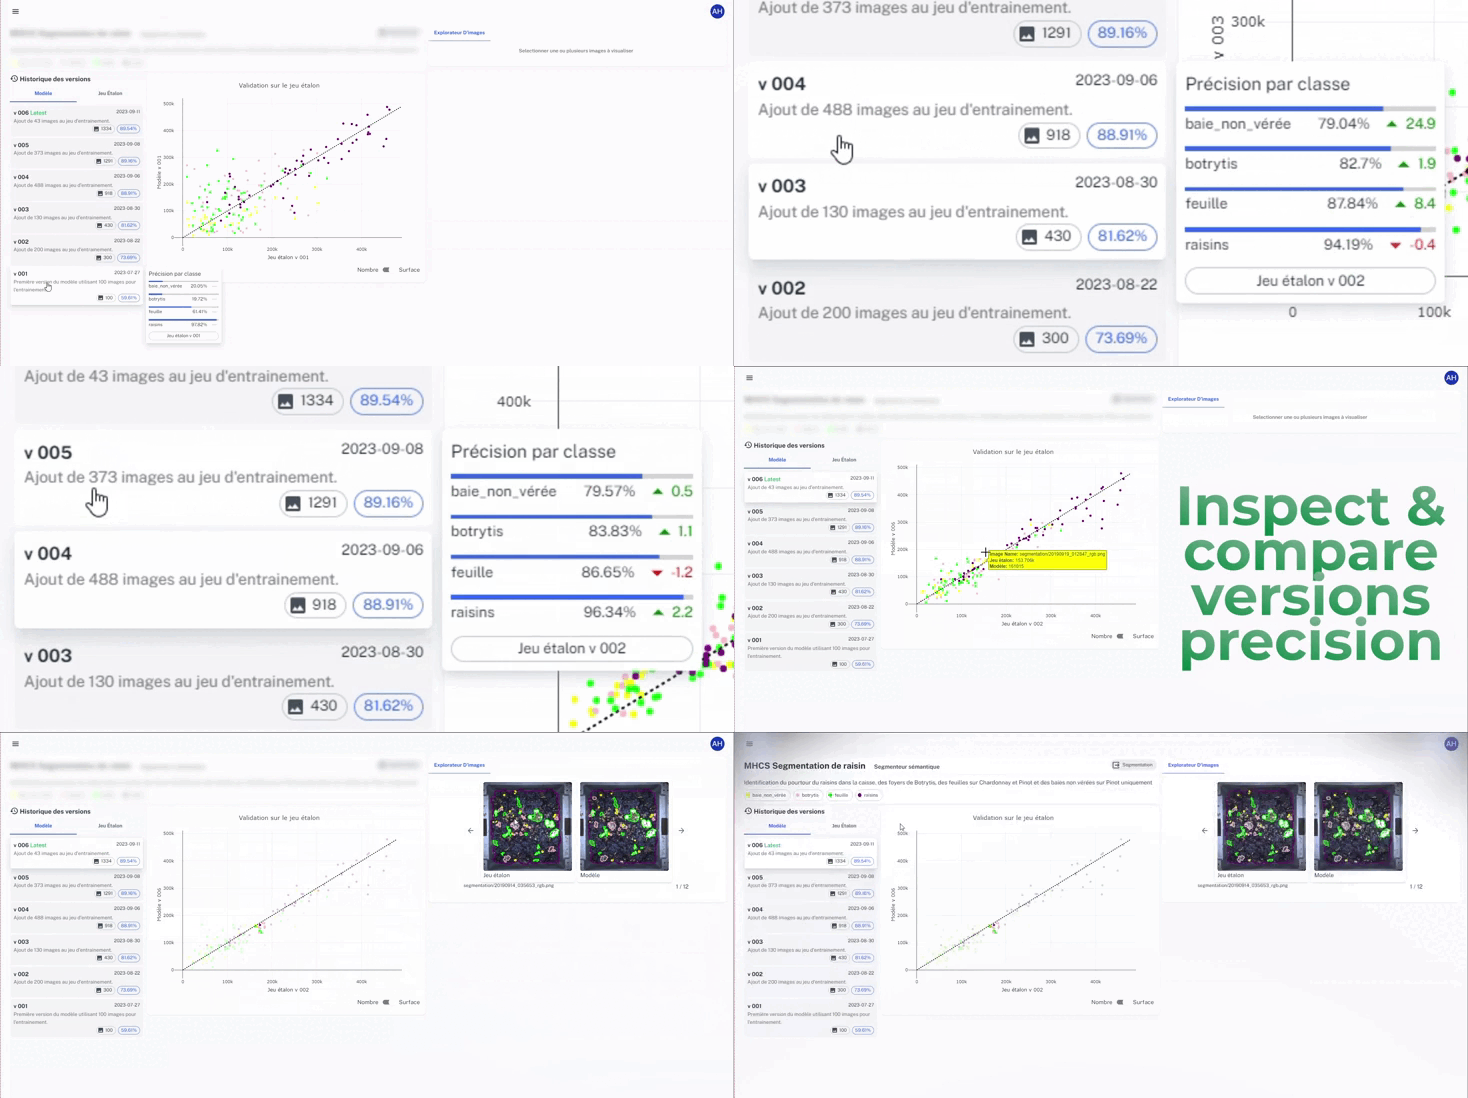
Hiphen has developed a monitoring interface that helps controlling and validating the precision of Deep Learning models through time with a human-in-the-loop approach.
As AI becomes increasingly integral to agriculture, ongoing monitoring and maintenance are critical. Detecting concept drift, adapting to evolving patterns, mitigating bias, ensuring data integrity, and enhancing model governance are essential elements of sustaining optimal AI performance. Investing in these aspects not only builds trust but also ensures ethical and responsible AI implementation.
AI has undoubtedly brought revolutionary changes to the agricultural landscape, promising increased efficiency, precision, and productivity. However, we must remember that AI is a tool that complements human expertise, rather than replacing it. By adopting a human-in-the-loop approach and investing in monitoring and maintenance, we can unleash the full potential of AI in agriculture while ensuring responsible and ethical practices. With the fusion of AI and human ingenuity, the future of agriculture looks promising, capable of addressing global challenges and ensuring sustainable food production for generations to come.
Sincerely,
Your Hiphen Team.
Topic brought to you by Adam SERGHINI – R&D Engineer, and Enzo GUENY – Frontend Developer @Hiphen.
In modern agriculture, the utilization of advanced technologies has transformed the way researchers and producers monitor and manage their crops. Drones and satellites have emerged as two powerful devices, offering numerous advantages to agri-businesses, ranging from territory surveillance to mapping and crop health assessment.
Aerial imagery collected through these systems provides valuable insights by capturing data from the sky, enabling reserachers and farmers to make informed decisions and optimize their agricultural production. In the last decades, drone and satellite imagery has brought about significant improvements in large-scale crop monitoring across the agricultural sector.
In this post, we will explore and contrast the use of drone and satellite image analytics for monitoring agricultural production, highlighting their respective strengths and differences, and showing how they can combine together.
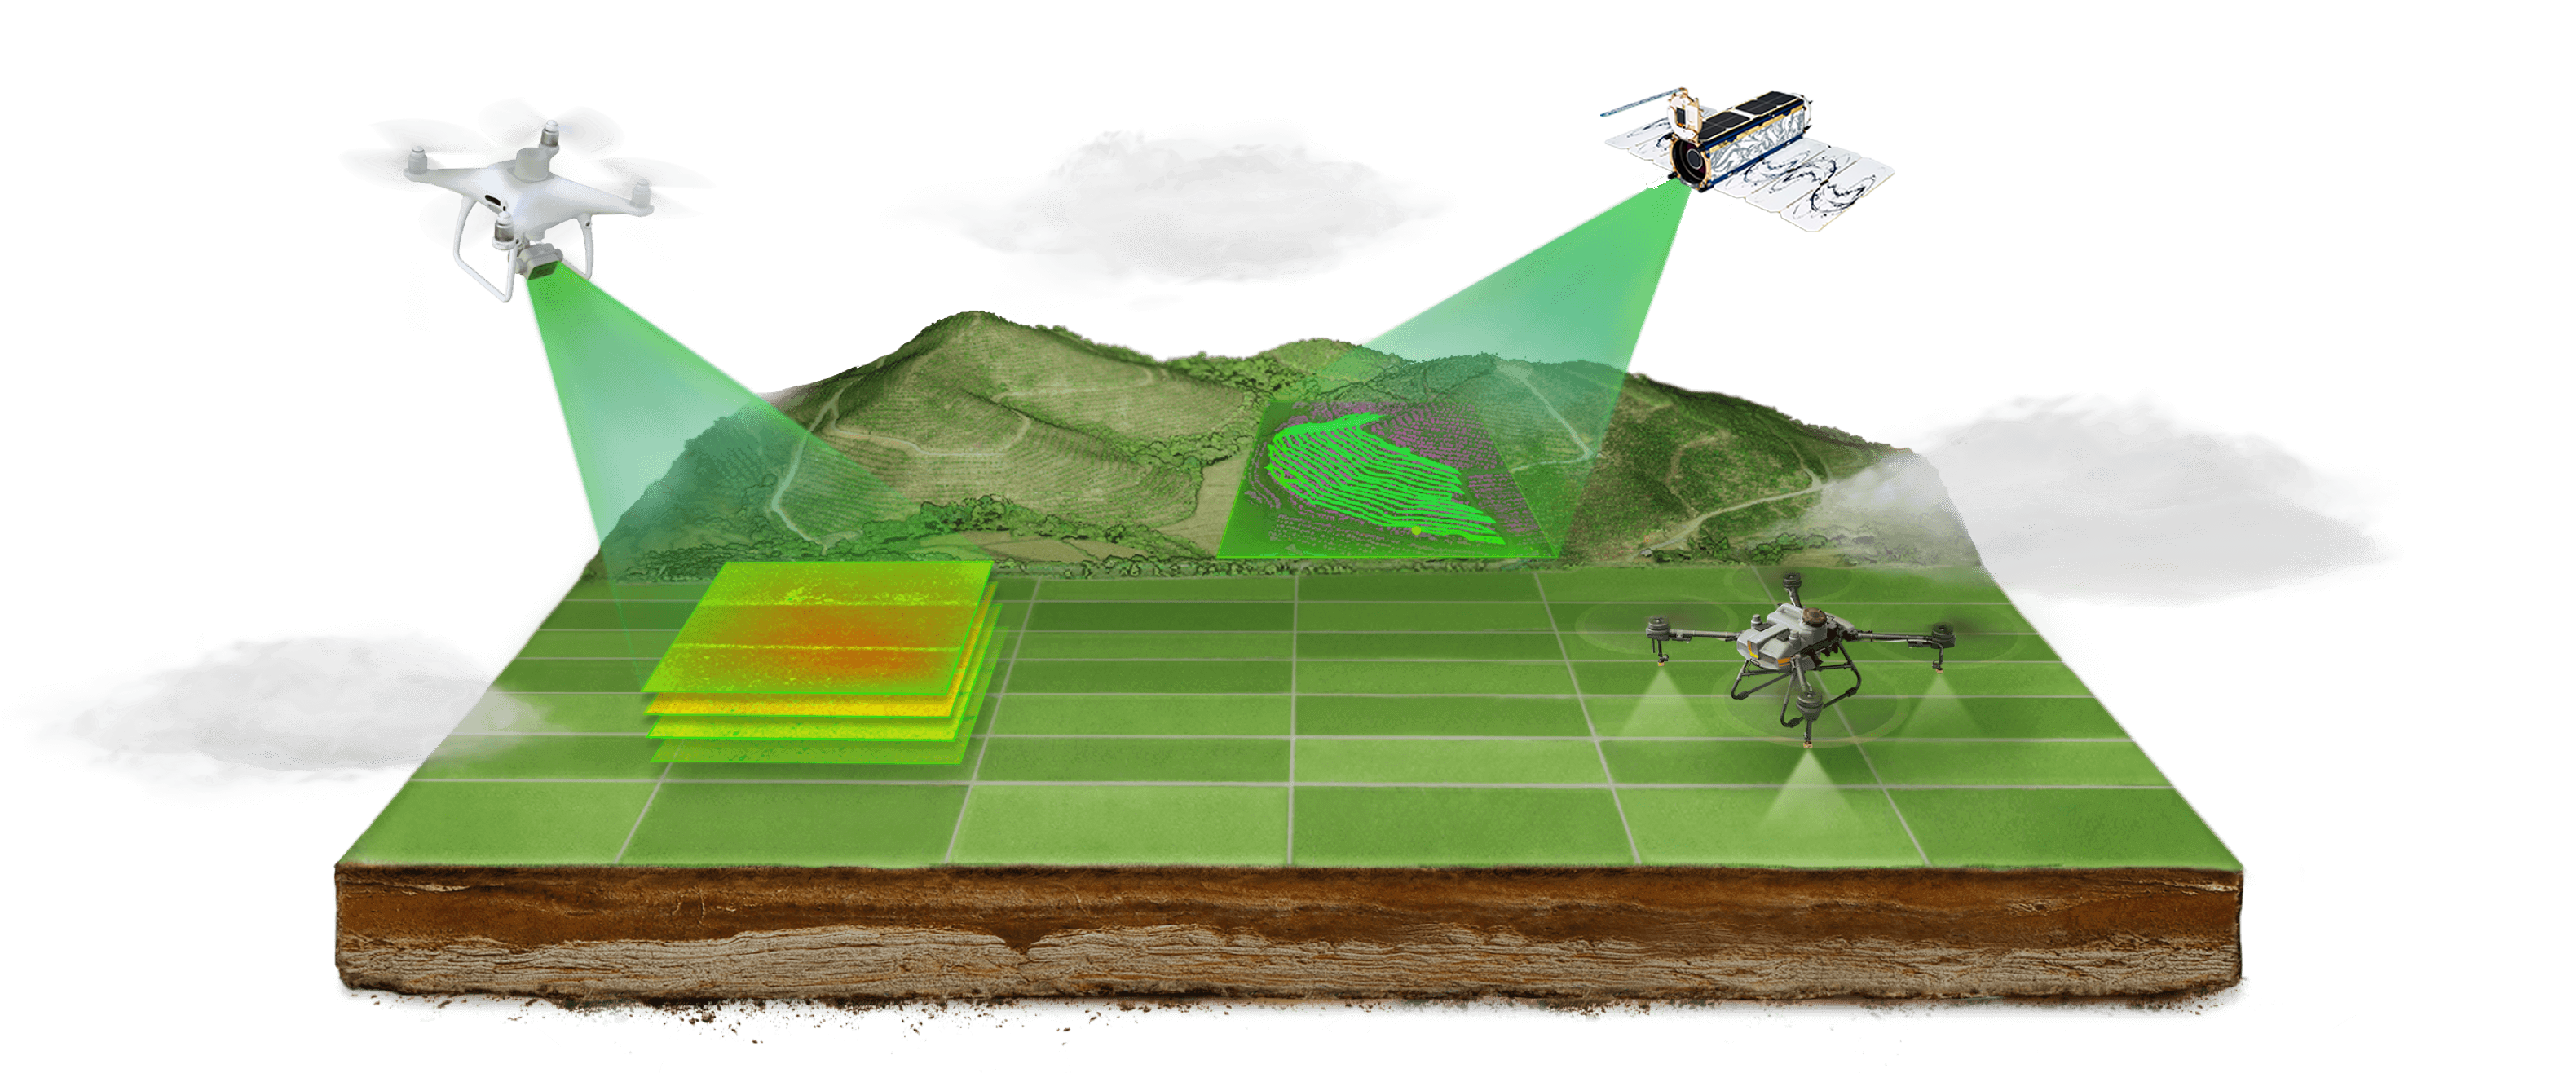
Drone and Sentinel 2 Satellite flying above agricultural land.
Drones, on the first hand, also known as Unmanned Aerial Vehicles (UAVs), are small remote-controlled aircraft equipped with high-resolution cameras and other sensors like multispectral cameras or 3D sensor (LiDAR). They can fly at various altitudes and capture detailed imagery of agricultural fields and research trials. Drones offer flexibility and precision, as they can be deployed on-demand and they can fly over specific areas of interest in a fairly short period of time thanks to their portability and lightness.
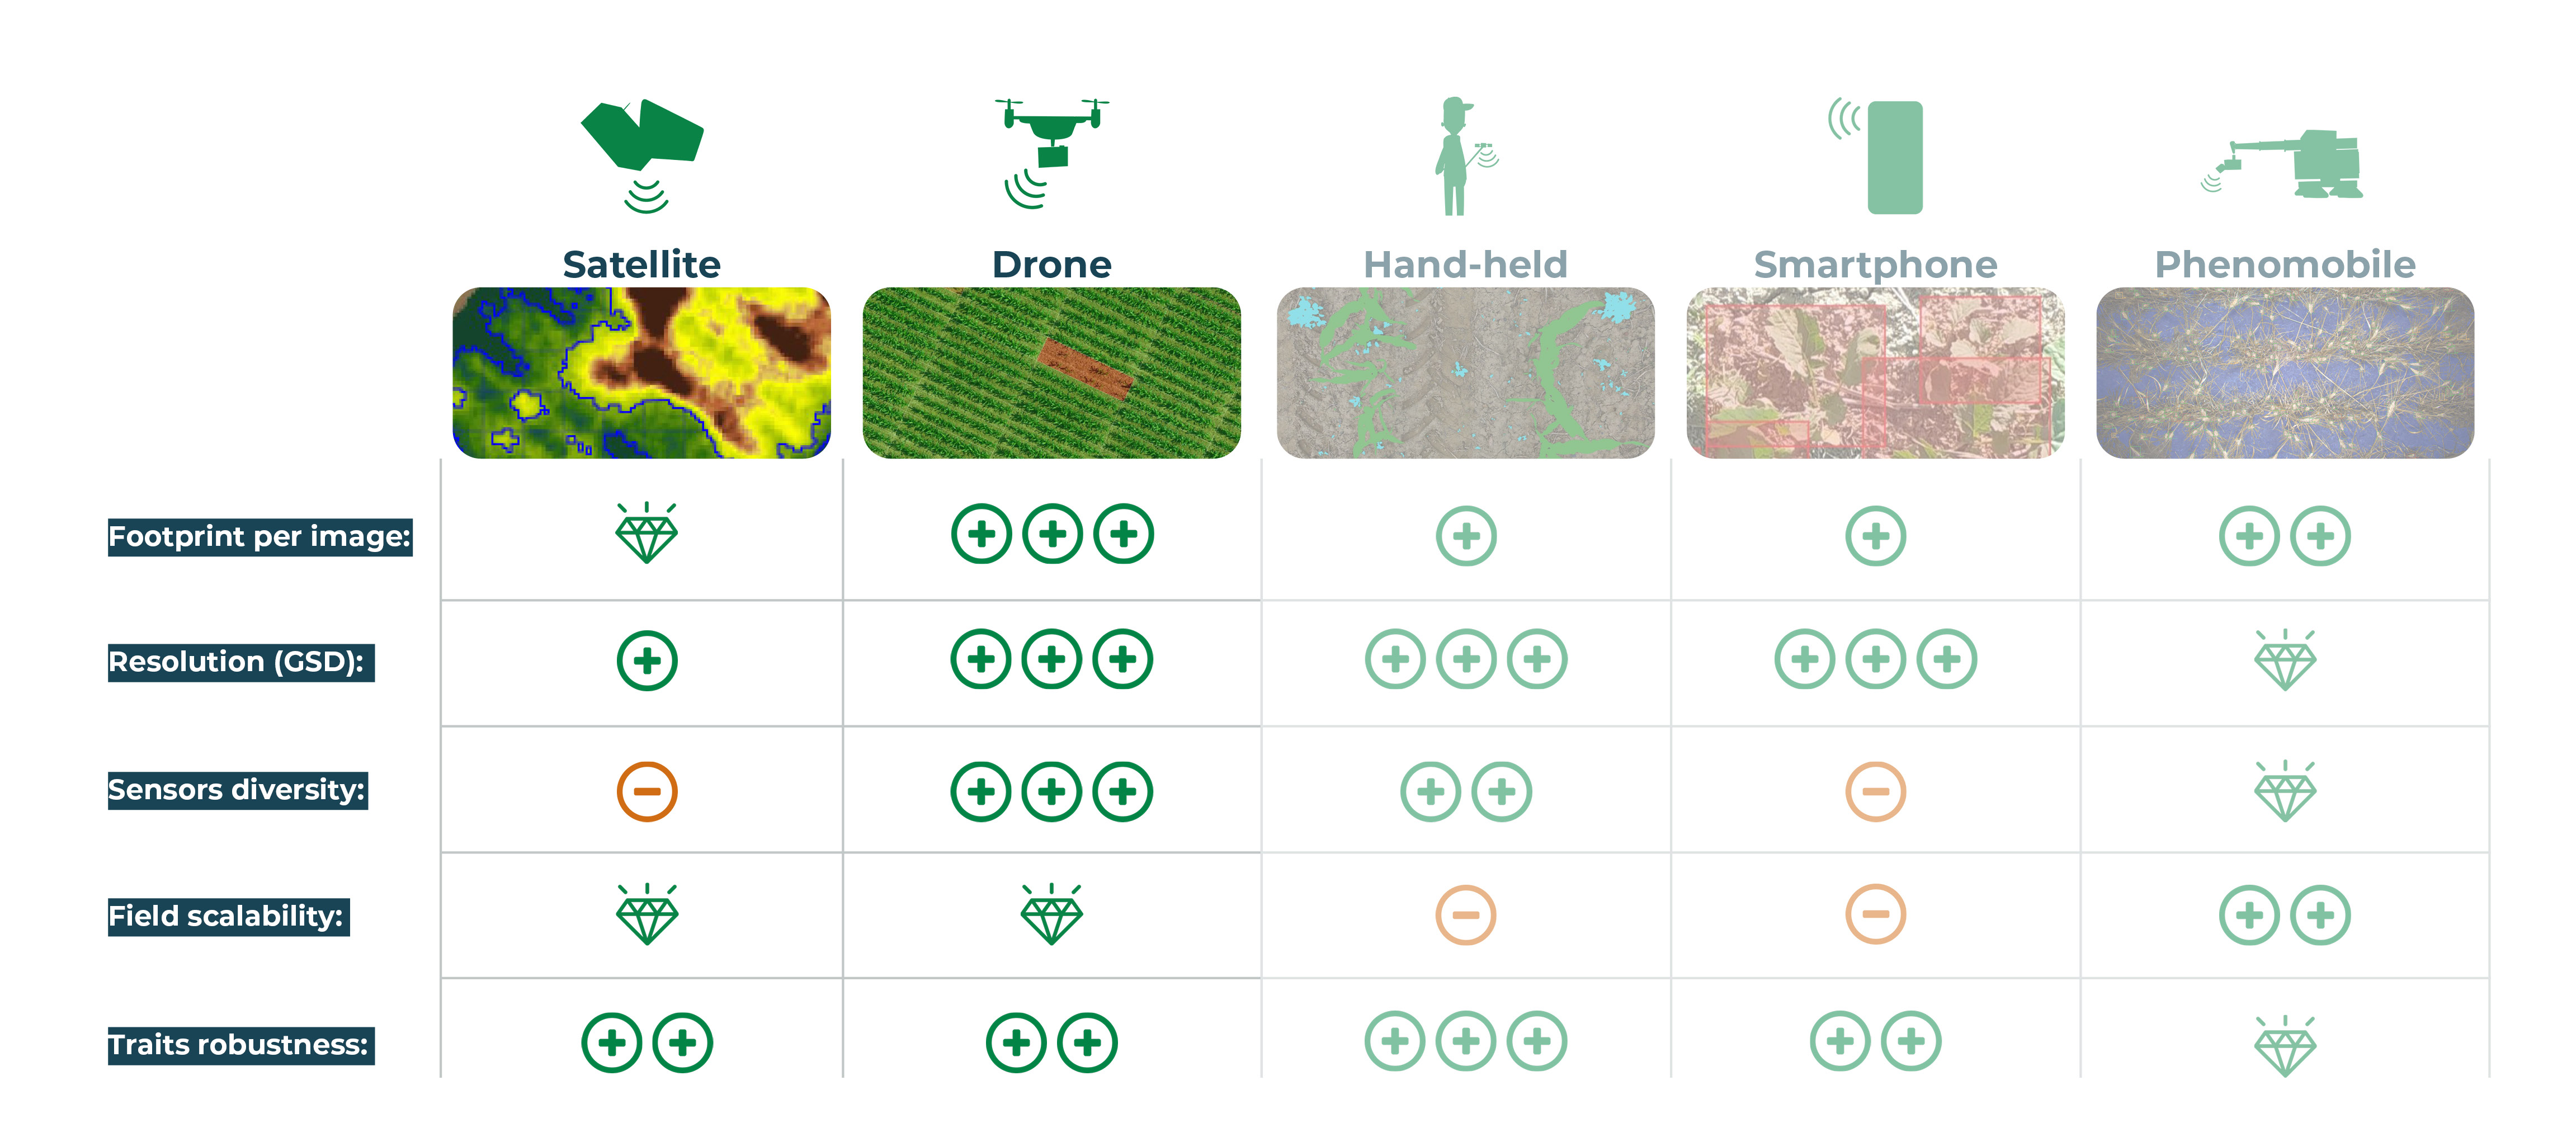
Table comparing the imaging specs of each system for phenotyping applications.
Satellites, on the other hand, are orbiting spacecraft that continuously capture images of the Earth's surface. Satellites are equipped with powerful sensors too, even if they usually are compatible with fewer sensor types (no 3D sensors yet for instance). The high-resolution equipment enable satellites to provide wide-scale coverage and monitor large agricultural regions from high altitudes. Satellites offer the advantage of regular and systematic data acquisition, allowing for consistent monitoring of crops over time.
Drone and satellite imagery has brought about significant improvements in large-scale crop monitoring across the agricultural sector; however, they differ in several key aspects:
These devices are different in their specifications but also in the assessment that they can give access to. Indeed, the sensors from a Satellite cannot capture the same thing as a Drone camera would since the proximity with the canopy and the sensor resolution are not the same, and in digital phenotyping, those parameters prevail while looking for research-grade plant assessments with deep granularity (like organ counting and classification or disease assessments for instance). But there are some traits that both devices can capture, like NDVI for example which is a vegetation index useful to estimate Vigor and Biomass, and in that case, creating data fusion with both devices and sensors helps accessing precise assessments that will give insights at different scales such as the field scale, the plot scale and even the plant scale when using high-resolution sensors.
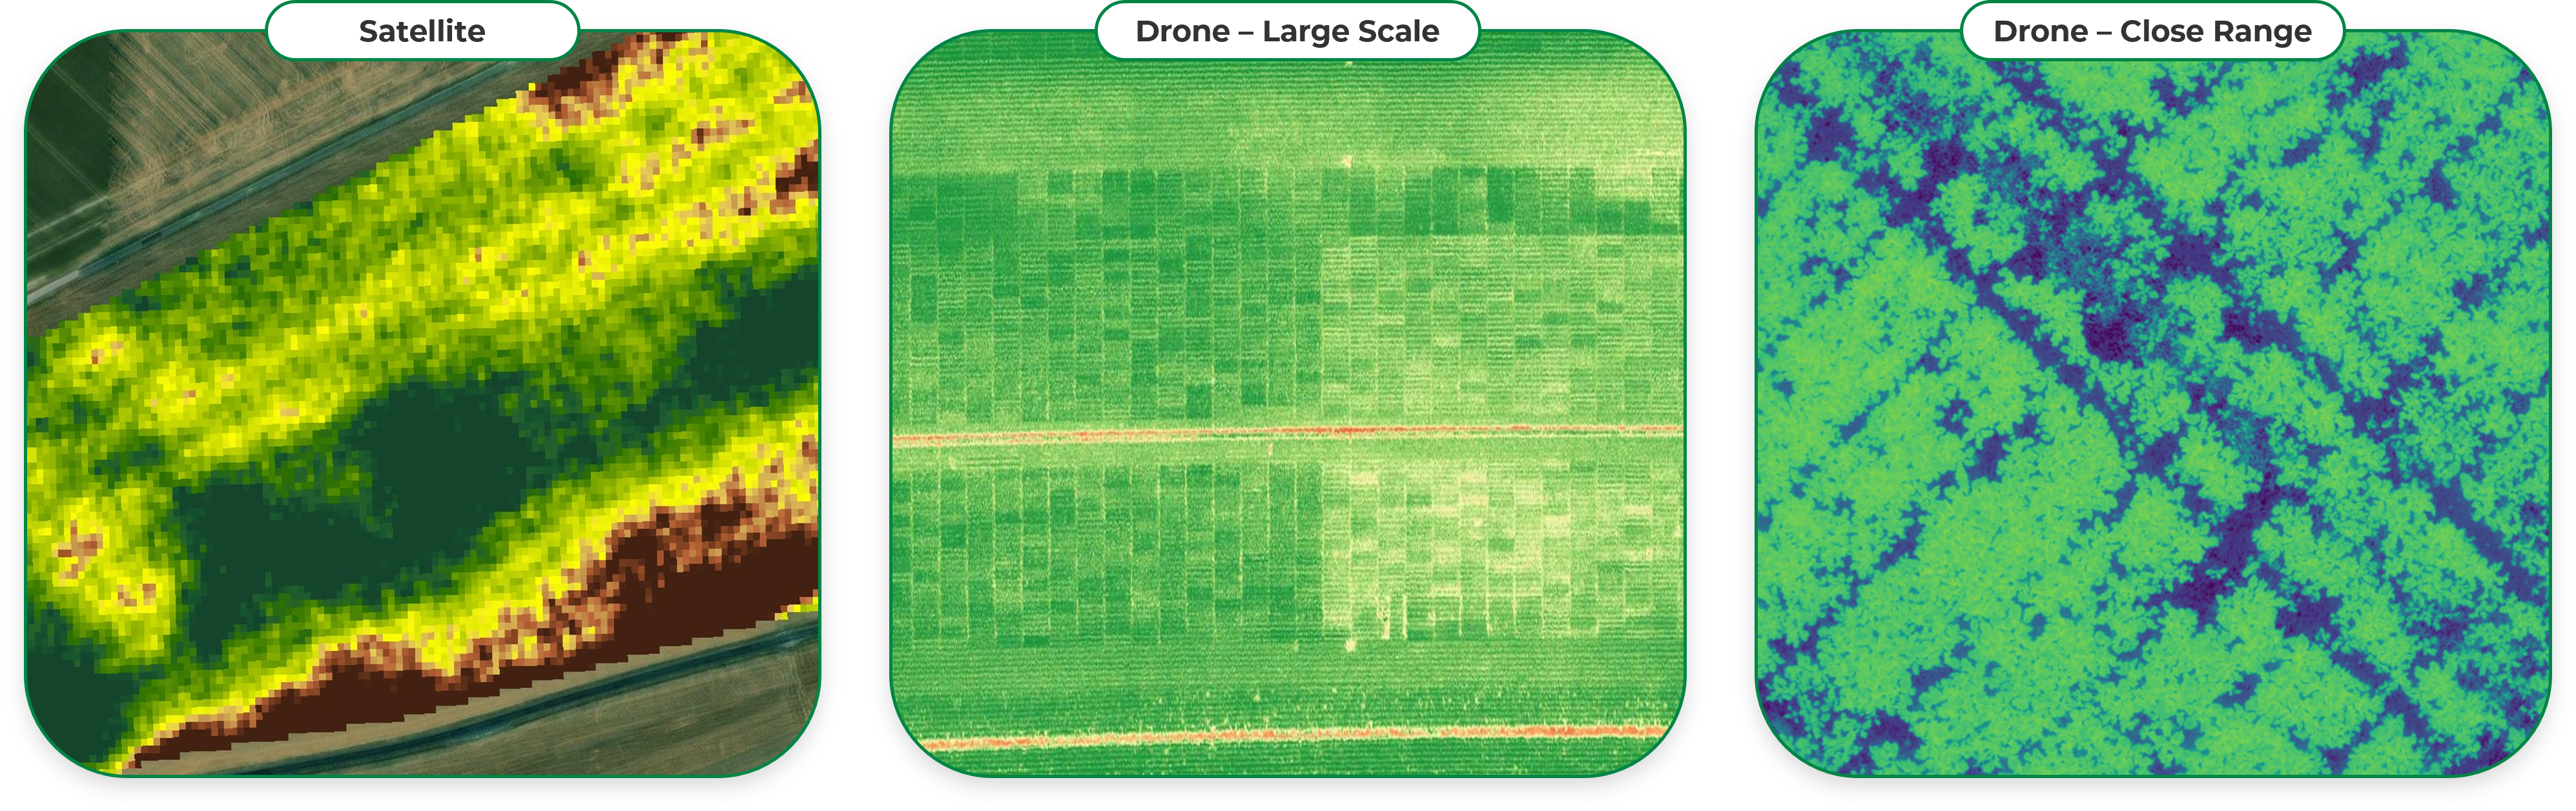
NDVI assessment from Satellite and Drone at different scales, giving access to various granularity of information.
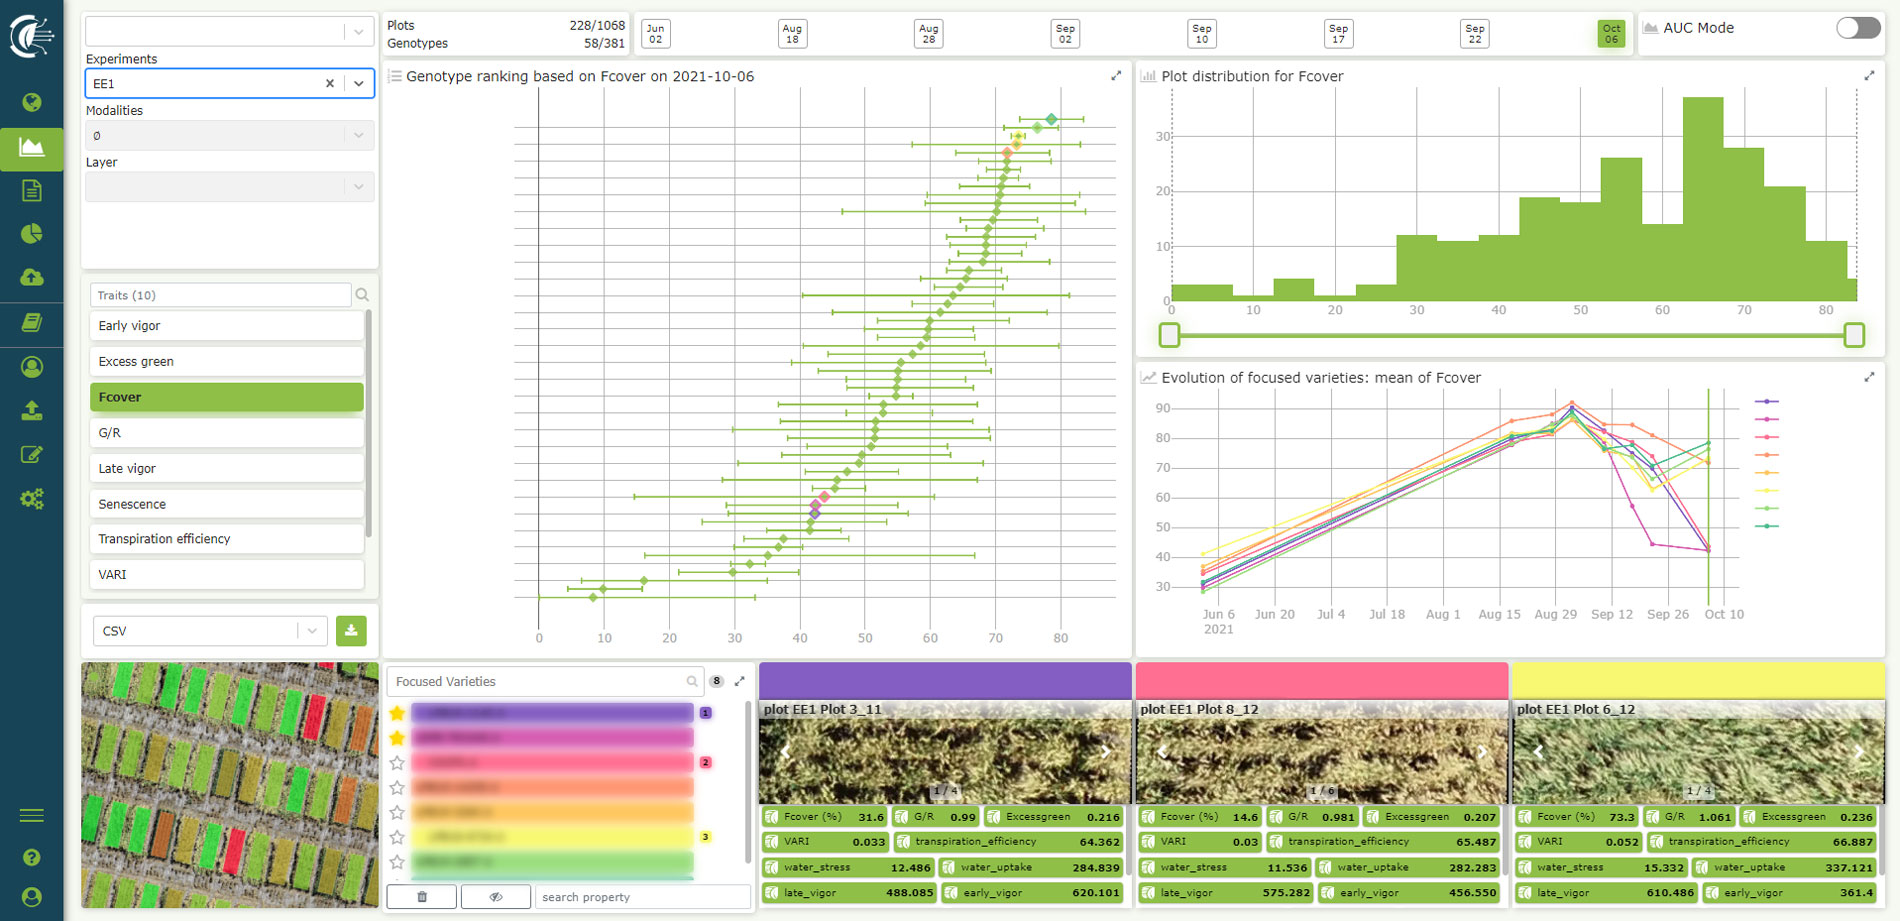
You can browse your plant traits values easily and intuitively in Hiphen's Cloverfield™.
In conclusion, drones and satellites have become indispensable tools for monitoring agricultural production. While drones excel in providing high-resolution, near real-time data for small to large plot trials assessments, satellites offer broader coverage and long-term monitoring capabilities for large-scale agricultural regions. Both options have unique value for plant phenotyping and as usual, the way you should pick either one or the other or both, should be driven by the assessments and outputs you wish to get, and by your field trial and project specifications as mentioned in the text above. By leveraging the strengths of both drone and satellite image analytics, agricultural researchers can make improved data-driven decisions, based on valuable phenotypic data and analytics, to optimize crop management practices and improve seed breeding and agricultural production globally.
Grab a time from one of our experts' Calendar to discover more.
Sincerely,
Your Hiphen Team.
Topic delivered by Patrizia ZAMBERLETTI – Imaging Solutions Specialist @Hiphen.
Digital plant phenotyping is revolutionizing the field of agriculture, particularly in greenhouses and vertical farms. These advanced technologies offer numerous advantages for plant researchers, breeders, and producers, enabling them to accelerate research and monitor plant performance and quality by making informed decisions based on plant traits assessment from imagery.
When it comes to plant phenotyping in controlled conditions, like greenhouses or vertical farms, there’s 3 main pillars to it:
So, let's explore these 3 pillars in detail through a client use case highlighting the value of PhenoStation® in such conditions: Phenotyping for drought tolerance research on oak trees in collaboration with INRAE (France).
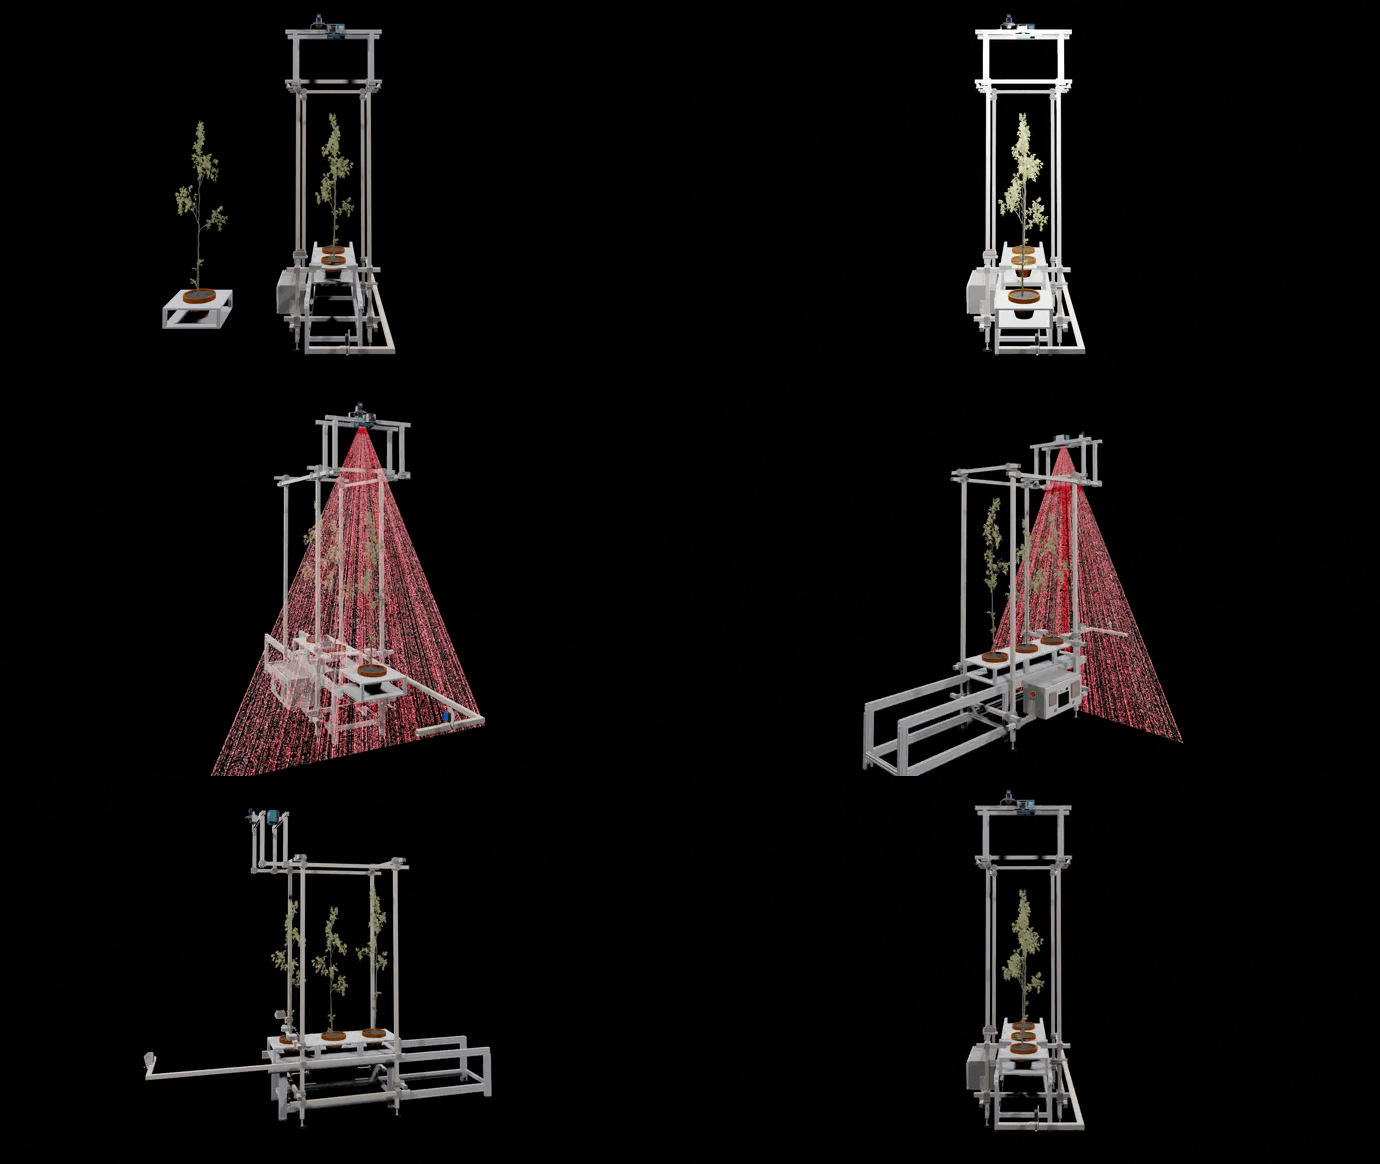
Video clip of the system developed for INRAE to assess oak trees in greenhouses.
Digital phenotyping enables an accurate and automated collection of large datasets. This high-throughput approach accelerates the breeding and selection processes, as breeders and producers can analyze and assess and compare many plants or varieties in a shorter time. The precise and objective measurements provided by digital phenotyping technologies eliminate subjective biases, ensuring reliable data for analysis. Plant height, leaf area, biomass, flowering time, and disease symptoms are just a few examples of traits from our portfolio that can be accurately assessed.
Within INRAE’s project, the goal is to assess tree stress in controlled conditions to select varieties that will resist high temperature variations as these varieties should help maintain European forests density with maximum efficiency.
Thus, the traits of interest were the height, the biovolume, the leaf surface, the leaf temperature to measure stomatal conductance and evapotranspiration rates, and more… Measured on a regular basis (trees are phenotyped every day), these traits are giving us access to the dynamics of the tree development so then we can really understand the evolution of each variety and their resilience to climate change, which is simulated within the greenhouse. The system designed to assess the trees is tailor-made to the greenhouse specs (which was build before the start the digital phenotyping project) and integrate all the components to automate image acquisition and data processing.
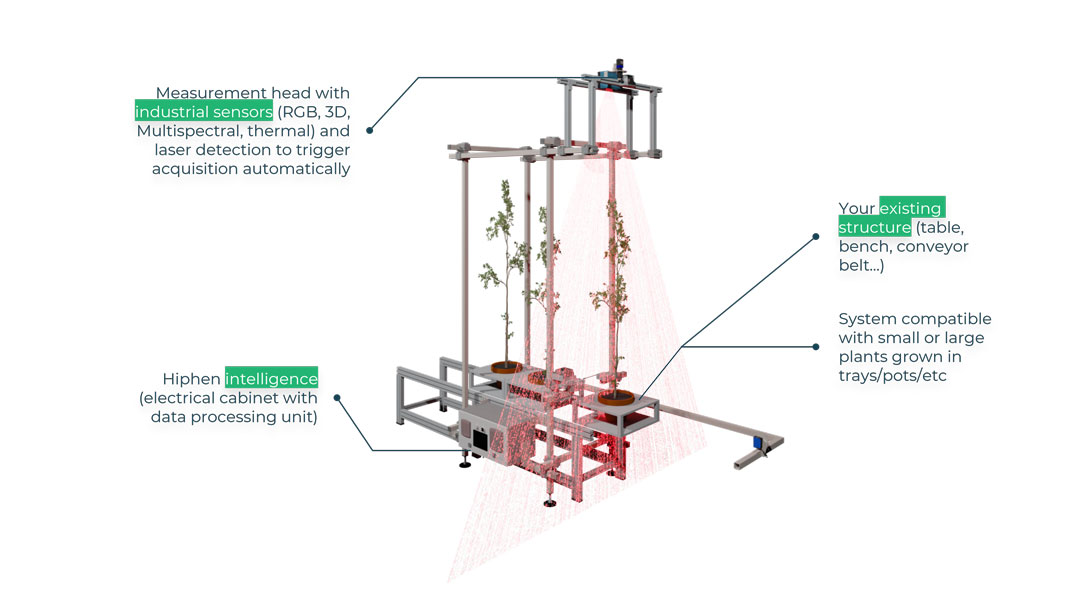
INARE's Project Bespoke System.
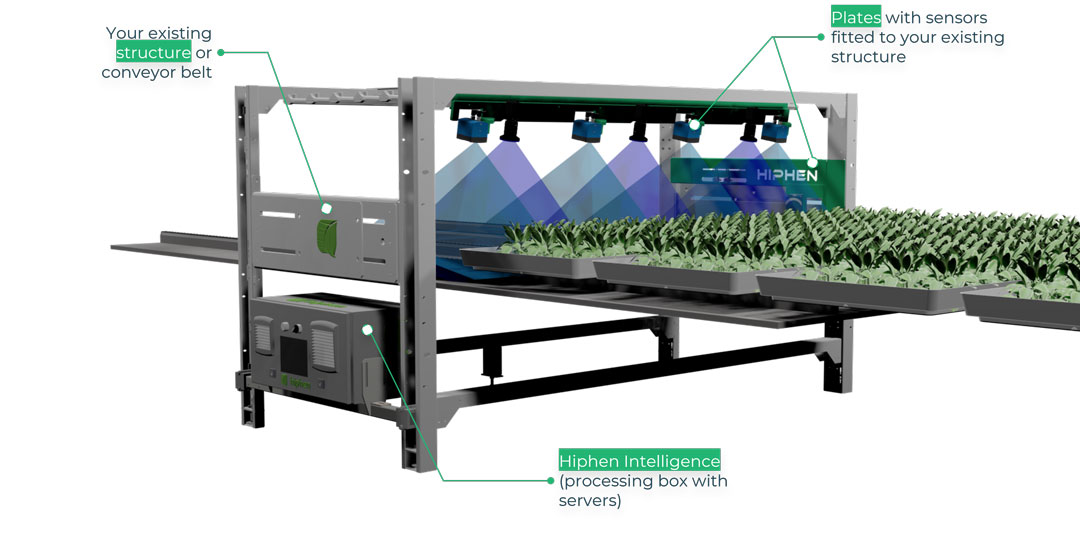
Another PhenoStation® System Configuration (in this case tailored to a vertical farm needs).
The portfolio of sensors that can fit into a PhenoStation® is non-exhaustive, although at Hiphen we tested most equipment types for almost and decade now and we are well-versed at helping you selecting the equipment that will get the job done for your project.
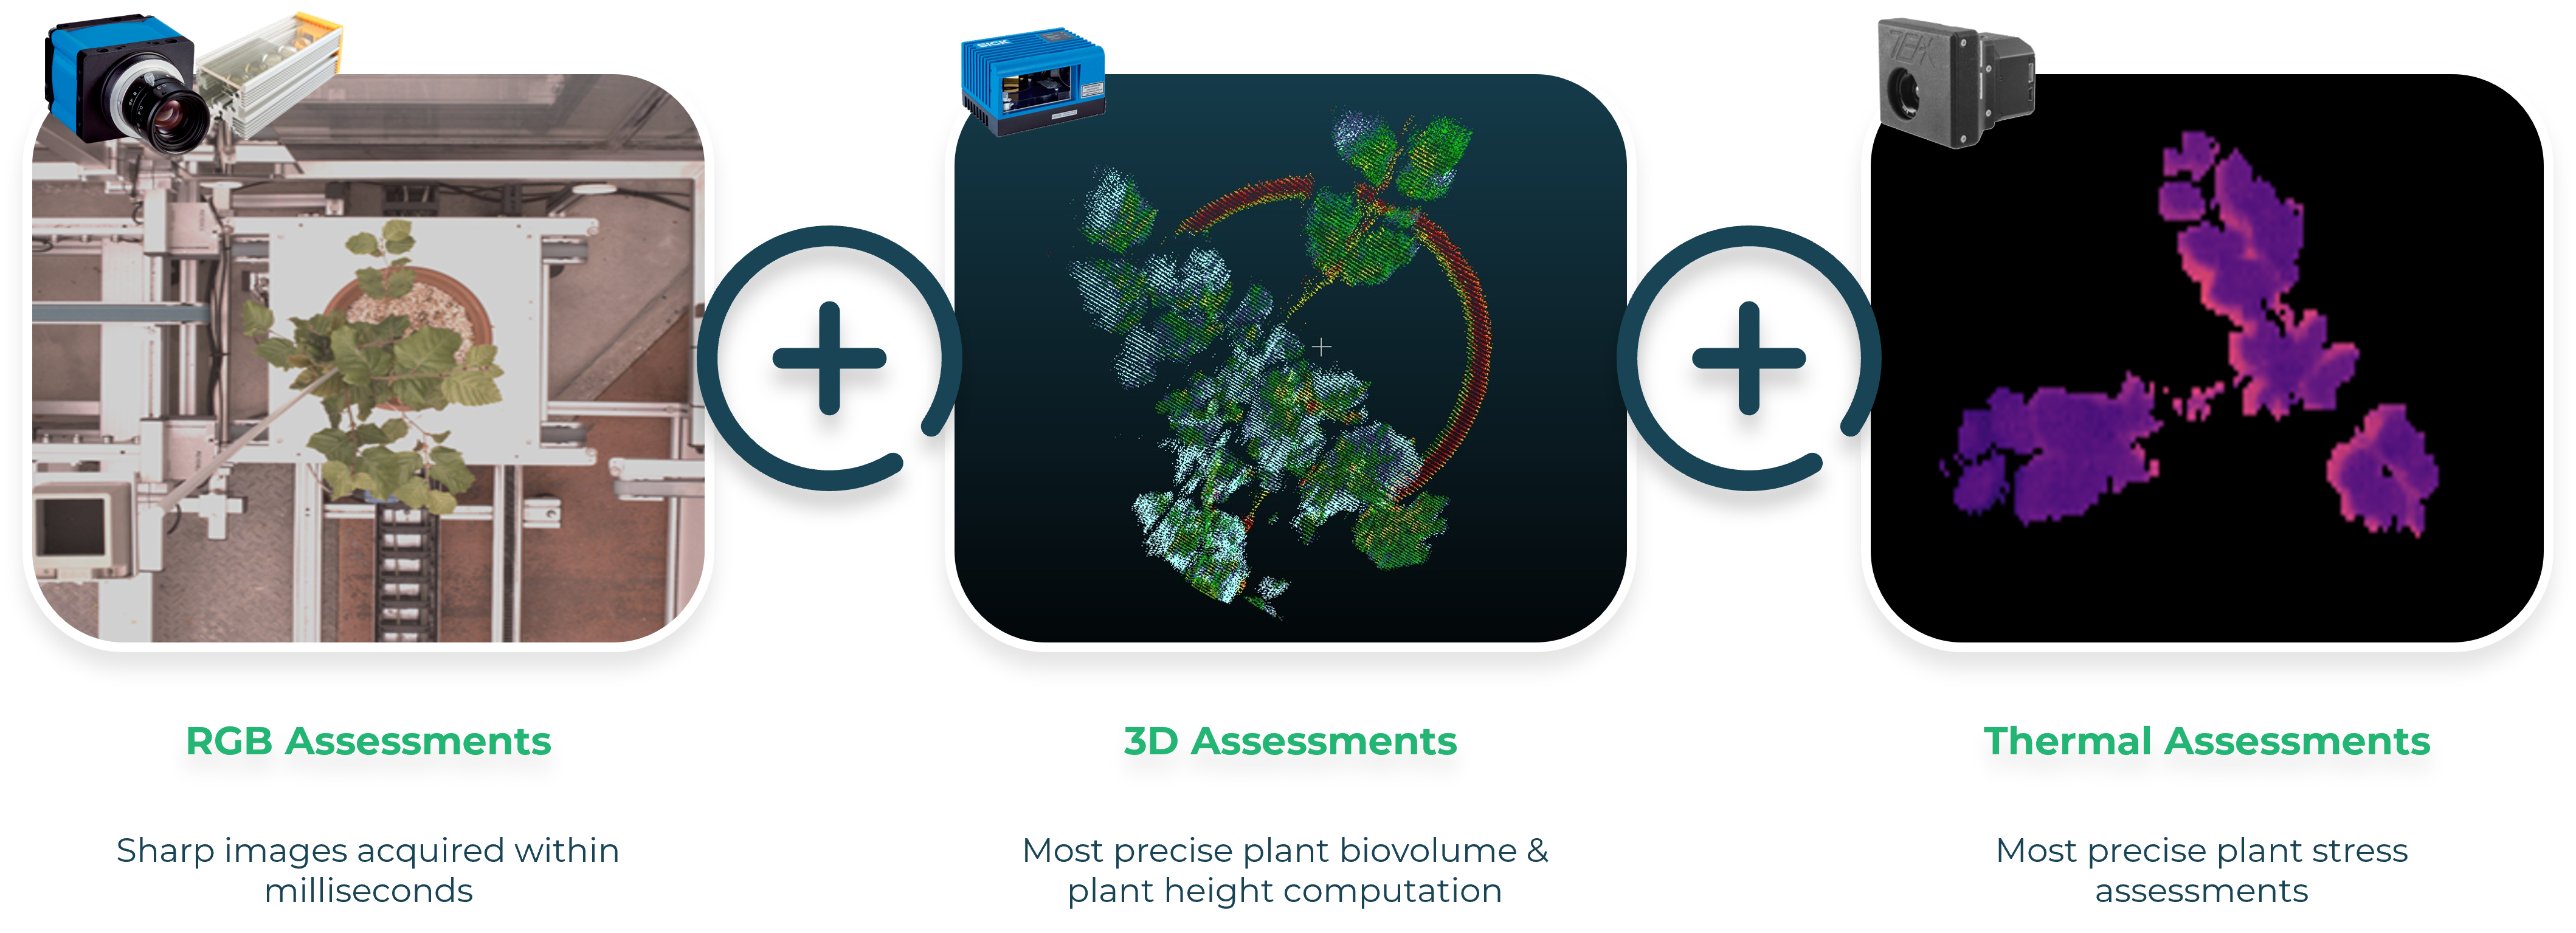
What’s great about being compatible with a large sensor diversity is that we can access everything the human eye can see, and even more. All the industrial equipment that's inside Hiphen's PhenoStations complements each other and gives access to a lot of information, that we turn into decisions to boost your research.
While RGB is the representation of what the human eye can see, 3D sensing equipment puts everything into perspective adding a precious 3rd dimension to the RGB data, and the Thermal sensor let us access the inaccessible to understand deeper plant mechanisms.
The main benefit of using sensors is that all measurements made are non-destructive, so assessments are more repeatable and replicable within the growth cycle. This means breeders can observe plants over time, capturing their dynamic responses to environmental conditions or treatments without damaging them. The ability to make repeatable measurements on the same tree provides valuable insights into growth patterns and trait evolution through time. This non-destructive approach ensures continuous monitoring and evaluation, facilitating a deeper and quicker understanding of plant behavior for advanced research applications such as drought tolerance.
Digital phenotyping technologies often integrate with advanced data analysis techniques and software platforms. This enables breeders and producers to analyze collected data in real-time, identifying patterns, correlations, and trends. Real-time analysis facilitates data-driven decision-making, allowing breeders to select promising varieties or make informed management choices in the greenhouse or vertical farm.
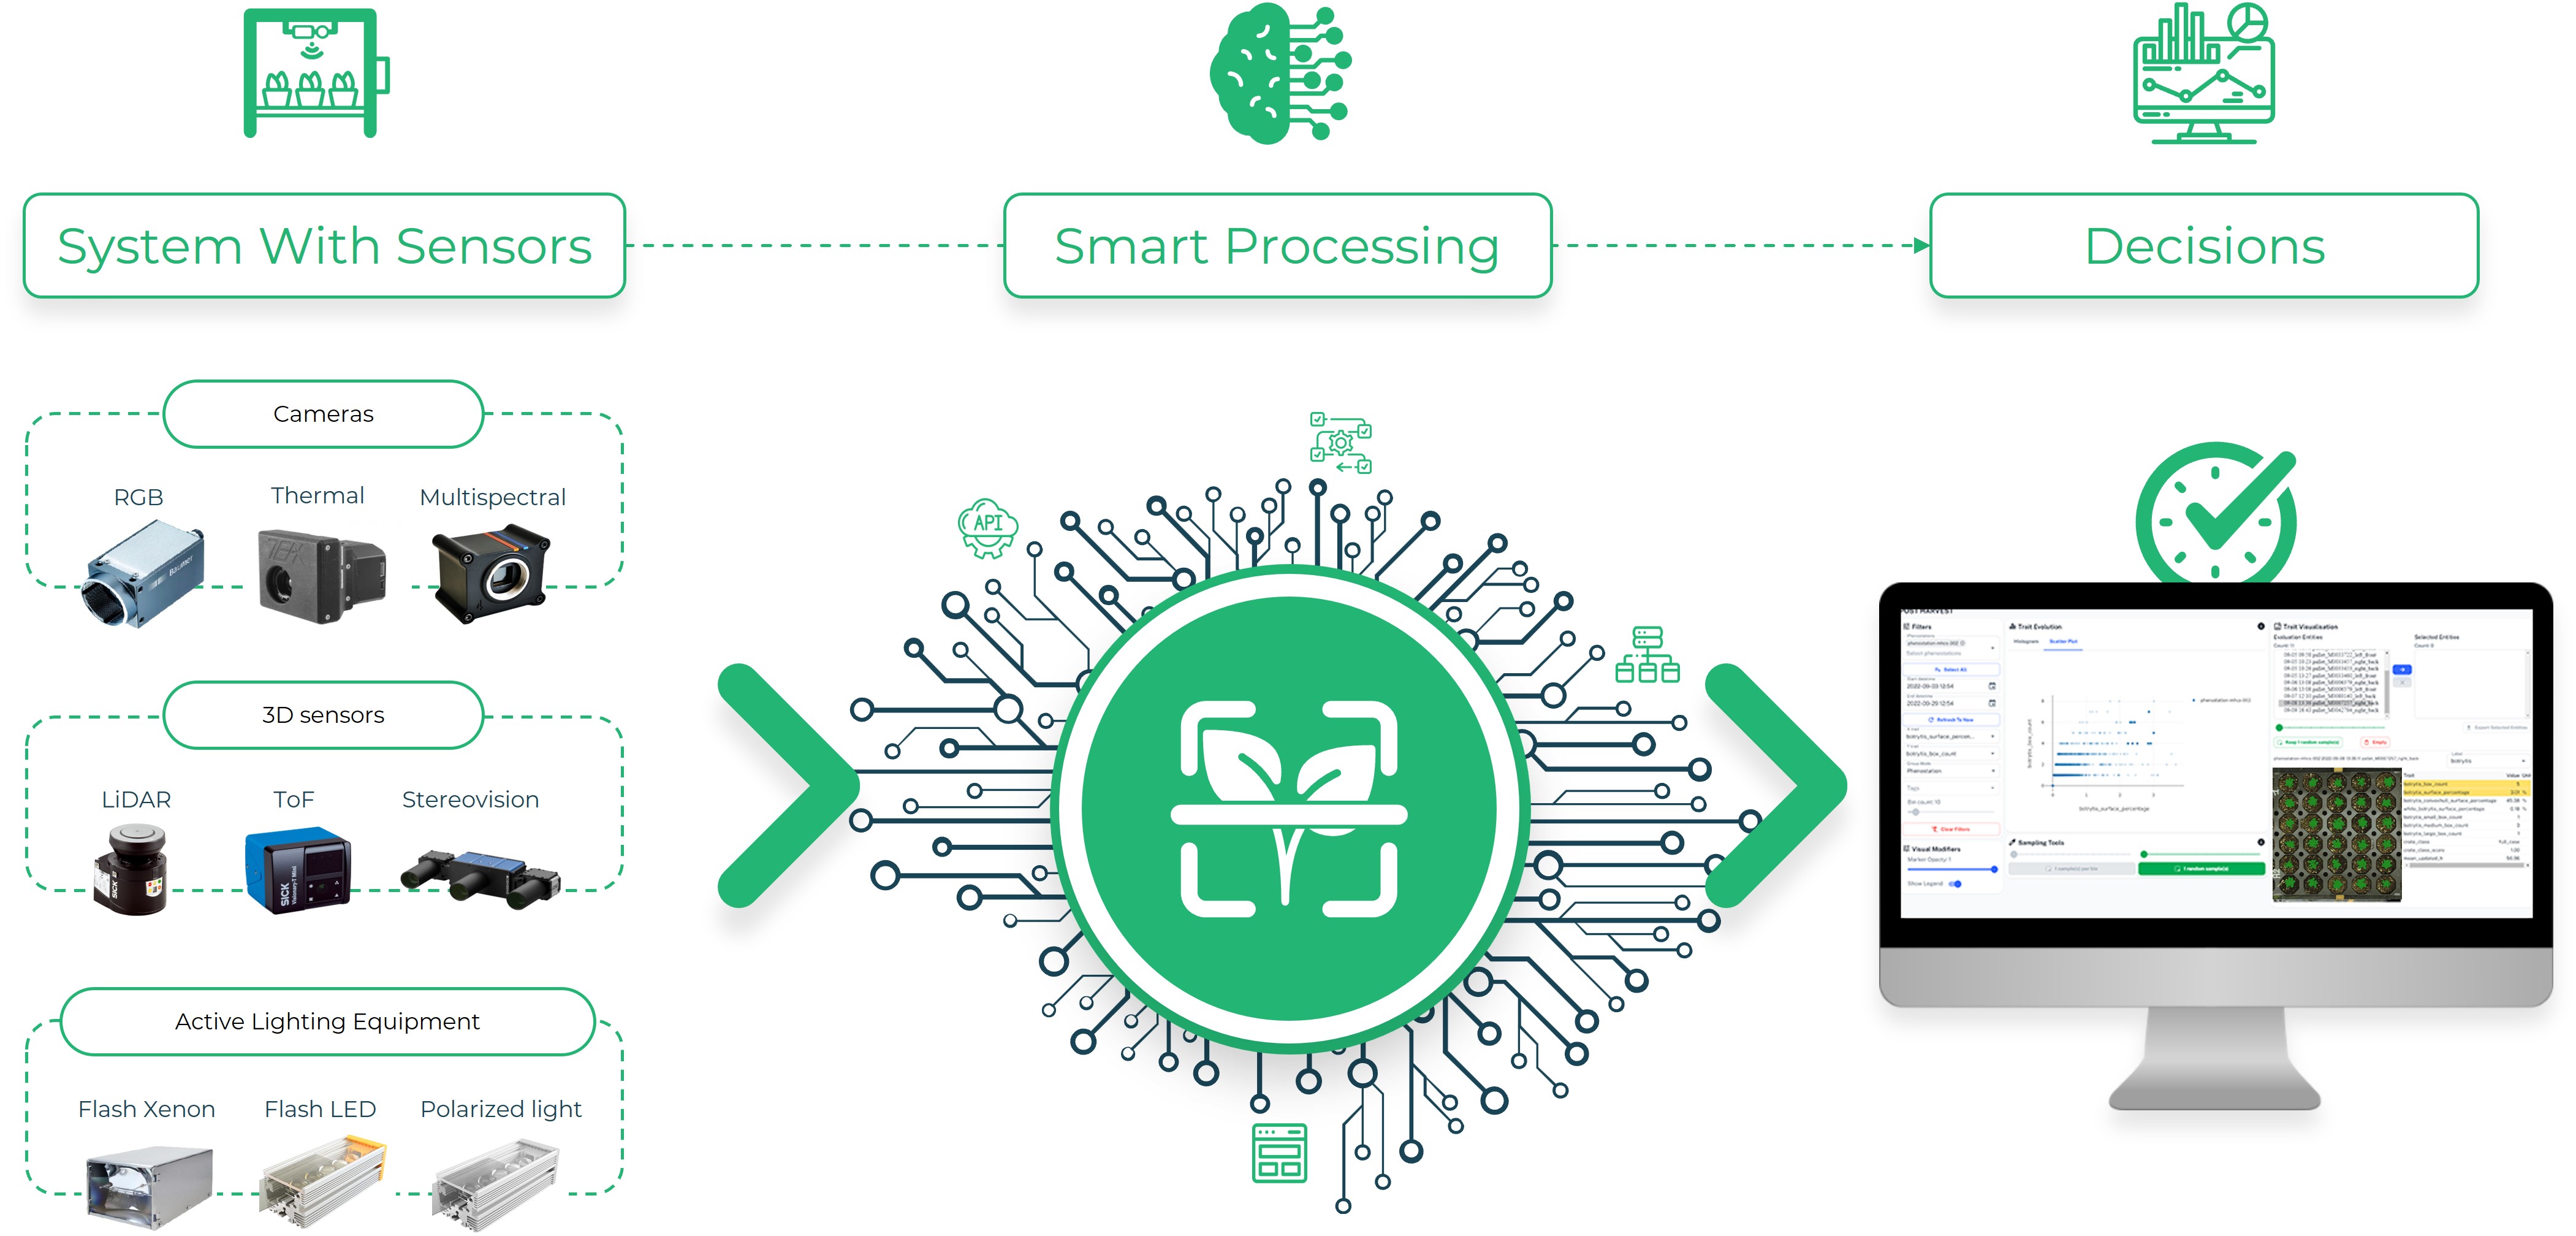
This is made possible thanks to an optimal sensor integration + an on-site data processing unit that is loaded with Hiphen Intelligence. Since acquisition protocols are thoroughly tested and validated, we ensure a high-quality data acquisition that is instantly sent to the processing unit, checked, processed, and then sent over to the data platform for visualization and validation.
By leveraging immediate insights, breeders can optimize resources, identify favorable traits, and streamline their breeding strategies to develop new and improved crop varieties more efficiently.
Greenhouses and vertical farms offer controlled environments, allowing precise manipulation of growth conditions. Digital phenotyping helps accessing quality monitoring and yield prediction by providing insights into plant responses to different environmental conditions. For drought tolerance research for example, the information can be utilized to fine-tune breeding selection with a Phenomic approach and improve overall crop productivity and resource utilization. Researchers, breeders and producers can enhance sustainability, reduce costs, and minimize environmental impact thanks to PhenoStation®.
Sincerely,
Your Hiphen Team
Topic brought to you by Alexandra BÜRGY – Imaging Solutions Specialist @Hiphen.
Discover HIphen's PhenoStation® in Detail
Spatial correction is a statistical technique employed in plant breeding to mitigate the impact of environmental variability on plant performance. By adjusting observed trait values based on plant positions within the experimental field, spatial correction helps counter the effects of environmental and trial design-related factors, such as soil, climate, diseases, plot patterns, replications, and blocks. This correction ensures fair comparisons among tested varieties and facilitates the selection of those best suited to specific growing conditions. Discover in detail how spatial correction enhances precision and reliability in plant breeding.
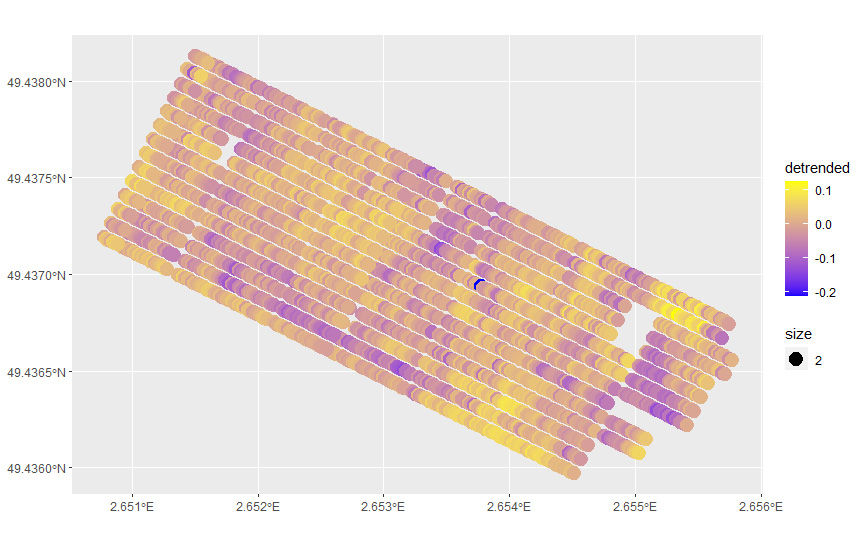
Non-corrected data distribution within a field trial.
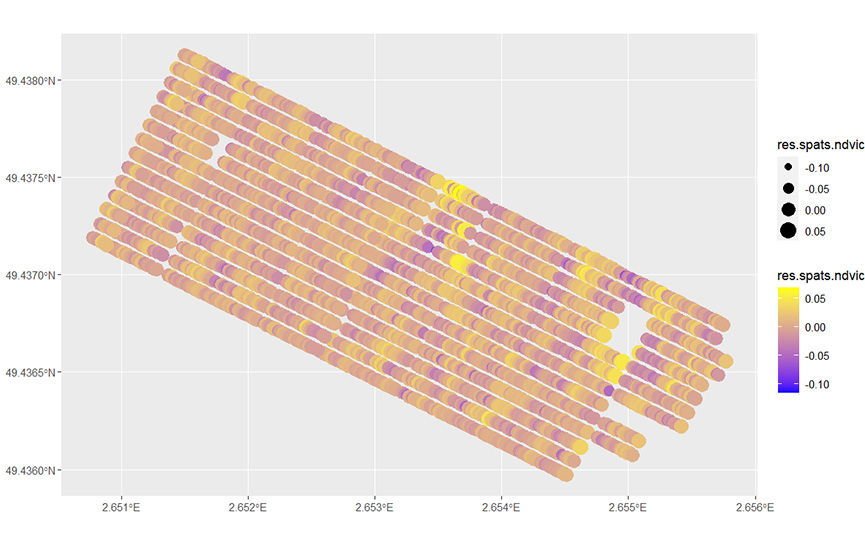
Corrected data distribution within a field trial.
To apply spatial correction, we can use smooth two-dimensional surfaces to model spatial variation. For example, anisotropic P-splines can be used to distinguish large-scale spatial trends (global trend) from small-scale trends (local trend). The spatial field includes the effects of genotypes, blocks, replications, and/or other sources of spatial variation described by a classical mixed model. Each component of the model has an effective dimension, which is related to variance estimation and helps characterize the importance of model components. An important result of this method is the formal relationship between several definitions of heritability and the effective dimension associated with the genetic component. This method was developed and illustrated by Rodríguez-Álvarez et al. (2018) in their article "Correcting for spatial heterogeneity in plant breeding experiments with P-splines."
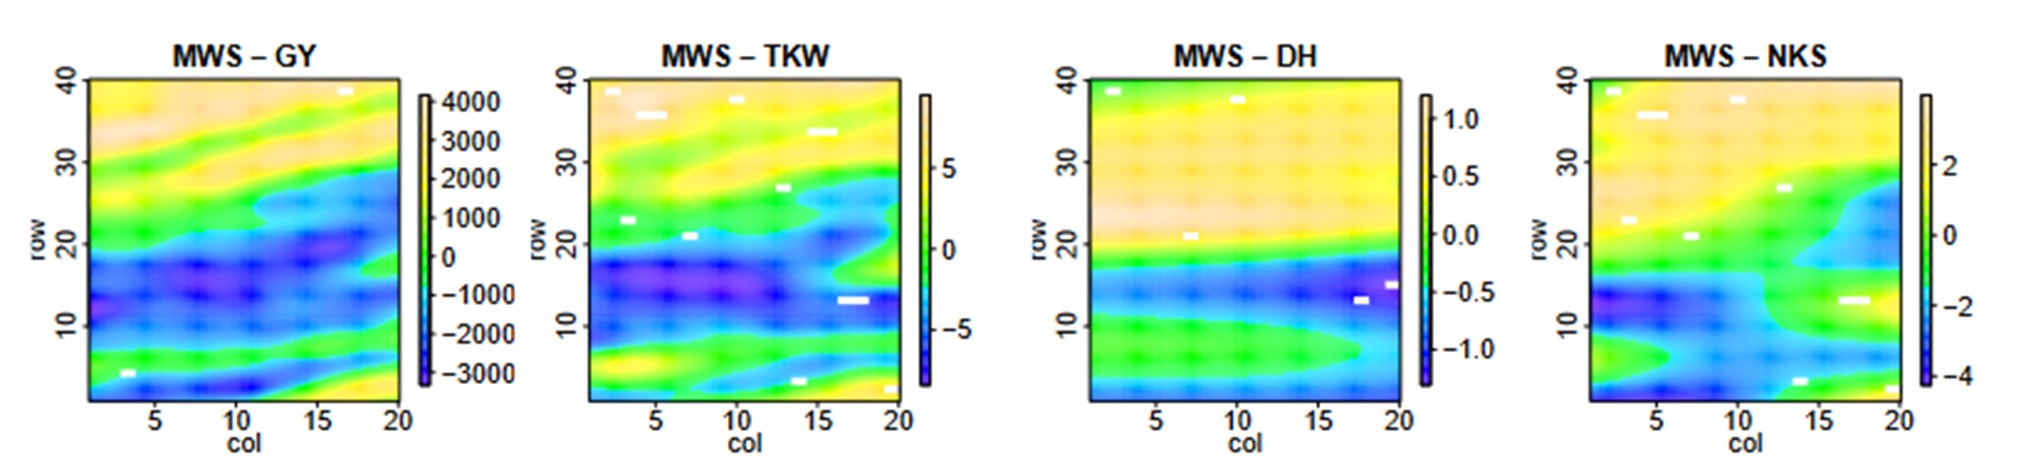
Example of spatial trends of adjusted traits by the SpATS model for different modalities of an experiment (Rodríguez-Álvarez et al., 2018)
Spatial correction helps breeders account for the spatial variation that exists within field trials. In agricultural research, field trials are often conducted on large plots of land, and spatial heterogeneity can arise due to differences in soil fertility, microclimate, disease pressure, or other environmental factors. Without proper spatial correction, these variations can introduce bias and confound the estimation of genotypic effects.
By applying spatial correction techniques, breeders can account for the spatial structure within their phenotypic data. This involves modeling and removing the systematic spatial trends present in the field trials, thereby reducing the influence of environmental factors and improving the accuracy of the analysis.
Spatial correction methods can be implemented using various approaches, such as spatial analysis of variance (ANOVA), spatial regression models, or spatial mixed models. These techniques allow breeders to explicitly model the spatial autocorrelation that exists between neighboring plots and estimate the residual variation that is truly attributable to genetic effects.
Incorporating spatial correction in the analysis of phenotypic data also helps in the identification and elimination of outlier observations. Outliers may arise due to localized environmental factors, measurement errors, or other sources of variation. By detecting and removing these outliers, breeders can ensure that their analyses are based on reliable and representative data, leading to more accurate conclusions and better-informed breeding decisions.
Furthermore, spatial correction aids in the integration of multi-environment trials (METs). METs involve evaluating genotypes across different locations or years to assess their performance under diverse environmental conditions. Spatial correction techniques can help harmonize the data collected from different environments, enabling breeders to make valid comparisons and to identify and predict the potential behavior of various genotypes in different environments by getting more stable genetic values, reducing Genotype x Environment interactions, achieve higher adaptive values, and more.
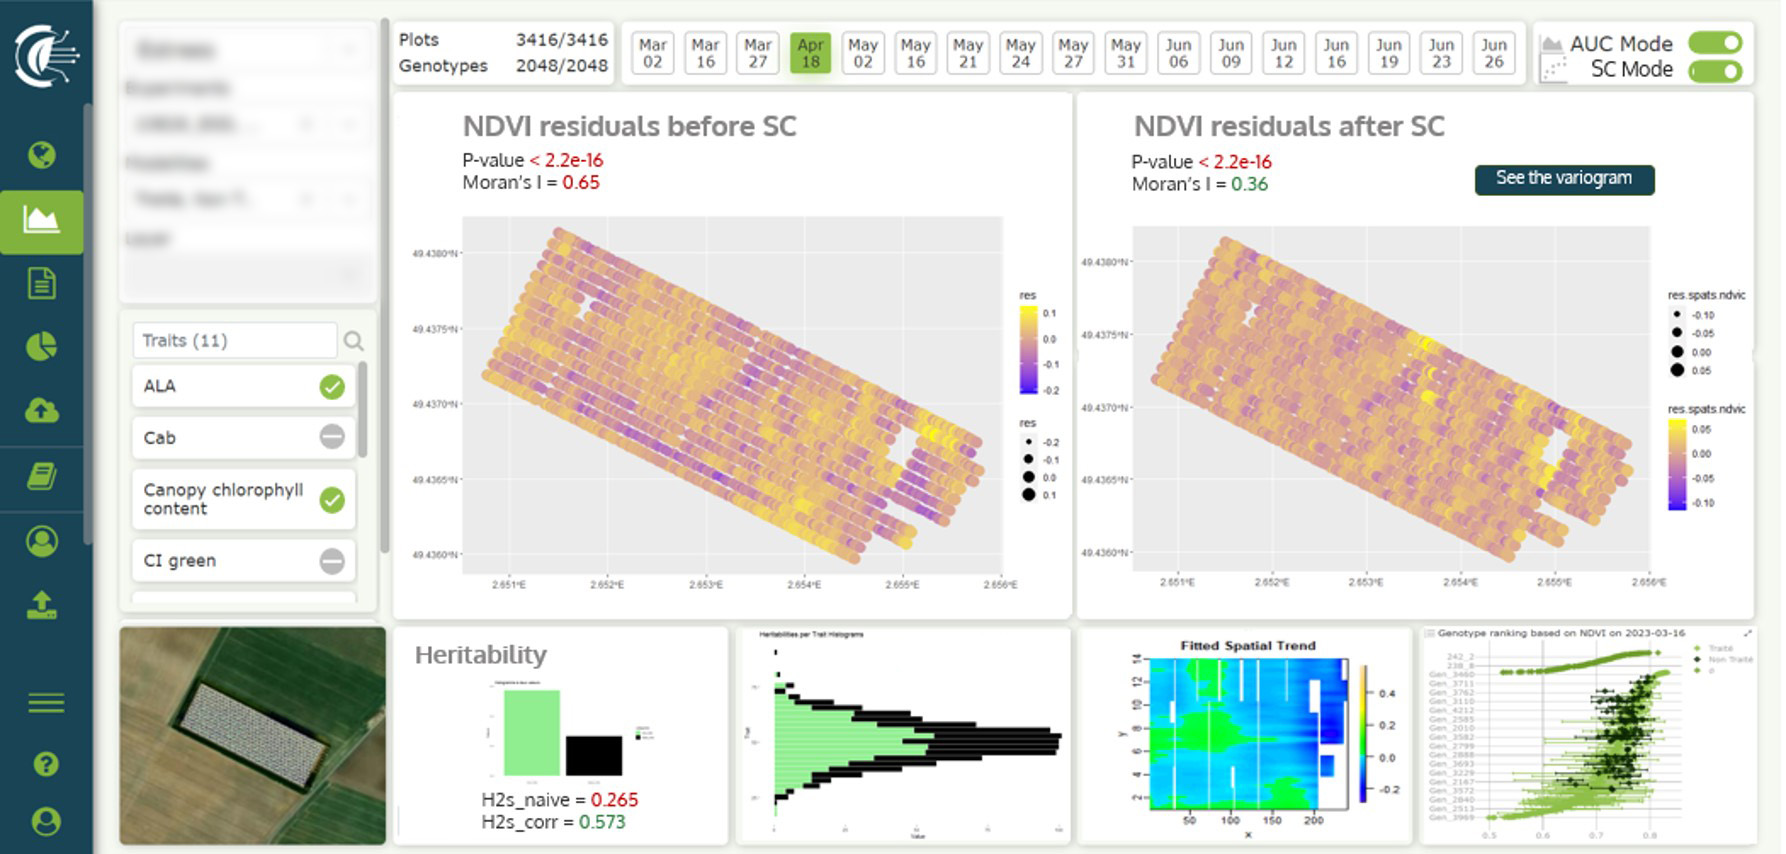
Spatial correction functionnality render in Cloverfield™ Data Platform
In the end, spatial correction is essential for plant breeders to improve the quality and reliability of their phenotypic data analysis. By accounting for spatial variation, breeders can enhance experimental design, strengthen selection processes, increase genetic gain, and facilitate the accurate evaluation of genotypes across diverse environments by helping to calculate narrower confidence intervals and smaller p-values for instance. Incorporating spatial correction techniques into their breeding programs empowers breeders to make more informed and accurate decisions, leading to the development of improved cultivars that pave the way for tomorrow's agriculture.
c) other examples
If you are interested in spatial correction and want to apply it to your breeding experiment trials, at Hiphen, we can help you implement this method and interpret the results. Hiphen has developed the tools for spatial analysis using P-splines and mixed models. We can also advise you on choosing the most suitable experimental design that will help you maximize the value of your field trial.
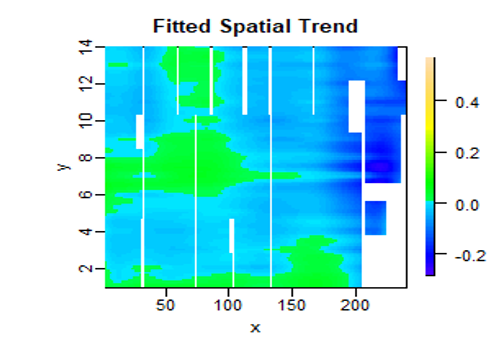
Representation of fitted spatial trends of an agricultural field.
Spatial correction features are coming to Cloverfield™ in 2024, you will then be able to apply spatial correction on your selected traits to get instant visualization of the corrected data and start making data-driven decisions fast.
Sincerely,
Your Hiphen Team.
Topic brought to you by Don Ced OGOUMOND – Imaging Solutions Specialist @Hiphen.
Digital phenotyping has revolutionized the field of agriculture by providing novel ways to monitor and analyze plant growth and development. One fascinating application of digital phenotyping is in orchards, where the accurate counting and classification of fruits plays a crucial role in yield estimation, resource allocation, and overall orchard management. In this blog post, we will explore the significance of digital phenotyping in orchards and focus on a pipeline that employs terrestrial LiDAR scanners for counting and classifying fruits in apple tree orchards.
Digital phenotyping involves the use of advanced technologies, such as remote sensing, computer vision, and machine learning, to extract meaningful information about plants. In orchards, digital phenotyping offers several advantages. It enables growers to monitor the health and productivity of trees, assess the effects of different input products or environmental conditions, and optimize resource allocation to produce varieties with improved yields. Accurate fruit counting and classification is particularly valuable, as it helps estimate crop yields, plan harvesting operations, and make informed decisions regarding fertilization, irrigation, and pest control.
As you may know, imaging solutions for phenotyping are actionable trhough different system types i.e., Vectors. You can discover a detailed list of systems that are suitable for most agricultural applications HERE. For orchards, since they can be quite dense, portable Handheld systems and machinery systems like PhenoMobile are of most interest, even though Drones can be of good help to create some data fusion from a bird eye's view.
In terms of sensors, terrestrial LiDAR scanners have proven to be a very reliable source of information while phenotyping for fruit counting and classification in orchards. These scanners emit laser beams that measure the distance to surrounding objects, creating a detailed 3D representation of the environment. They can be mounted on mobile platforms as mentioned before, such as drones, handheld systems or ground vehicles, and scan the orchard trees from multiple angles. The resulting point cloud data provides a rich source of information that can be processed to extract meaningful information i.e., Plant traits about the behavior of the trees and their organs.
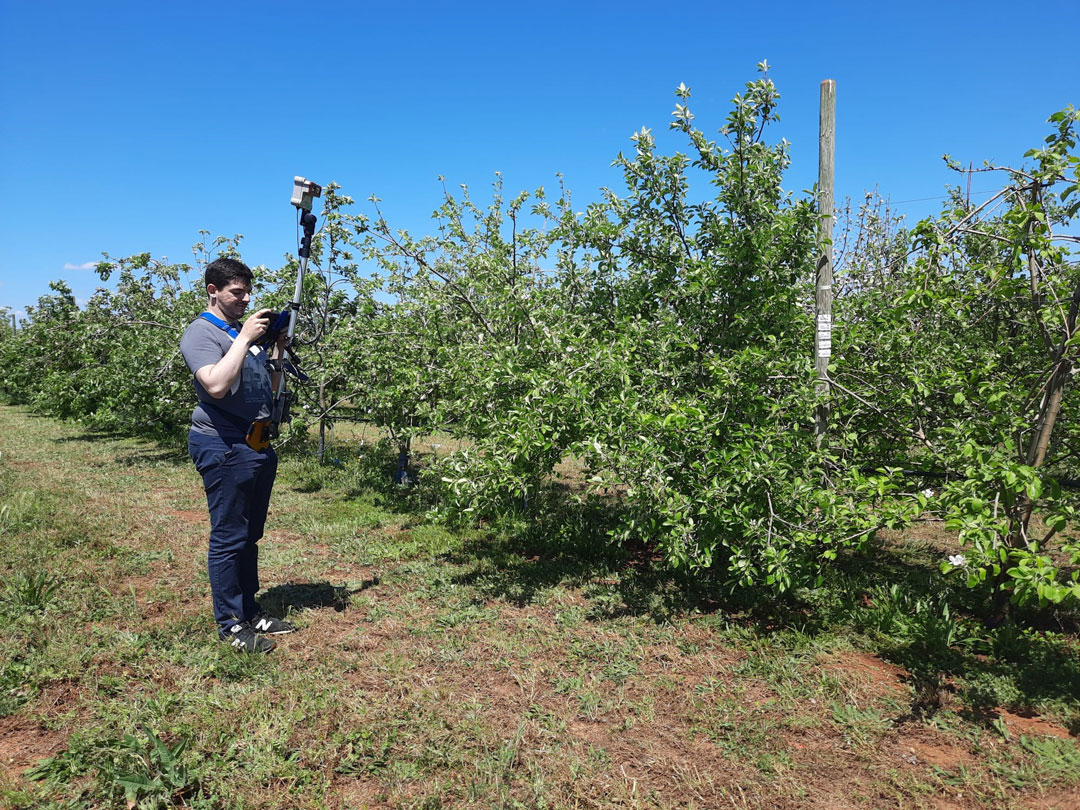
Hiphen's R&D engineer Nathan guilhot, acquiring data on Apple trees, with Hiphen's new handheld system developed with Arvalis.
The process of counting fruits in orchard typically involves a pipeline consisting of 3 main steps: global tree segmentation, fruit semantical segmentation, and fruit clusterization.
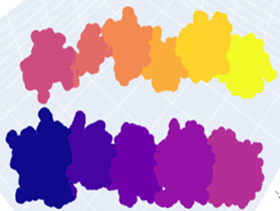
Segemnted trees from above.
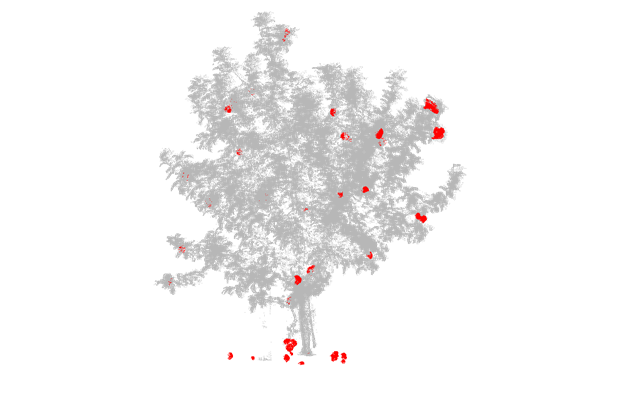
In red color, we can see all 3D points (from dense cloud) identified as points constituing apple fruits
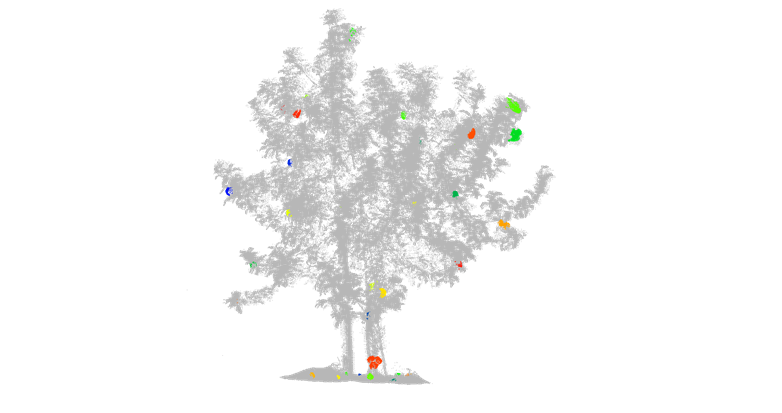
In this illustration, all points referring to the same apple fruit have been grouped to highlight every single fruit in the tree.
Digital phenotyping, with its ability to automate and phenotype larger orchards at higher speeds, brings significant advantages to fruit counting and classification and orchard management. By employing advanced technologies, such as 3D deep learning and point cloud analysis, researchers can efficiently assess large orchards, and estimate fruit counts. This frictionless phenotyping experience offers researchers the opportunity to make insightful data-driven decisions, optimize resource allocation, make precise yield prediction and enhance overall orchard productivity.
The integration of digital phenotyping into agriculture is a transformative approach, empowering growers with valuable insights and driving sustainable and efficient practices in the management of orchards globally.
Our team is at your disposal should you have any questions, feel free to book a 30min meeting with one of our experts 👉 https://calendly.com/d/gtn-s8d-6fh
Speak soon,
Your Hiphen Team.
Topic brought to you by Nathan Guilhot, R&D Engineer @Hiphen
Plant phenotyping is a brick in the wall of agricultural research and plant breeding. It helps understanding how a plant is behaving in its environment, by assessing key information related to plant morphology, physiology, biochemistry, yield, and responses to biotic and abiotic stresses. Having access to such information enables us to understand plant dynamics to be able to predict how a variety will perform and produce in a specific environment. Phenotypic assessments, which are accessible by combining Genotypic information x Environment data, are mostly used to improve varietal selection and make it completer and more precise than the genomic approach, which relies on on the study of gene presence and performance through genotypic assessments.
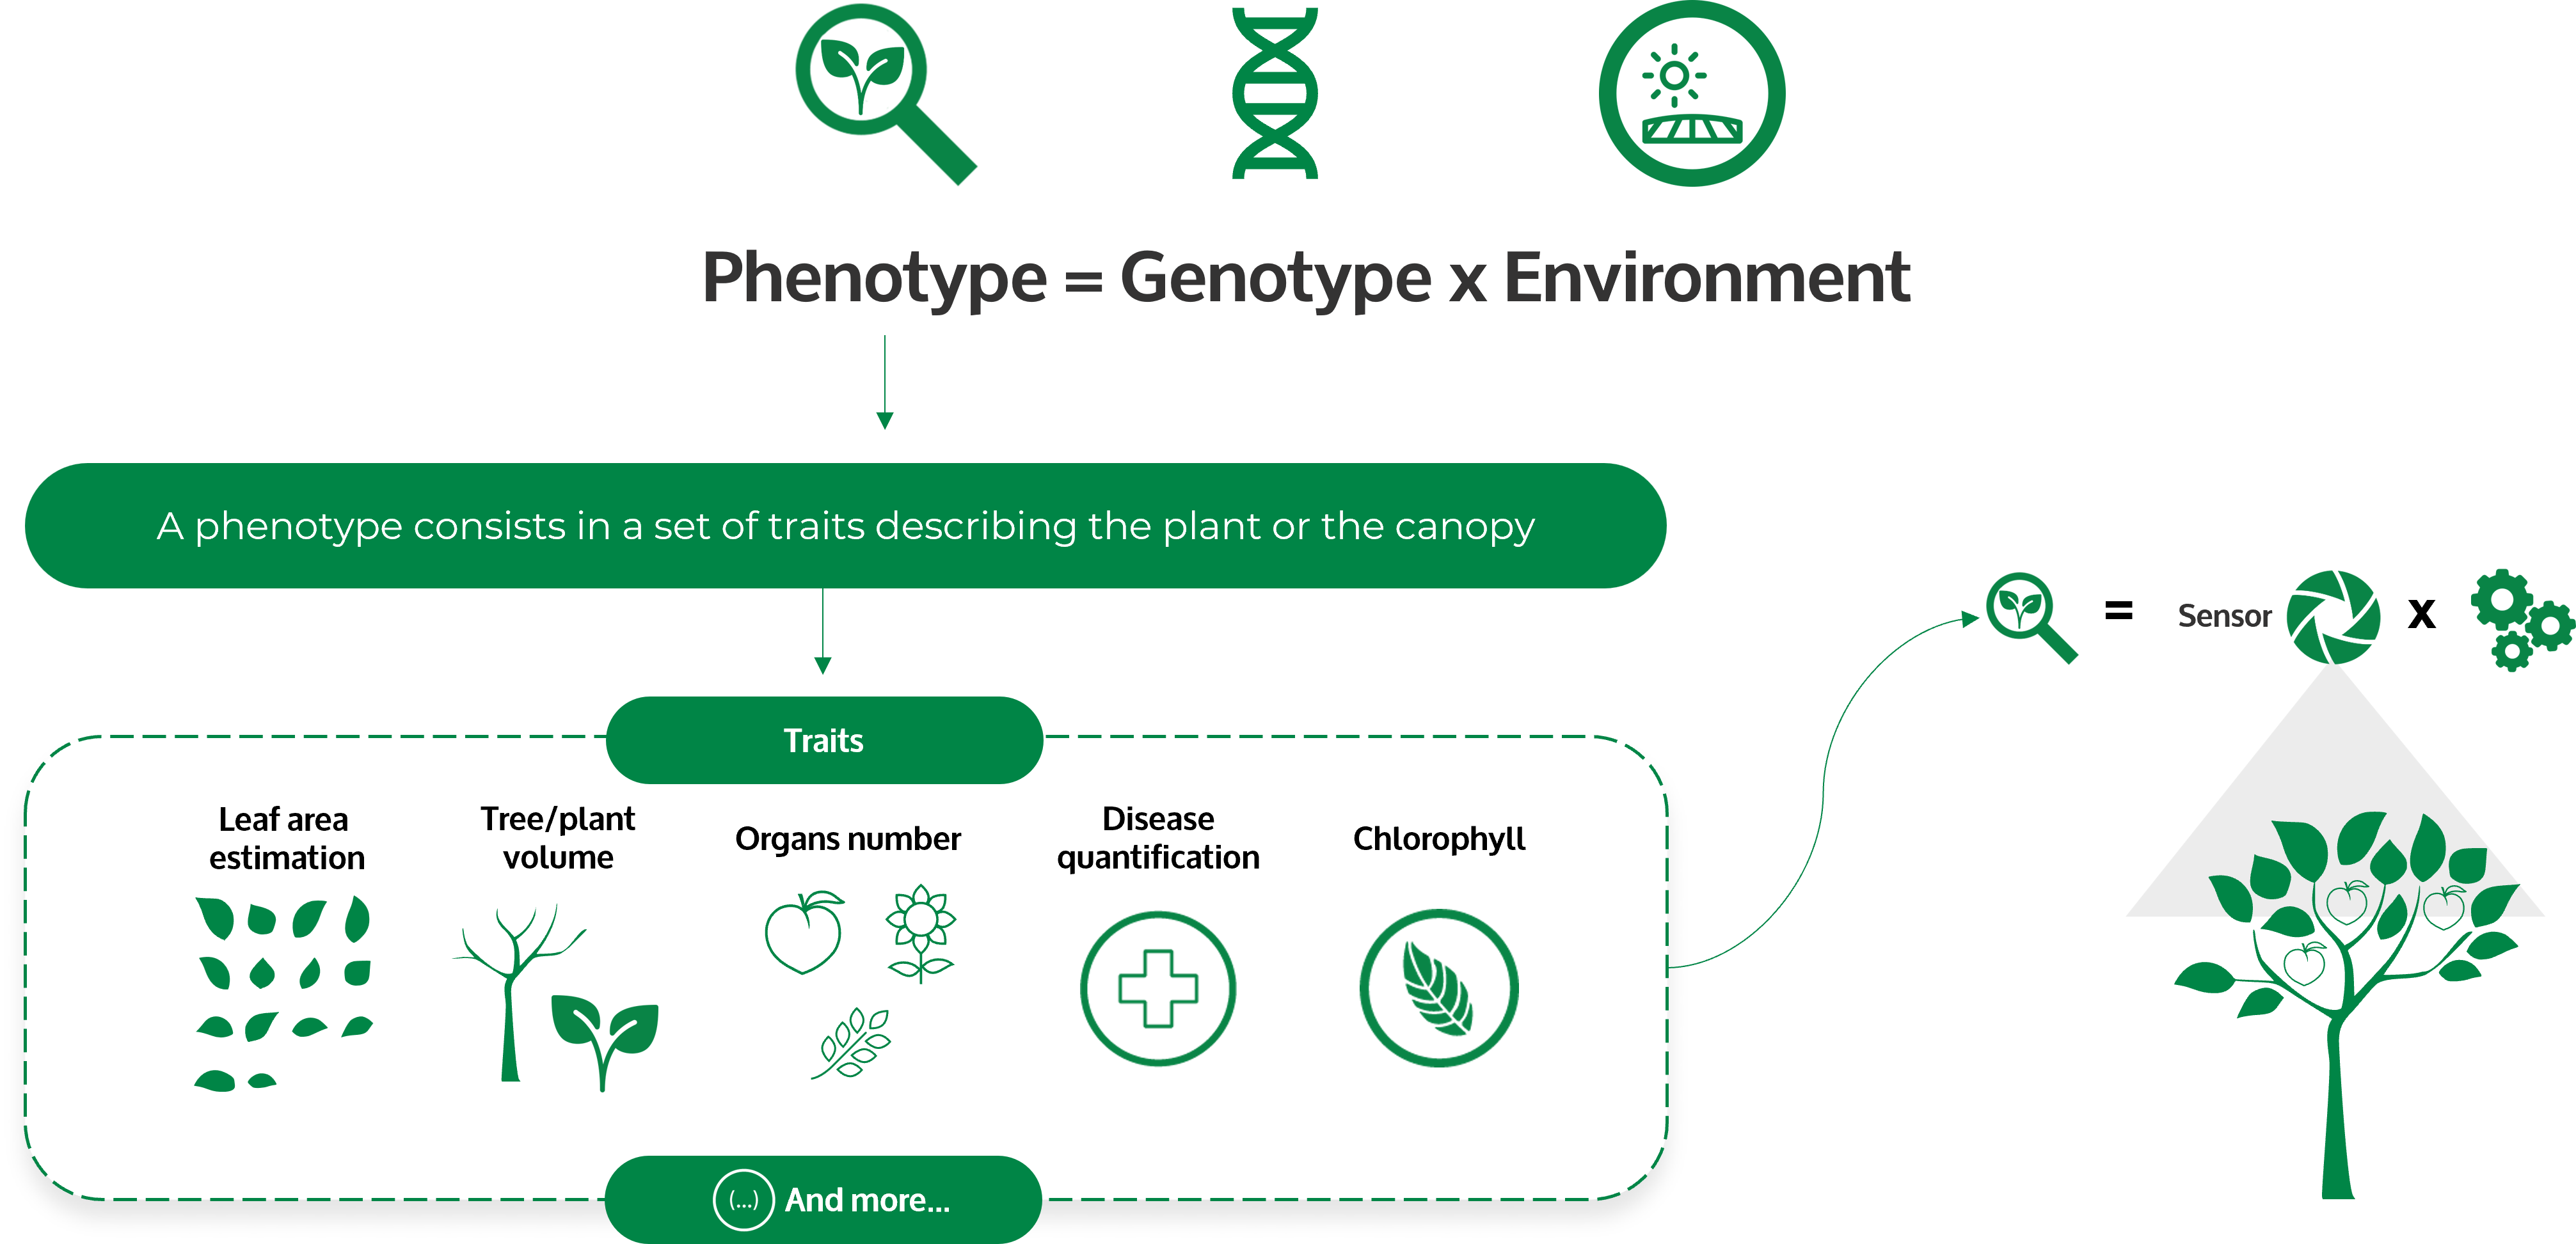
Digital phenotyping is quite a new realm, companies like Hiphen were founded less than 10 years ago. Thus, such technology needs some time to be well-adopted and improved to unleash its full potential. Nonetheless plant phenotyping by itself is not something new, it has existed for ages since agronomists got eyes and can measure plants manually. But most of those manual techniques are either often destructive or time-consuming. However, the rising of digital phenotyping by leveraging new technologies has seen the use of sensors and imaging platforms emerging as a fast and efficient approach to quantitatively assess plant characteristics i.e., phenotypes, in a non-destructive way. And at Hiphen we believe that the use of those sensors to create data fusion enables more accurate and repeatable assessments, in a high-throughput fashion, based on the theory of the 6 dimensions of phenotyping.
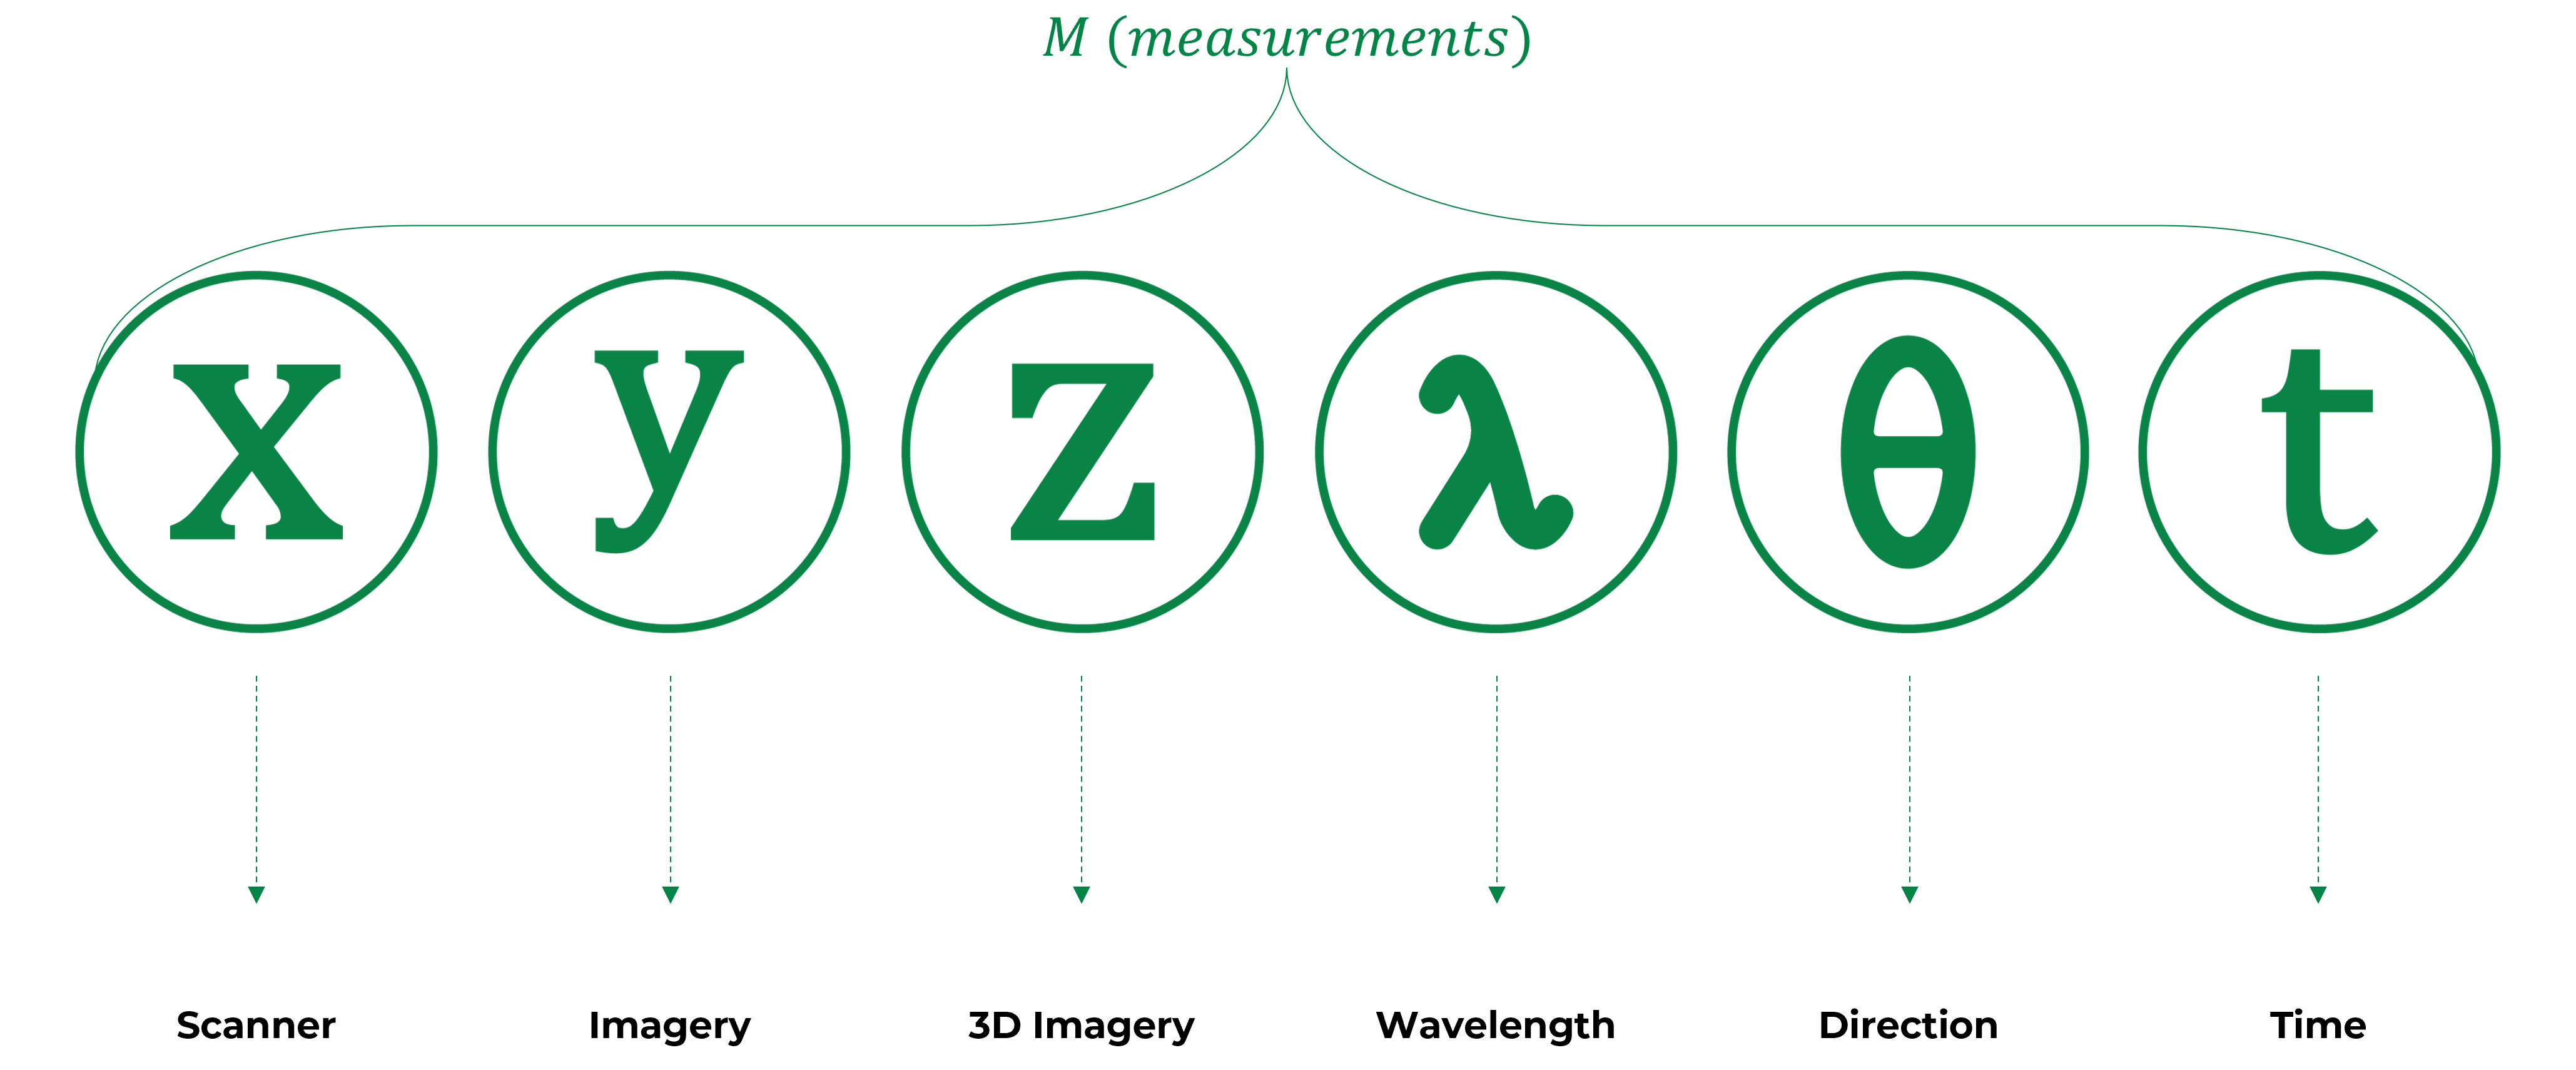
Different imaging platforms can be used for field and indoor phenotyping to process data about those 6 dimensions, like Hiphen's Cloverfield, and those platforms are using data collected from various sensors. Commonly used imaging technologies include visible light imaging, thermal imaging, 3D imaging, chlorophyll fluorescence, hyperspectral imaging, and tomographic imaging. So, let's take a deeper dive into the sensor technologies accessible for agricultural imaging nowadays.
Several imaging platforms are utilized for both field-focused and indoor plant phenotyping. These platforms gather data from various sensor types to obtain a comprehensive understanding of plant traits. Some of the commonly used imaging techniques include:
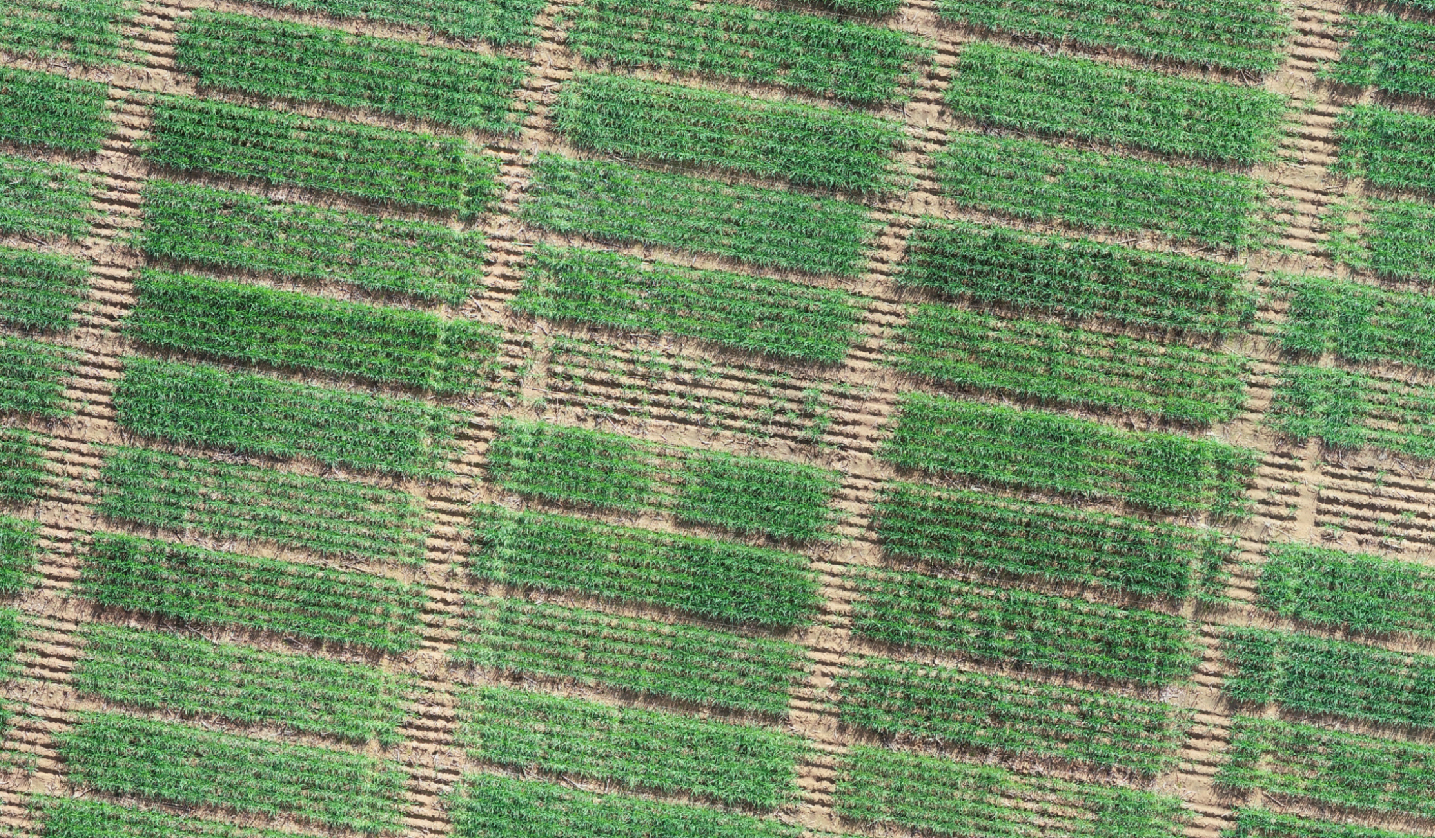
RGB image of plots with emergence issues.
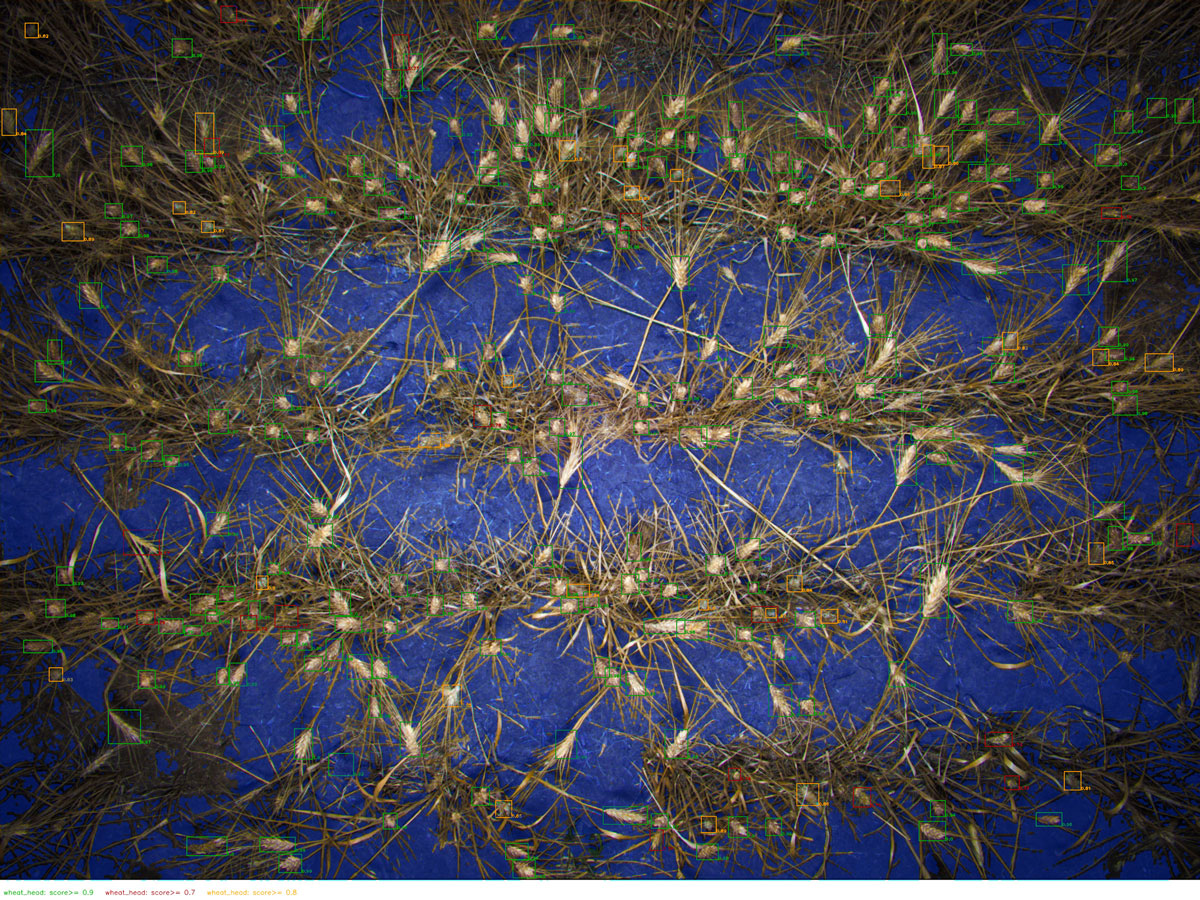
Segmented and annotated RGB image of wheat heads.
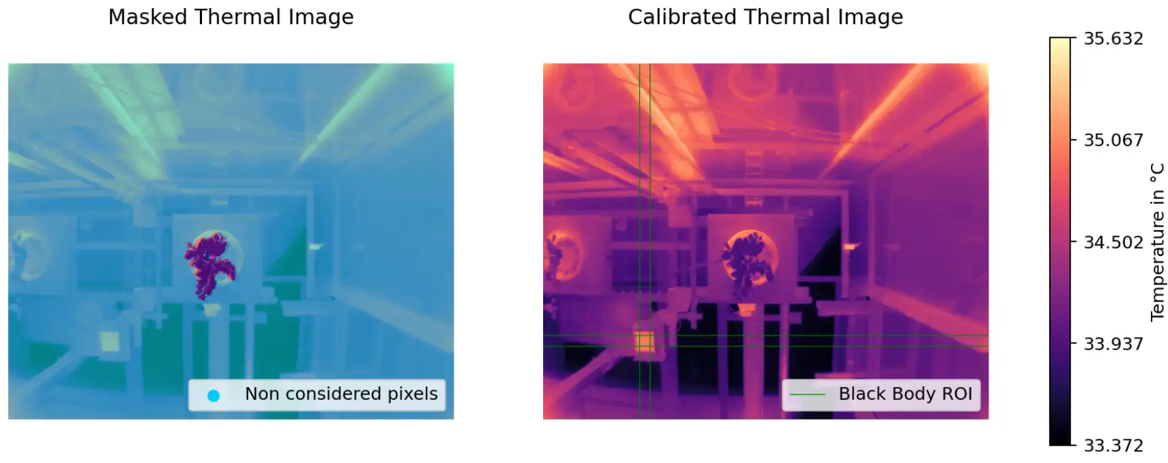
Thermal assessment of trees in greenhouse – Here we can see Data fusion in action combining RGB imagery with thermal to estimate precisely leaf temperature.
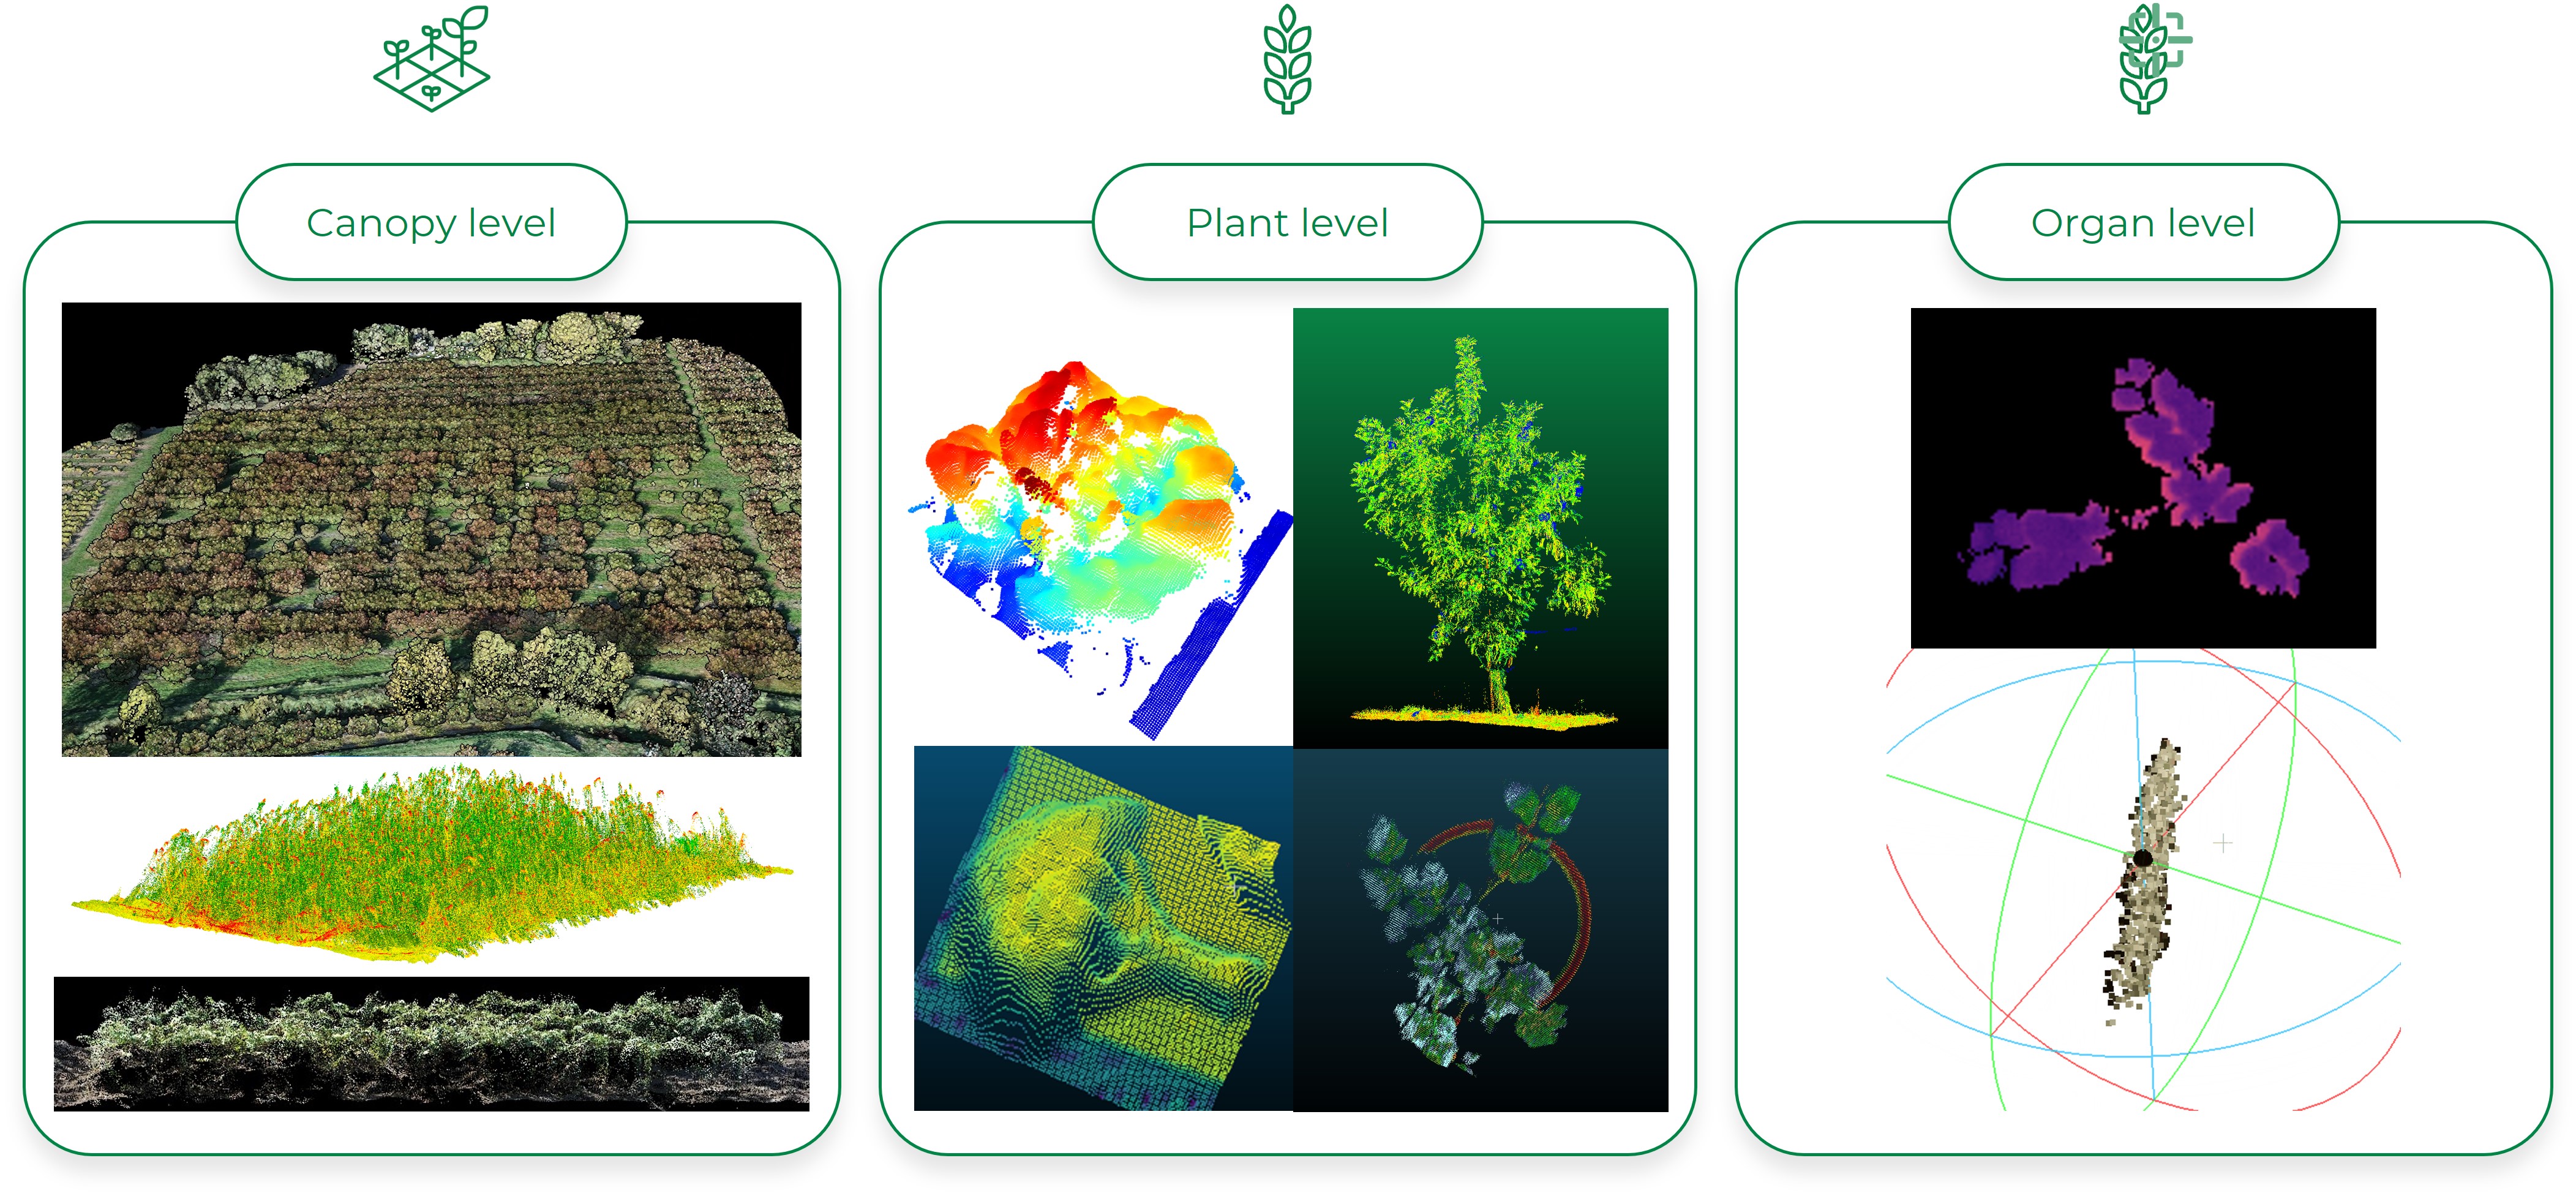
3D sensing equipment helps accessing information about crops at all plant levels.
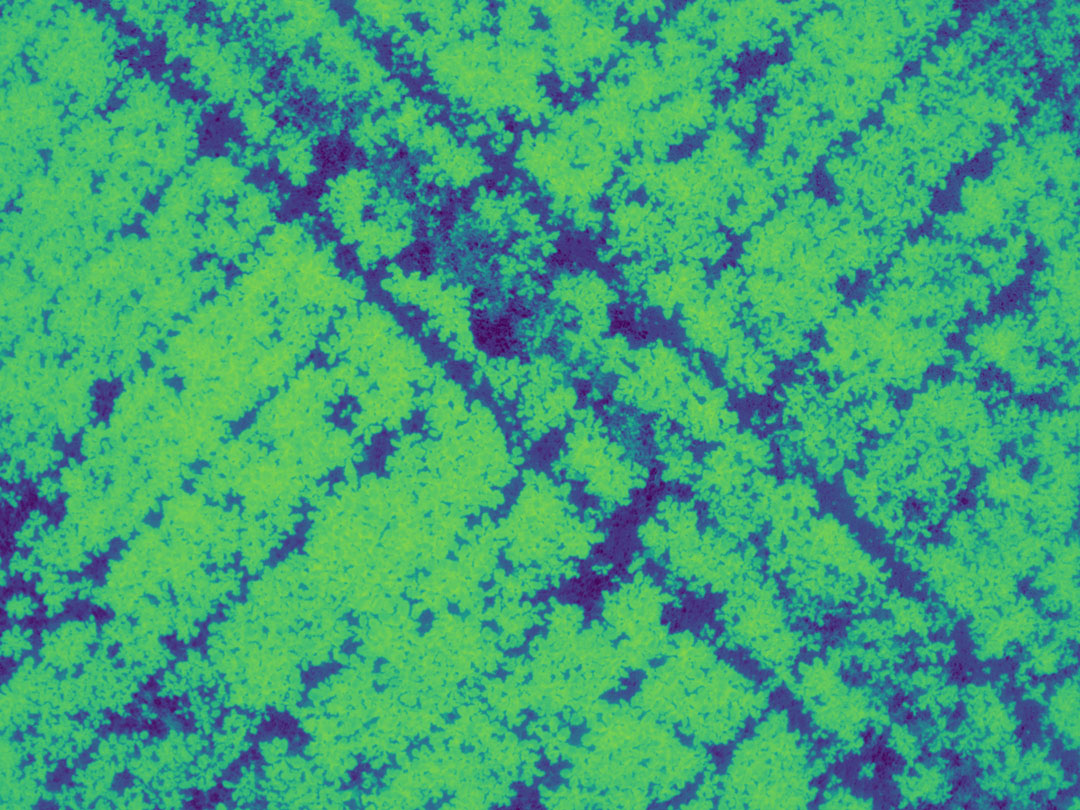
NDVI image captured from UAV.
Fluorescence Imaging: Fluorescence imaging involves measuring the light energy emitted when the plant absorbs shorter wavelength radiation, mainly through the chlorophyll complex. The emitted fluorescence is a tiny fraction (<3%) of the total radiation emitted by the light source to the object. The amount of re-emitted light (fluorescence) is a reliable indicator of the plant's ability to use the absorbed light and is used to estimate the overall health status of the plant. Fluorescence imaging is utilized to estimate photosynthetic efficiency and other associated metabolic processes affected by biotic and abiotic stresses. However, this technique does not specify the cause of variations in the plant signal, such as light, temperature, or other environmental factors.
Tomographic Imaging: Other imaging techniques, such as Magnetic Resonance Imaging (MRI), X-ray Computed Tomography (CT), and Positron Emission Tomography (PET), provide high-resolution 3D images of single plants or plant parts. MRI captures 3D images of internal structures, allowing non-invasive quantification of static and dynamic traits, such as structural, biochemical, and temporal changes inside the plant. X-ray CT visualizes the 3D structures of both internal and external plant features at the micro or macro level. These imaging techniques are time-consuming and not suitable for processing substantial amounts of data. Additionally, their large size and weight prevent their use on aerial imaging platforms.
The selection of sensor technologies depends on the specific assessments' researchers aim to perform. Companies like Hiphen are proficient in guiding researchers in identifying the most appropriate sensors and traits for their needs. Data-driven decisions and insightful research based on phenotypic data assessments are key to enhancing agricultural practices, improving crop yields, and ensuring food security for the growing global population.
In conclusion, imaging technologies for plant phenotyping have made significant strides in recent years, and their integration with digital phenotyping has brought new opportunities for advancing agricultural research and plant breeding. As these technologies continue to evolve, we can expect even more sophisticated and efficient ways to understand plant dynamics and harness their full potential to address the challenges of modern agriculture. The future of plant phenotyping is promising, and it holds the key to sustainable and efficient food production for the years to come.
Sincerely,
Your Hiphen Team.
Topic brought to you by Marc LABADIE – Project Leader at Hiphen.
In the agricultural realm, image analysis plays a pivotal role in understanding crop health, detecting issues, and making data-driven decisions. Among the critical factors that significantly impact the effectiveness of image analysis is the management of contrast and brightness. In this blog post, we will delve into the significance of contrast and brightness in agricultural image analysis and how they enhance the quality and usability of agronomic information.
Contrast within an image refers to the variation in brightness or color between different parts, creating visual distinctions that capture the viewer's attention. It is a key element in visual composition, facilitating the differentiation of various elements. In agricultural image analysis, contrast is essential for accurately identifying and interpreting crop health, disease symptoms, stress indicators, and other important characteristics.
To monitor and comprehend contrast in an image, a histogram is a commonly used visual tool. The histogram represents the distribution of brightness or color levels throughout the image. When considering brightness contrast, the histogram provides insights into how brightness values are distributed across the tonal scale, ranging from the darkest tones (blacks) to the brightest tones (whites). A well-balanced brightness histogram exhibits an extended distribution across the tonal scale, indicating good contrast within the image.
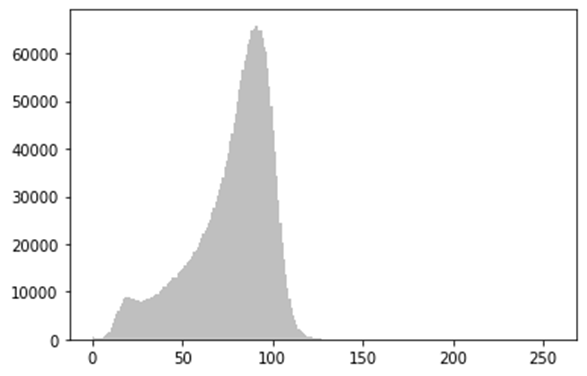
Example of an histogram graph representing the light distribution of an image.
Phenotyping, the process of measuring and analyzing plant traits, heavily relies on accurate and detailed imagery. Having well-contrasted images for phenotyping is crucial for a comprehensive interpretation of the information contained within each pixel. By accessing the full color range of an image, the richness of information increases, enabling the extraction of valuable agronomic insights. Thus, the quality of the information derived from crop images is highly dependent on the quality of the provided images.
Depending on the specific traits of interest or desired outputs, the level of contrast needed in images may vary. At Hiphen, we specialize in accompanying and guiding our clients in defining the exact level of contrast required for optimal data processing and a seamless phenotyping experience. By fine-tuning contrast levels, we enhance the accuracy and reliability of trait analysis, ultimately empowering better decision-making for researchers.
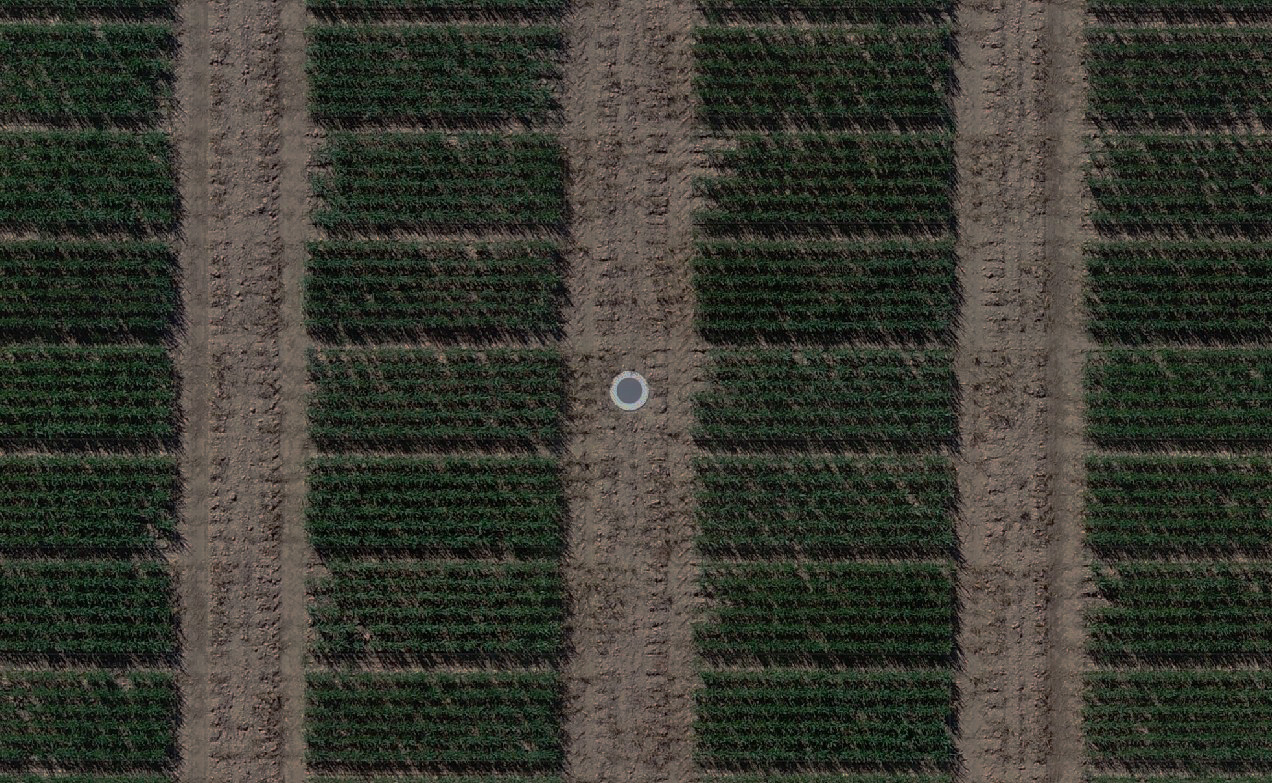
Image with an overall bad contrast
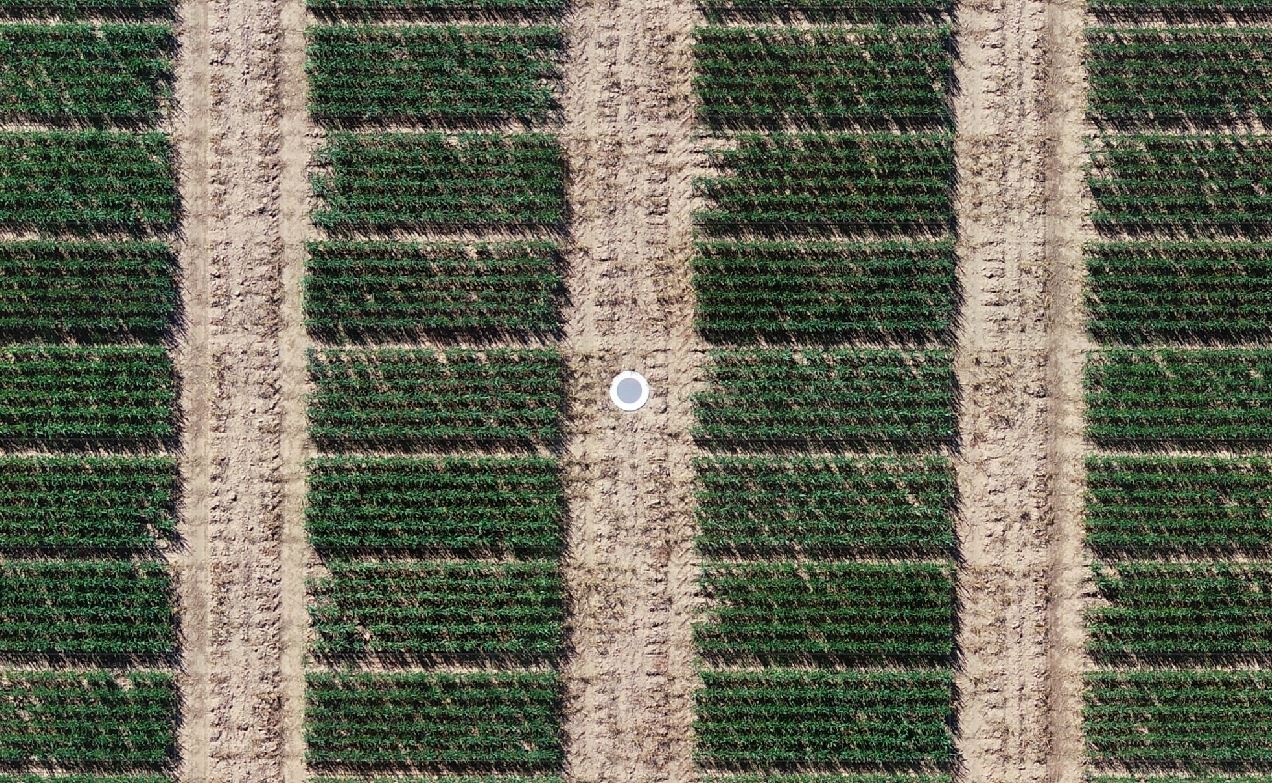
Image with an overall good contrast
Working with poorly contrasted images for phenotyping poses challenges and hinders the process. Images with inadequate contrast may be interpreted as underexposed or overexposed, impacting the processing of traits such as green cover, vegetation indices, disease detection, and organ segmentation among others from Hiphen's portfolio. Dealing with such images becomes time-consuming, tedious, and often results in data processing delays, leading to late delivery of results.
At Hiphen, we are constantly improving the automation of data quality checks through our Cloverfield™ platform. By the time you upload your datasets, we can promptly identify if the data is likely to generate processing issues or not. This allows us to inform our clients as soon as possible, in a fully transparent way and via an interactive dashboard, to ensure a frictionless phenotyping experience and to minimize delivery delays caused by poorly contrasted images.
The management of contrast and brightness is of utmost importance in agricultural image analysis. By understanding and optimizing contrast levels, we unlock the full potential of color information, facilitating the extraction of valuable agronomic insights. At Hiphen, we excel in developing AI methodologies for agricultural applications, assisting our clients in making informed decisions and adapting to ever-changing environmental conditions. With our Hiphen Academy, the first e-learning platform dedicated to help acquiring research-grade imagery from drones, we provide the necessary knowledge and skills to enhance image quality and maximize the potential of agricultural image analysis from the PhenoScale product range. Through effective contrast and brightness management, we can improve agricultural practices using digital phenotyping and drive innovation in the industry.
Sincerely,
Your Hiphen Team.
Topic brought to you by Martin GIRARDEY- Image Processing Specialist.