Our products
Backoffice

New features have been added to Cloverfield™, your plant phenotyping online platform. Embark on a smoother plant breeding adventure with Hiphen's latest addition: Dynamic Filtering.
Optimize your breeding scheme by effortlessly filtering your genetic material in a few clicks within Cloverfield™.
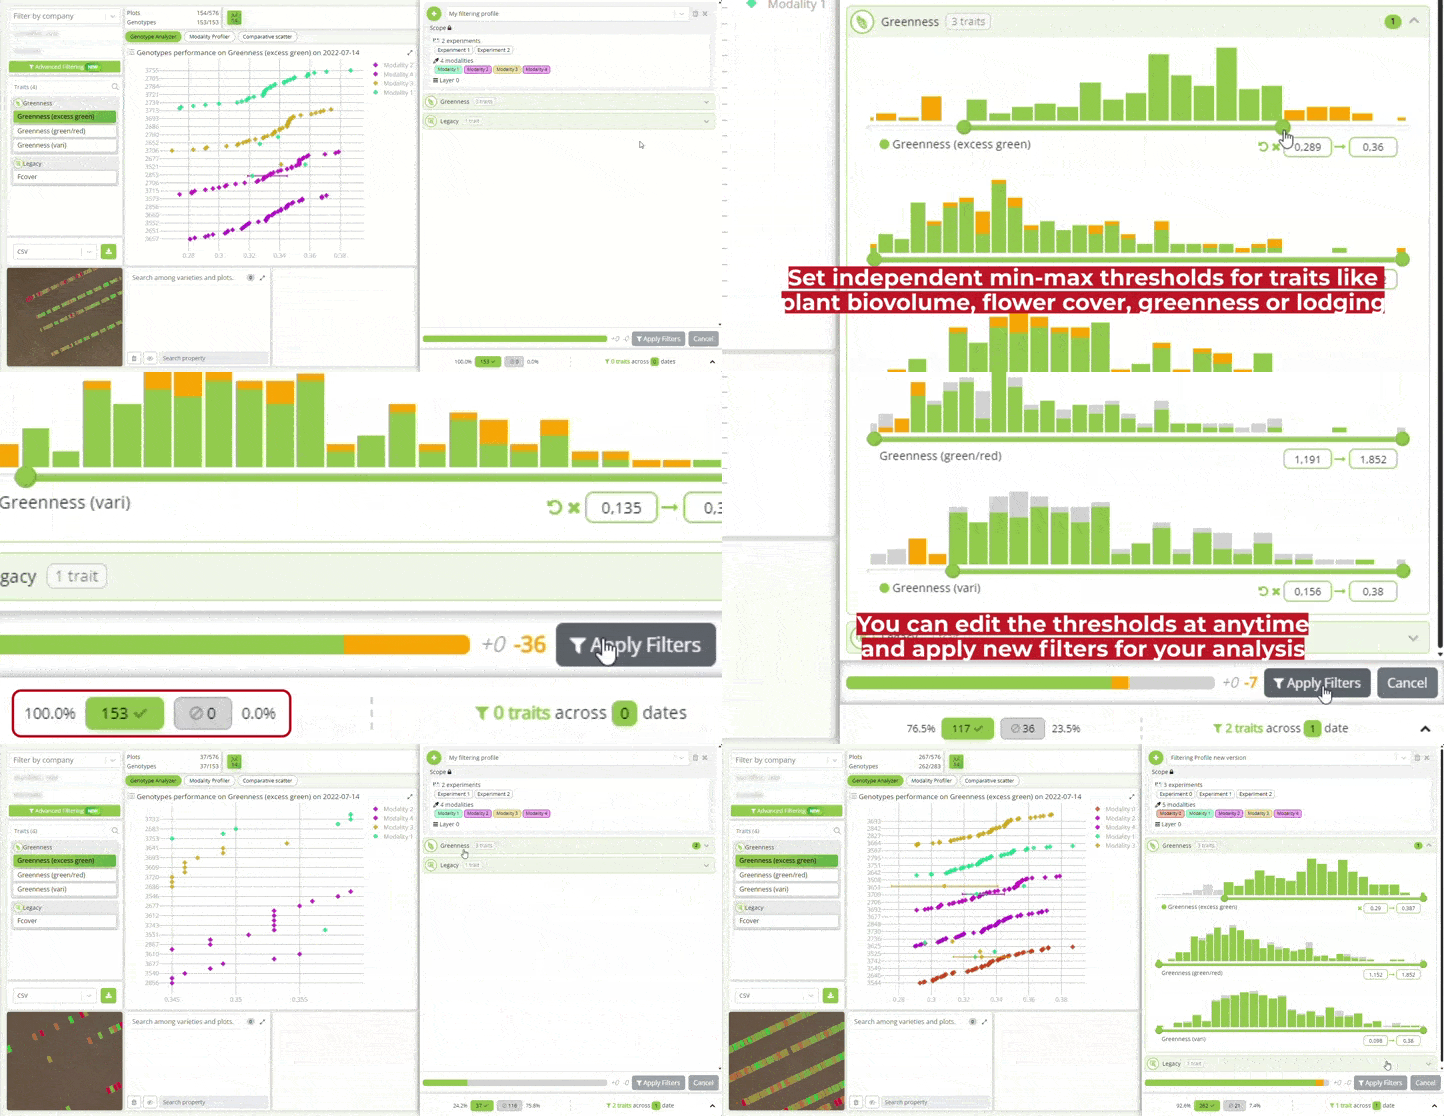
Interactively combine traits and set thresholds to filter out under-performing genotypes, or pinpoint the top-performing material you want to advance to the next stage.
Define more precisely your analytics profile. Specify more precisely the experiments, modalities and layers that you which to study and/or compare. You can create multiple profiles for the same trial site.
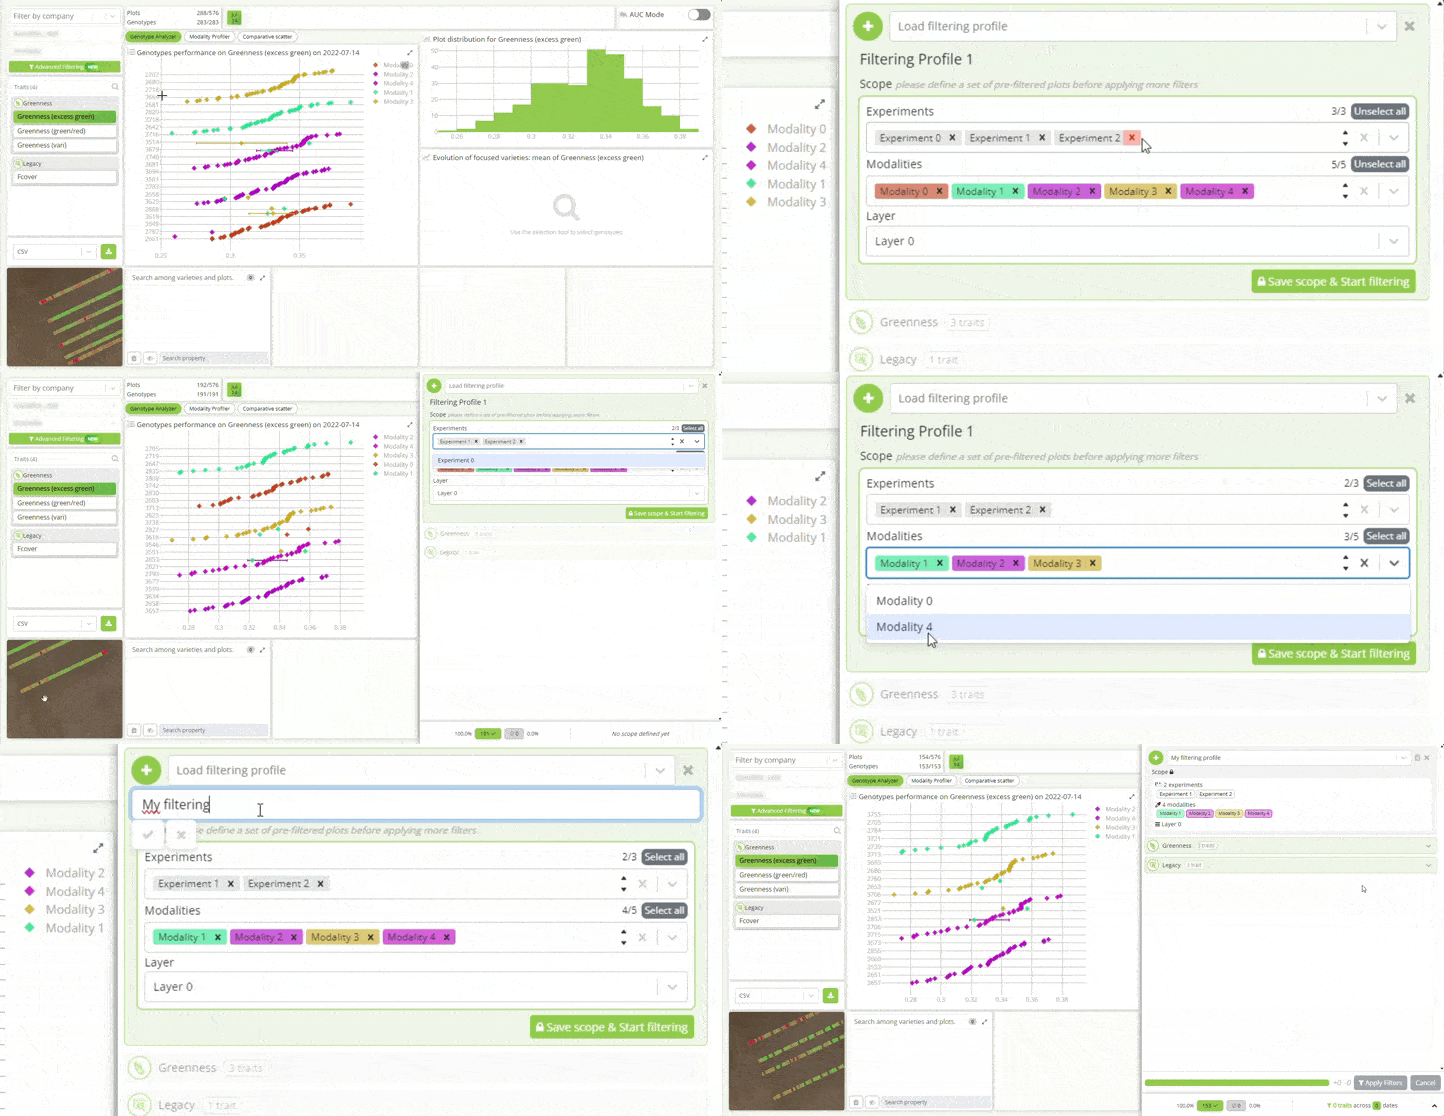
One step further in making your digital phenotyping experience frictionless with Hiphen, you're now able to make a detailed analysis of your data directly in Cloverfield™. You can easily combine traits and set for each one thresholding boundaries outside of which you wish to eliminate genetic material. For instance, one could set independent min-max thresholds for traits like plant biovolume, flower cover, stay green and lodging and see dynamically what share of the trial genetic material he/she is eliminating. This functionality will take you ever closer to reaching your ideotypes more efficiently than ever before!
User value: Apply multiple criteria filtering on your genetic material and dynamically eliminate under-performing genotypes based on your ideotype recipe.
Use Cases:
We invite you to explore the new dynamic filtering feature with the online INTERACTIVE TOUR. And please reach out to your Hiphen Campaign Manager should you have any question.
Stay tuned for the next Cloverfield™ features release update next month.
Sincerely,
Your Hiphen Success Team.
We are committed to meeting the evolving needs of crop researchers, and reimagined the way we articulate our Cloverfield™ Glossary with this this purpose in mind. This new intuitive format helps to parse the 70+ phenotypic traits we process routinely every year. Traits are grouped in explicit agronomic themes, with definitions and visuals to be transparent with regards to methodology. The new version places a strong emphasis on five distinct trait categories:
These categories have been carefully curated to cater to the unique needs of agronomic researchers, providing you with a more precise and comprehensive understanding of phenotypic measures available off-the-shelf for your crops.
With this new version, we are also unveiling our revamped interface for an enhanced user experience. Dive into an enriched journey of knowledge with our detailed visualizations and graphs, providing transparency into our advanced traits processing methodology.
Additionally, a powerful search functionality is now at your disposal to easily navigate the content of the glossary. Try it now!
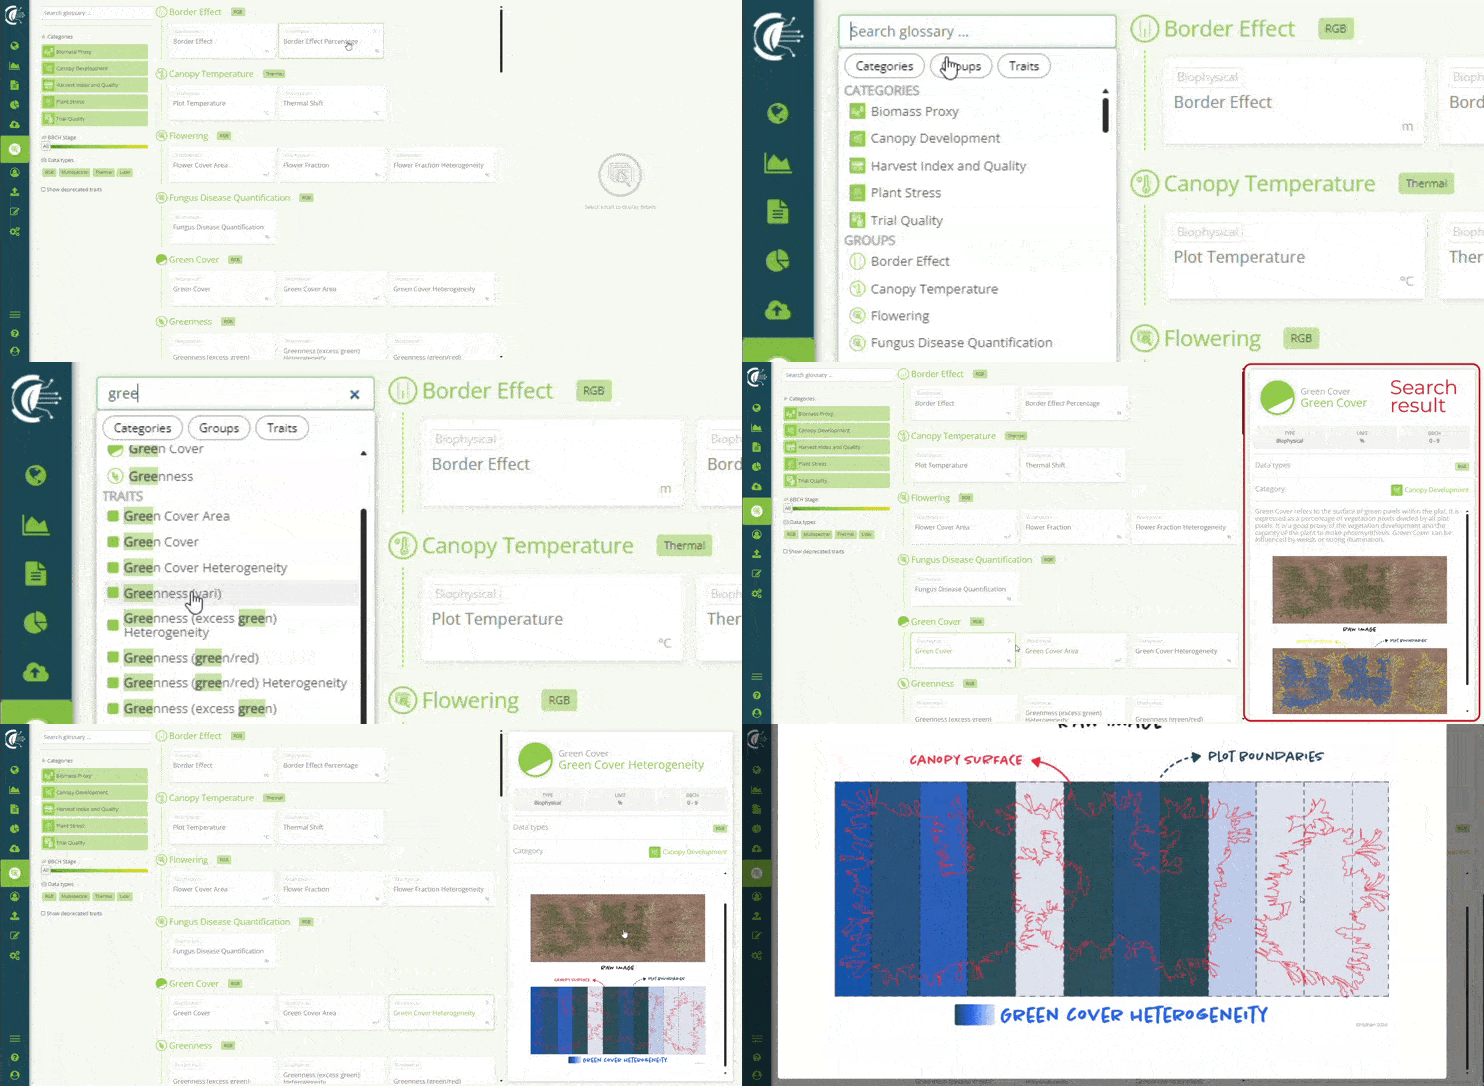
Feel free to share this open online resource, establishing the new standards in digital phenotyping methodology for Ag research, with your fellow researchers to foster discussions within the scientific community. Moreover, we invite you to regularly check out this resource to keep up to date with the latest traits available. We eagerly anticipate collecting your feedback on this new traits' glossary. Your insights are valuable as we continue to advance in the field of agricultural research.
Cloverfield's Glossary is designed to offer definitions for the traits computed by HIPHEN. Alexis Comar, PhD describes a phenotypic trait as: "A measurable characteristic of the plant or canopy. It is the result of combining raw data obtained from sensors such as cameras, lidar, spectrometers, etc., with an analytical method for interpretation. This process serves as the means to transform raw sensor data into meaningful metrics for agronomists."
We've shared previouosly on our blog a post about what is a phenotypic trait – Read it now.
Hiphen's roots are deep into crop science, which truly sets us apart in the digital phenotyping realm. We gather a decade of experience and an unwavering commitment to agricultural research to ensure that our solutions align with your objectives.
The new and improved Cloverfield Glossary is a testament to our dedication to empowering you with the tools you need to make informed decisions and optimize your agricultural practices.
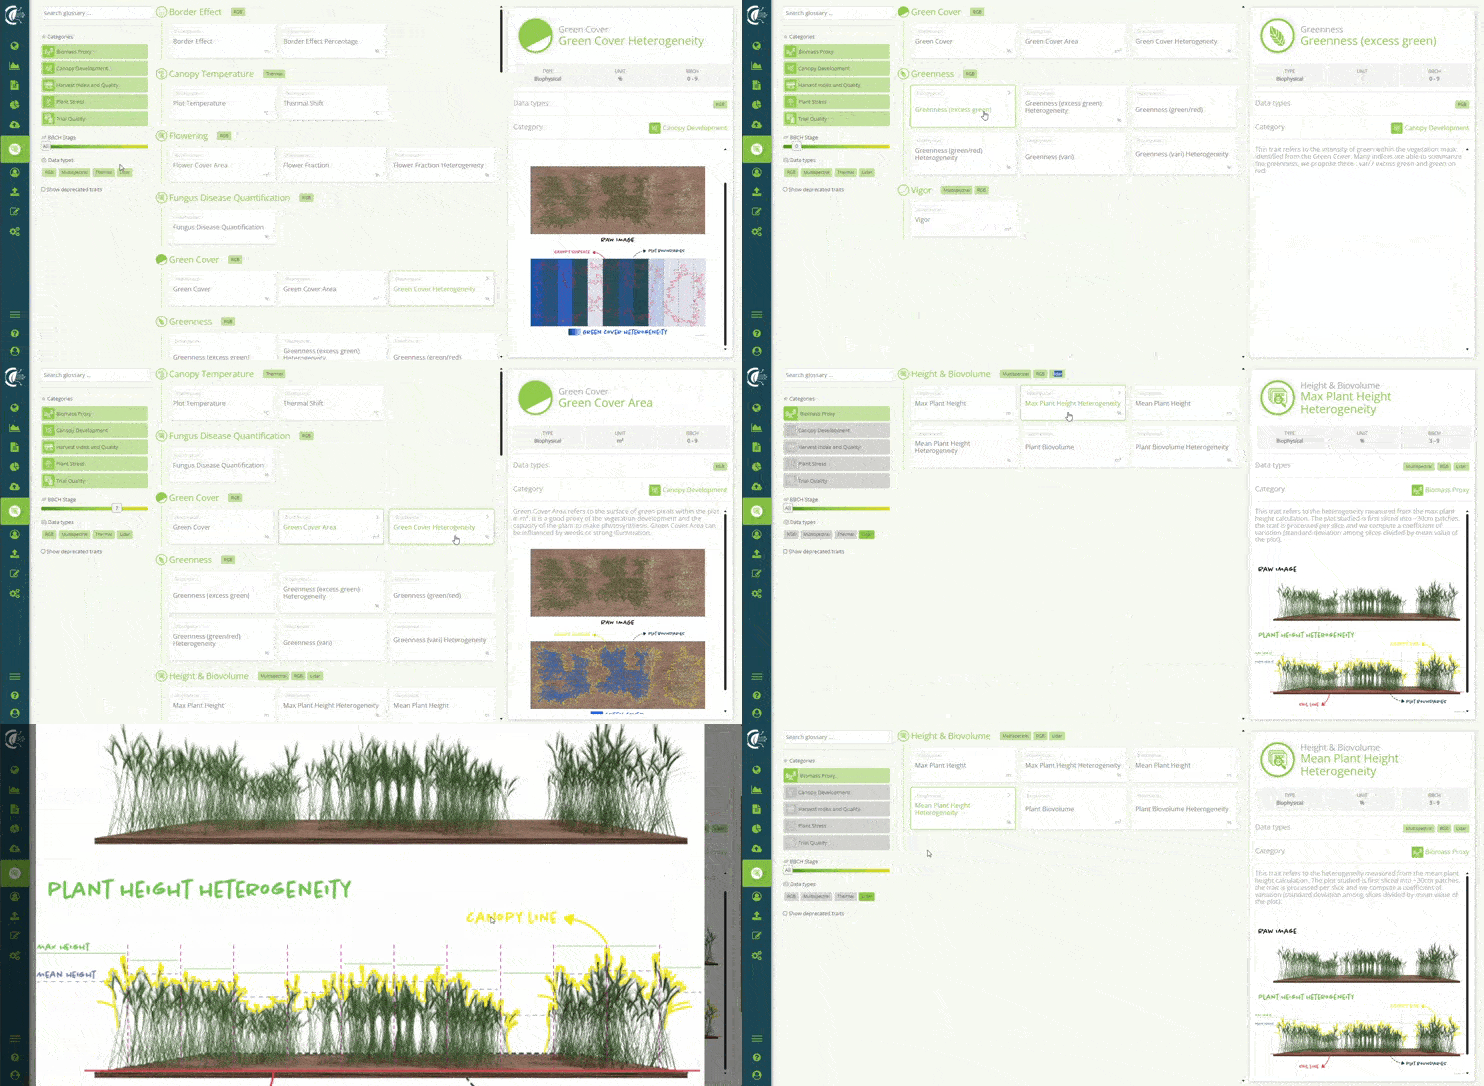
We invite you to explore the new traits' glossary and ask your Hiphen Campaign Manager should you have any question.
Stay tuned for the next Cloverfield™ features release update next April.
Sincerely,
Your Hiphen Success Team.
Cloverfield v2.8.0 – October 04th, 2023
New features have recently been added to Cloverfield™, your plant phenotyping online platform, and in this blog post we are going to take a deeper dive into those 6 new features:
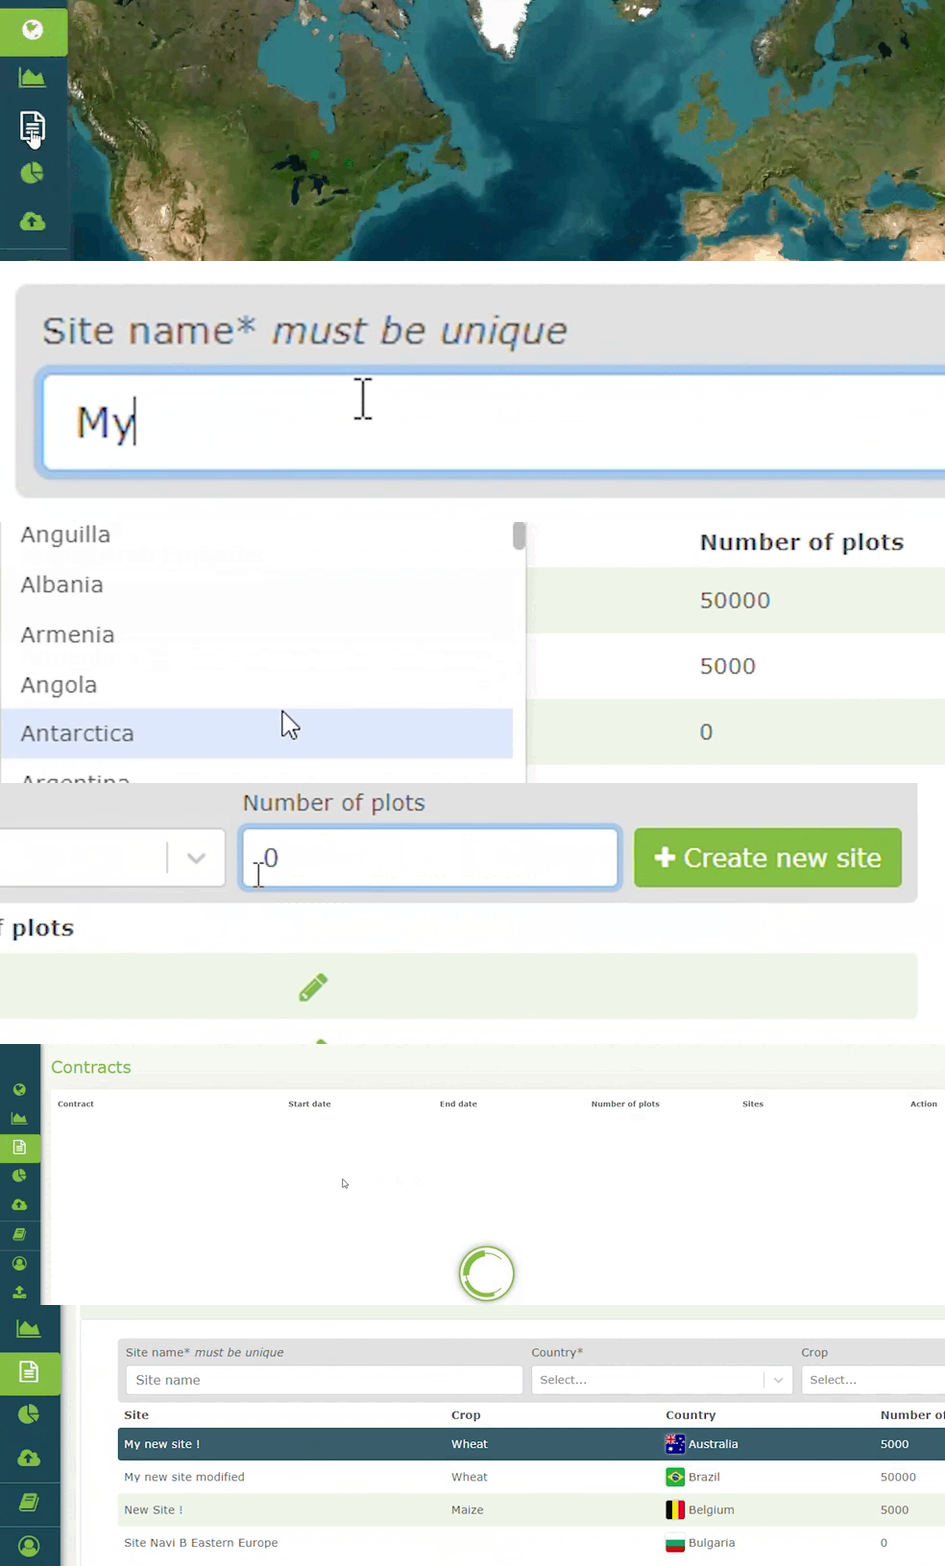
You can now autonomously manage the creation of new trial sites directly through Cloverfield™. Add a new location or change its name without having to ask your Hiphen Campaign Manager. Only accessible for users with 'Admin' rights assigned to the contract.
💎 User value: Save time and be autonomous with your campaign management.
⚙️ Use Cases:
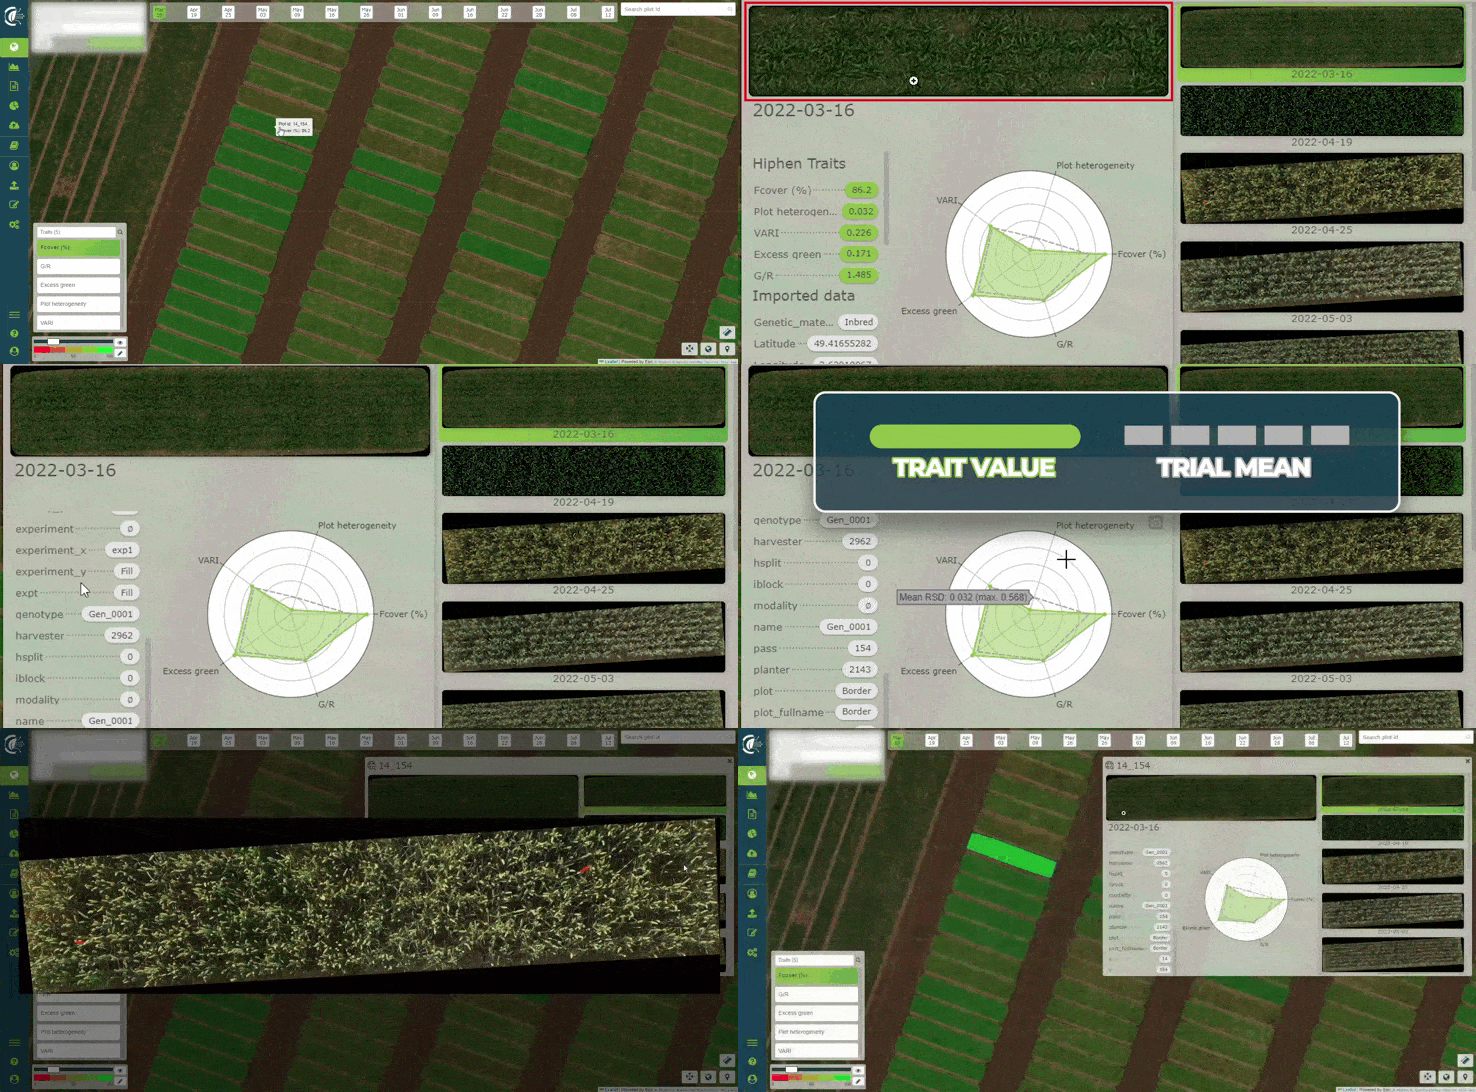
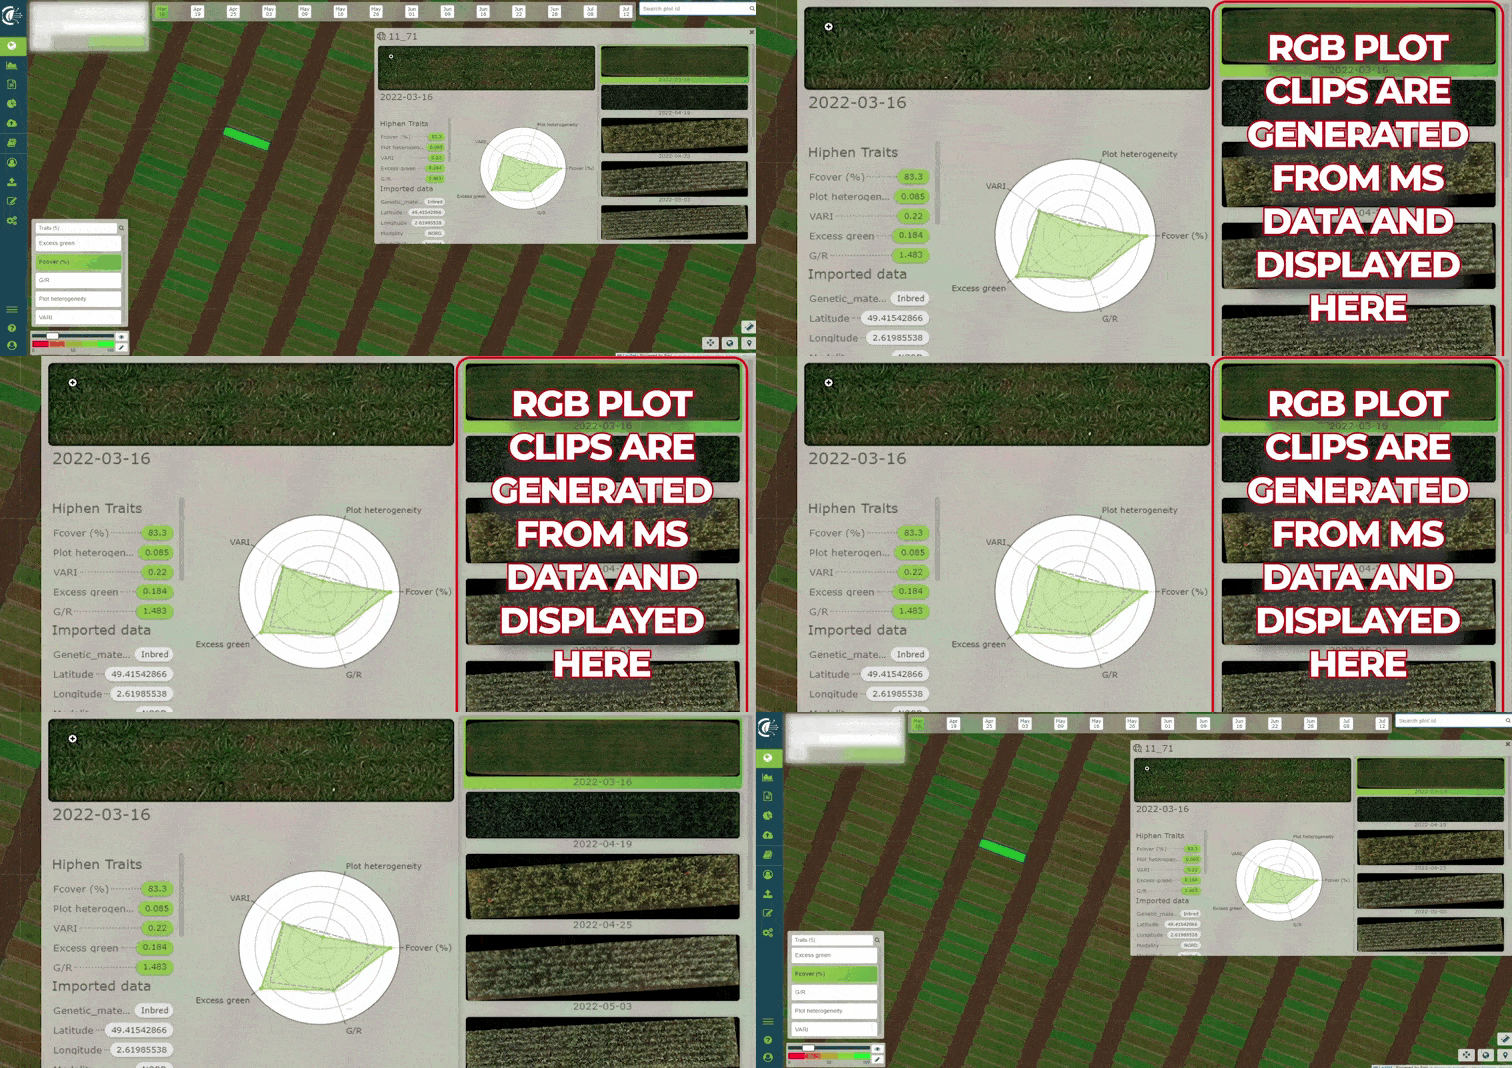
Clicking on a plot in the map view will give you access to a new window that displays next to each other the plot images from each flight. You can now efficiently visualize a single plot’s evolution through time in one click.
The new window also provides the trait results computed for the selected plot at the selected date. Finally, a new spider chart helps to efficiently assess how the plot performed versus the trial’s mean.
💎 User value: Access plot information and history at once for faster inspection and decision-making during the campaign.
⚙️ Use Cases:
For future multispectral flights, RGB plot clips will be generated from the orthomosaic and posted into the analytics tool. Just as it is the case for RGB flights, you’ll then be able to inspect multispectral plot imagery in more details directly from Cloverfield™.
**💎 User value:**Check the raw image of your plot acquired with a MS sensor.
⚙️ Use Cases:
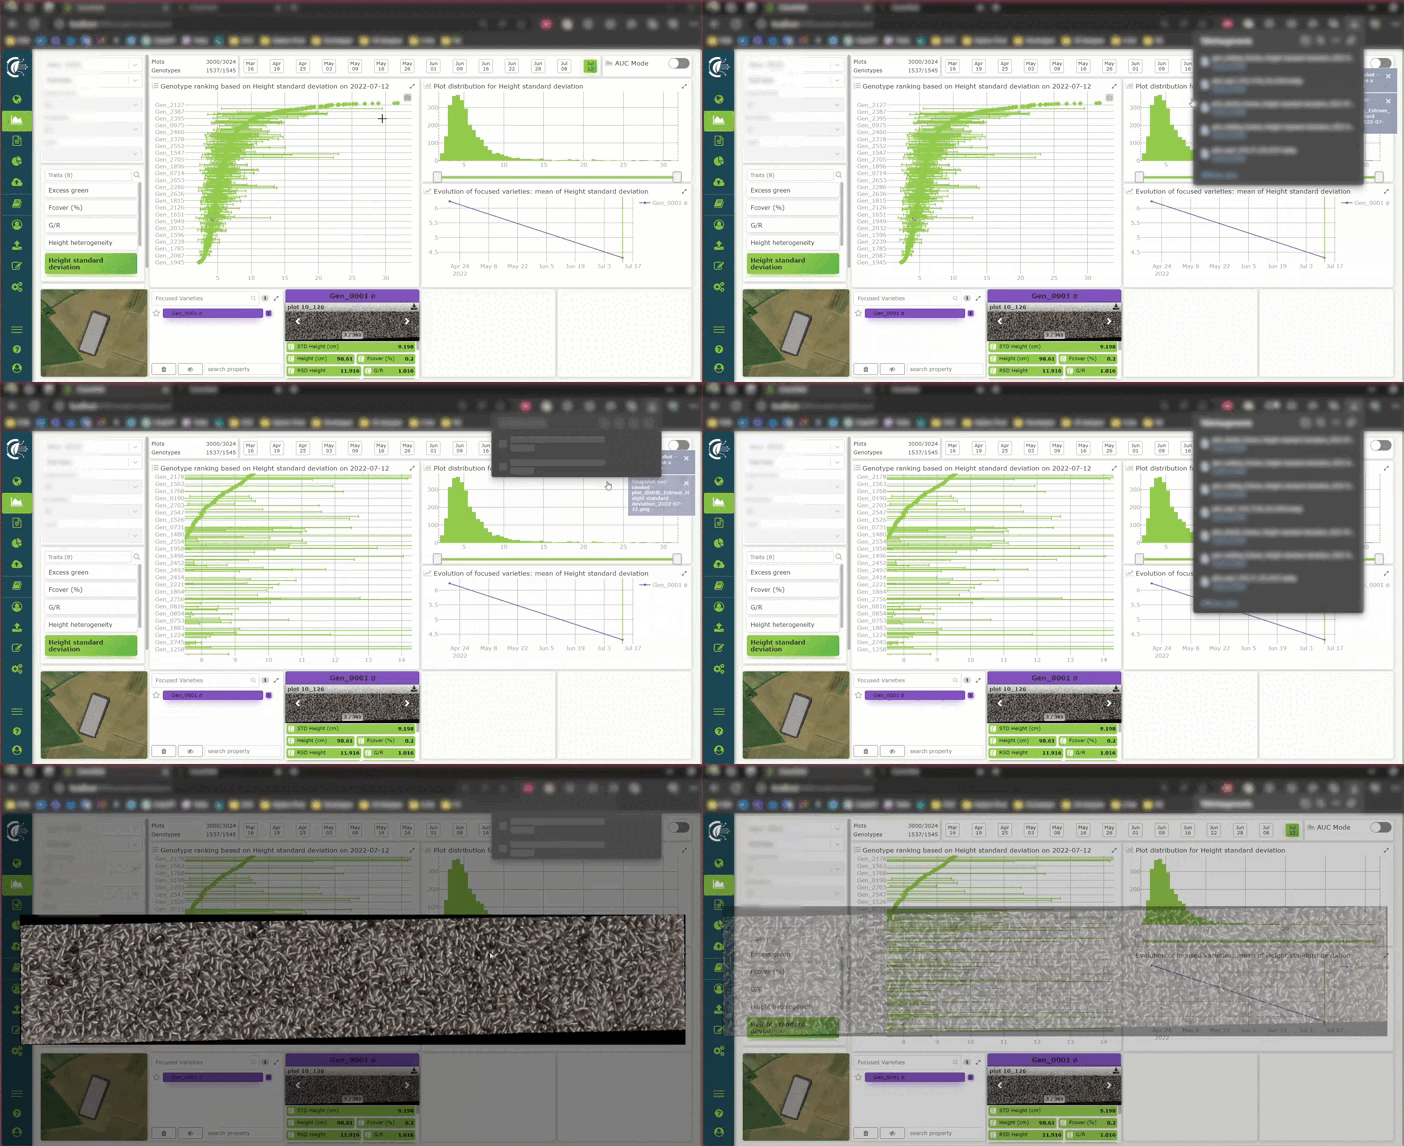
Download graphs displayed in the Analytics tool and any plot clips to insert them into your presentations and internal communication. The file format will be an image (.webp) which will following the following file naming convention: site name_date_plot name.webp.
**💎 User value:**Boost your internal communication about the results of your trial programs.
⚙️ Use Cases:
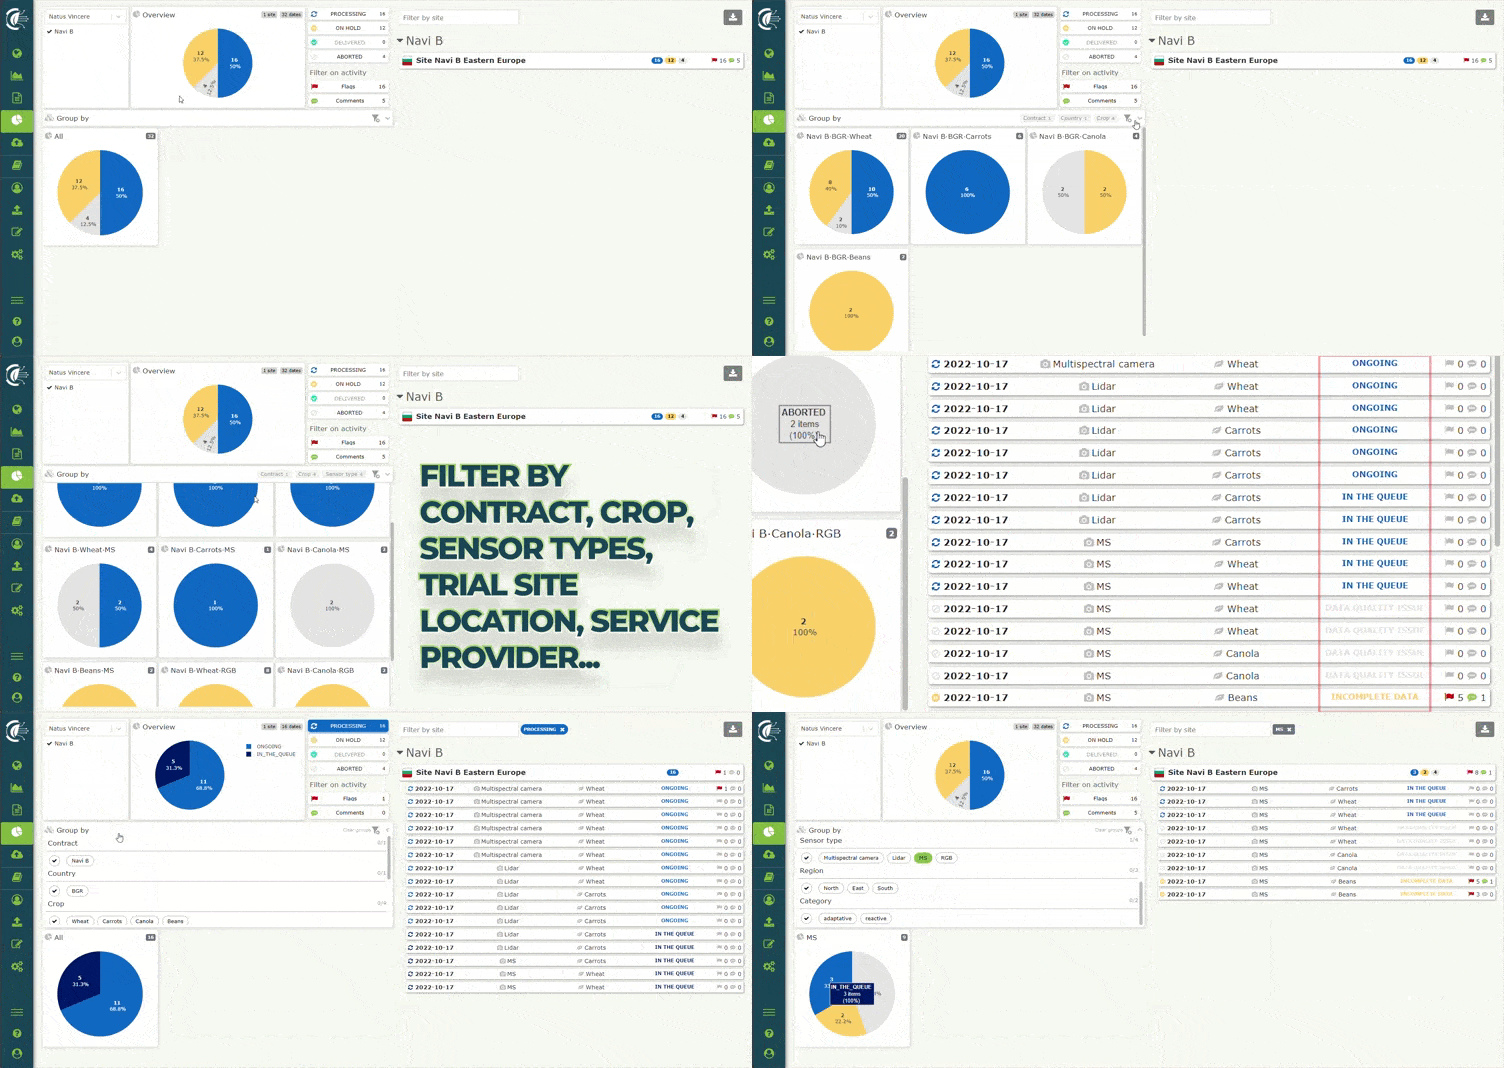
We have refreshed the design of the monitoring tool that keeps you informed of the data processing progress for each flight you upload. The page ergonomics has been improved and we added new filters based on your feedback. You can now group specific filters to get a more granular and custom progress tracking update. Filters include campaign, region, country, crop and sensor type.
You can also filter flags and comments posted by your Hiphen Campaign Manager in a more intuitive manner. This allows you to very efficiently focus on datasets that require your attention.
💎 User value: Get all the transparency you need about data processing progress, pinpoint flights that require attention and use this tracking tool for your own internal reporting.
⚙️ Use Cases:
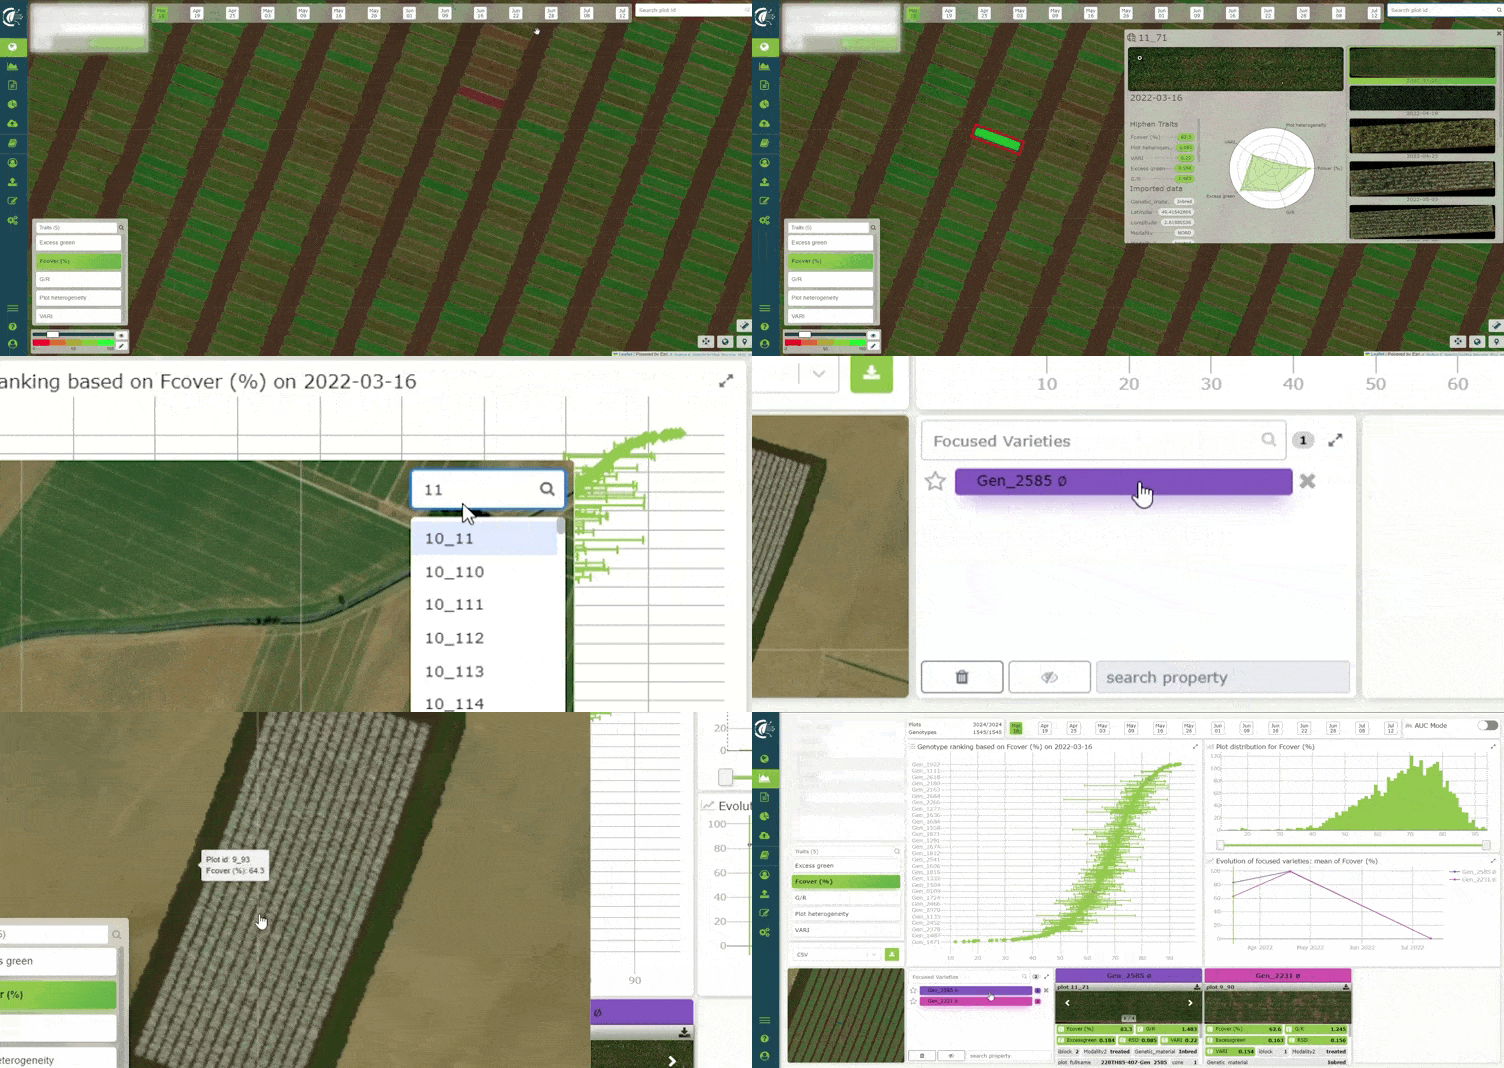
In the map and analytics pages, at the top right corner of the map, enter a specific plot name in the search bar to pinpoint its position on the plot map and select it.
Once the search bar is used, we will automatically suggest you to add the plot of interest to the 'plot exploration' section of the analytics page.
**💎 User value:**Save time exploring specific plots of interest.
⚙️ Use Cases:
For more information, reach out to your Hiphen Campaign Manager. Stay tuned for the next Cloverfield™ features release update next month.
Sincerely, Your Hiphen Success Team.
In modern agriculture, the utilization of advanced technologies has transformed the way researchers and producers monitor and manage their crops. Drones and satellites have emerged as two powerful devices, offering numerous advantages to agri-businesses, ranging from territory surveillance to mapping and crop health assessment.
Aerial imagery collected through these systems provides valuable insights by capturing data from the sky, enabling reserachers and farmers to make informed decisions and optimize their agricultural production. In the last decades, drone and satellite imagery has brought about significant improvements in large-scale crop monitoring across the agricultural sector.
In this post, we will explore and contrast the use of drone and satellite image analytics for monitoring agricultural production, highlighting their respective strengths and differences, and showing how they can combine together.
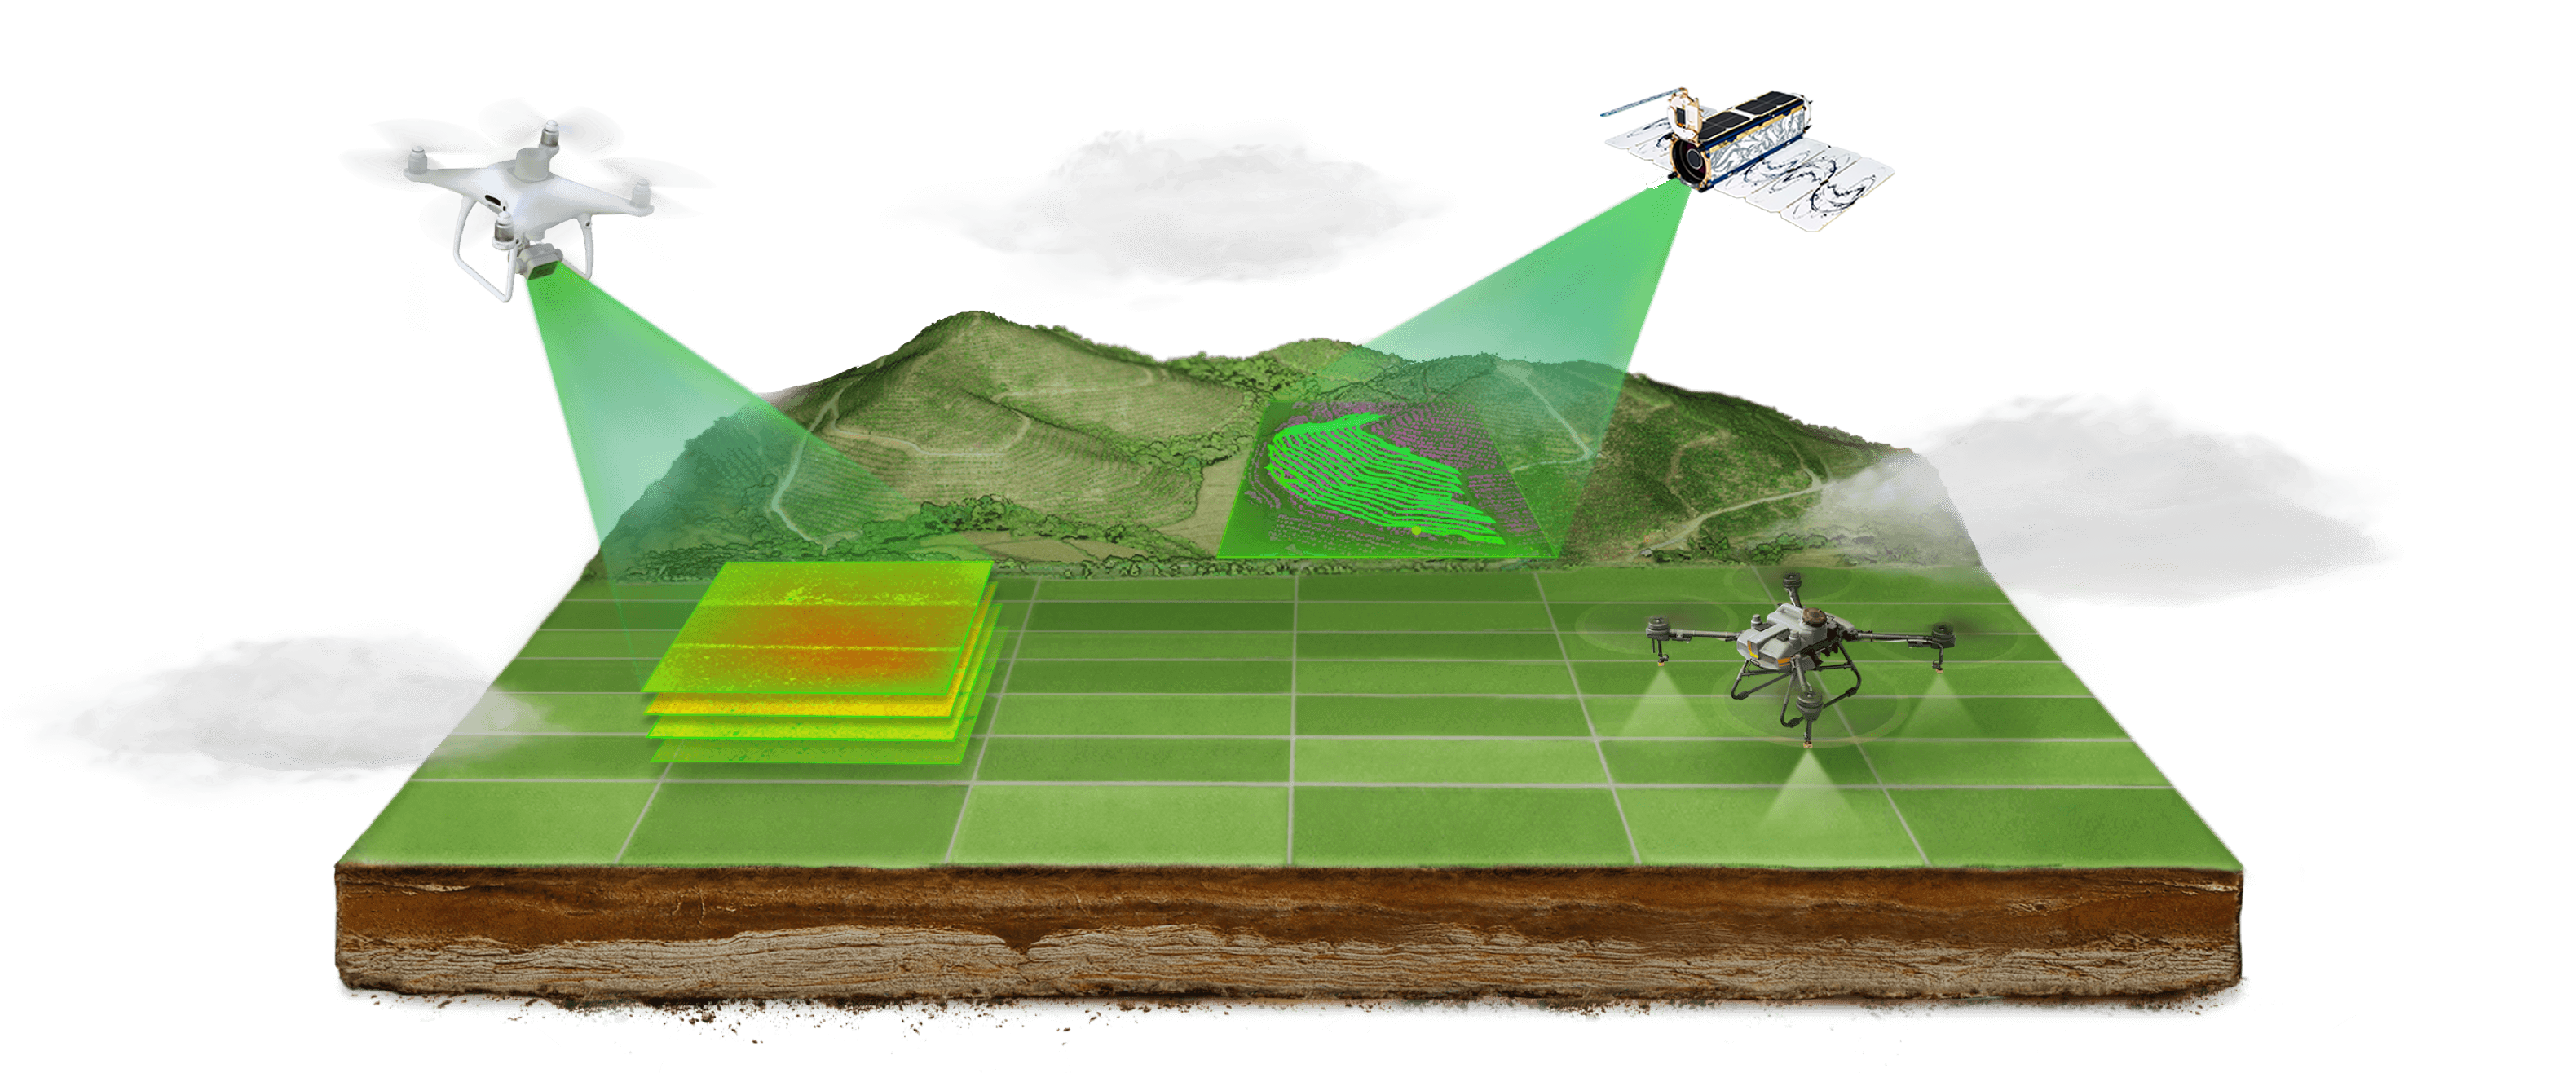
Drone and Sentinel 2 Satellite flying above agricultural land.
Drones, on the first hand, also known as Unmanned Aerial Vehicles (UAVs), are small remote-controlled aircraft equipped with high-resolution cameras and other sensors like multispectral cameras or 3D sensor (LiDAR). They can fly at various altitudes and capture detailed imagery of agricultural fields and research trials. Drones offer flexibility and precision, as they can be deployed on-demand and they can fly over specific areas of interest in a fairly short period of time thanks to their portability and lightness.
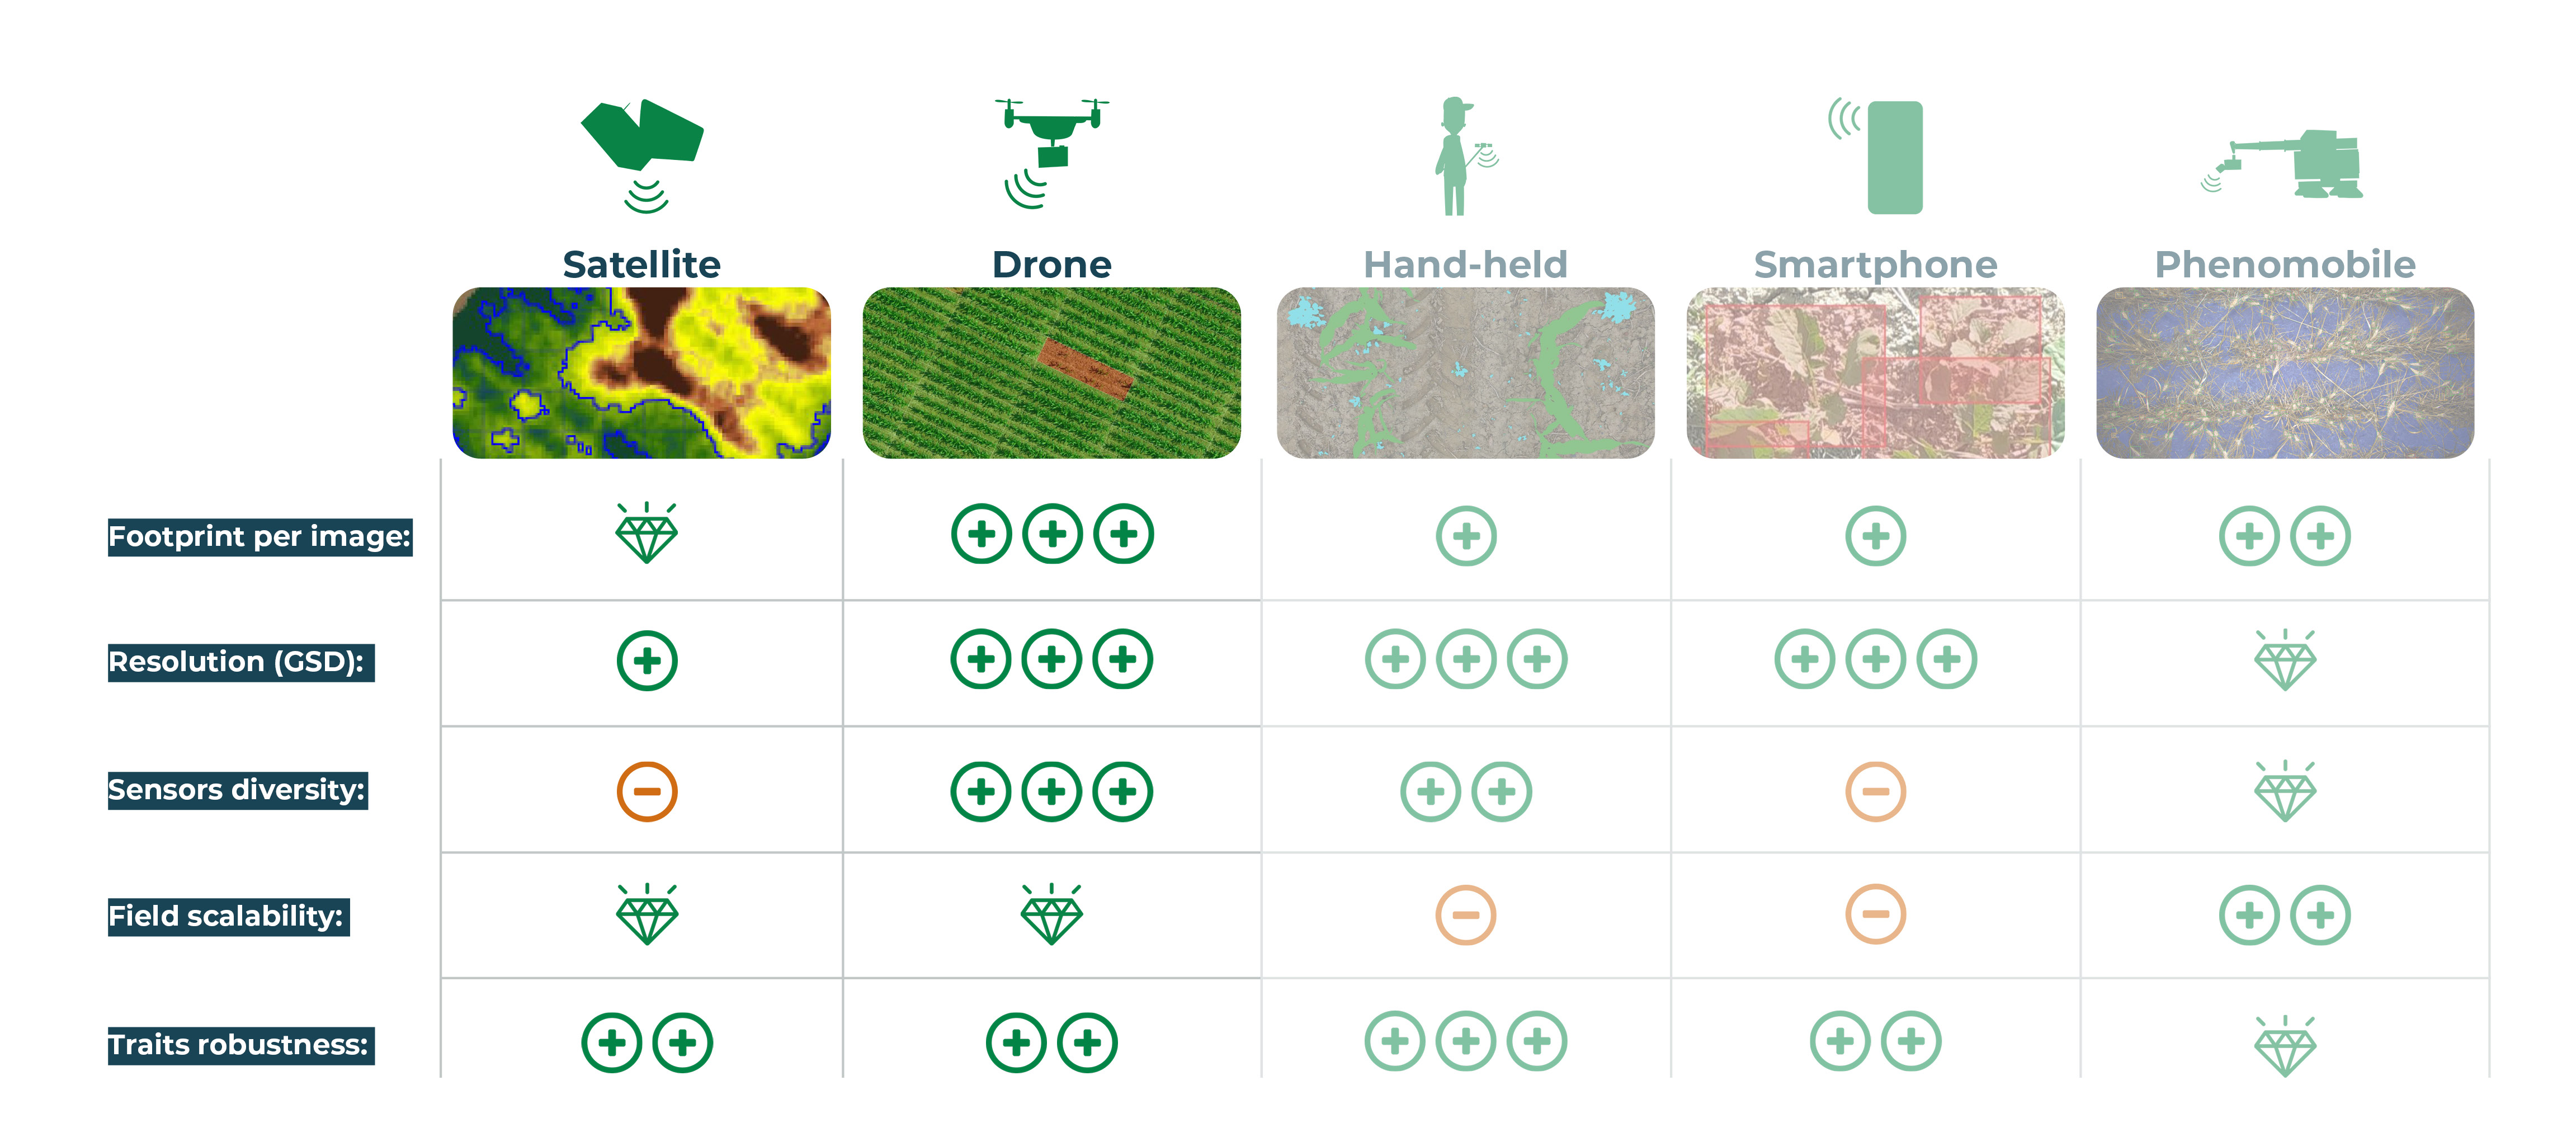
Table comparing the imaging specs of each system for phenotyping applications.
Satellites, on the other hand, are orbiting spacecraft that continuously capture images of the Earth's surface. Satellites are equipped with powerful sensors too, even if they usually are compatible with fewer sensor types (no 3D sensors yet for instance). The high-resolution equipment enable satellites to provide wide-scale coverage and monitor large agricultural regions from high altitudes. Satellites offer the advantage of regular and systematic data acquisition, allowing for consistent monitoring of crops over time.
Drone and satellite imagery has brought about significant improvements in large-scale crop monitoring across the agricultural sector; however, they differ in several key aspects:
These devices are different in their specifications but also in the assessment that they can give access to. Indeed, the sensors from a Satellite cannot capture the same thing as a Drone camera would since the proximity with the canopy and the sensor resolution are not the same, and in digital phenotyping, those parameters prevail while looking for research-grade plant assessments with deep granularity (like organ counting and classification or disease assessments for instance). But there are some traits that both devices can capture, like NDVI for example which is a vegetation index useful to estimate Vigor and Biomass, and in that case, creating data fusion with both devices and sensors helps accessing precise assessments that will give insights at different scales such as the field scale, the plot scale and even the plant scale when using high-resolution sensors.
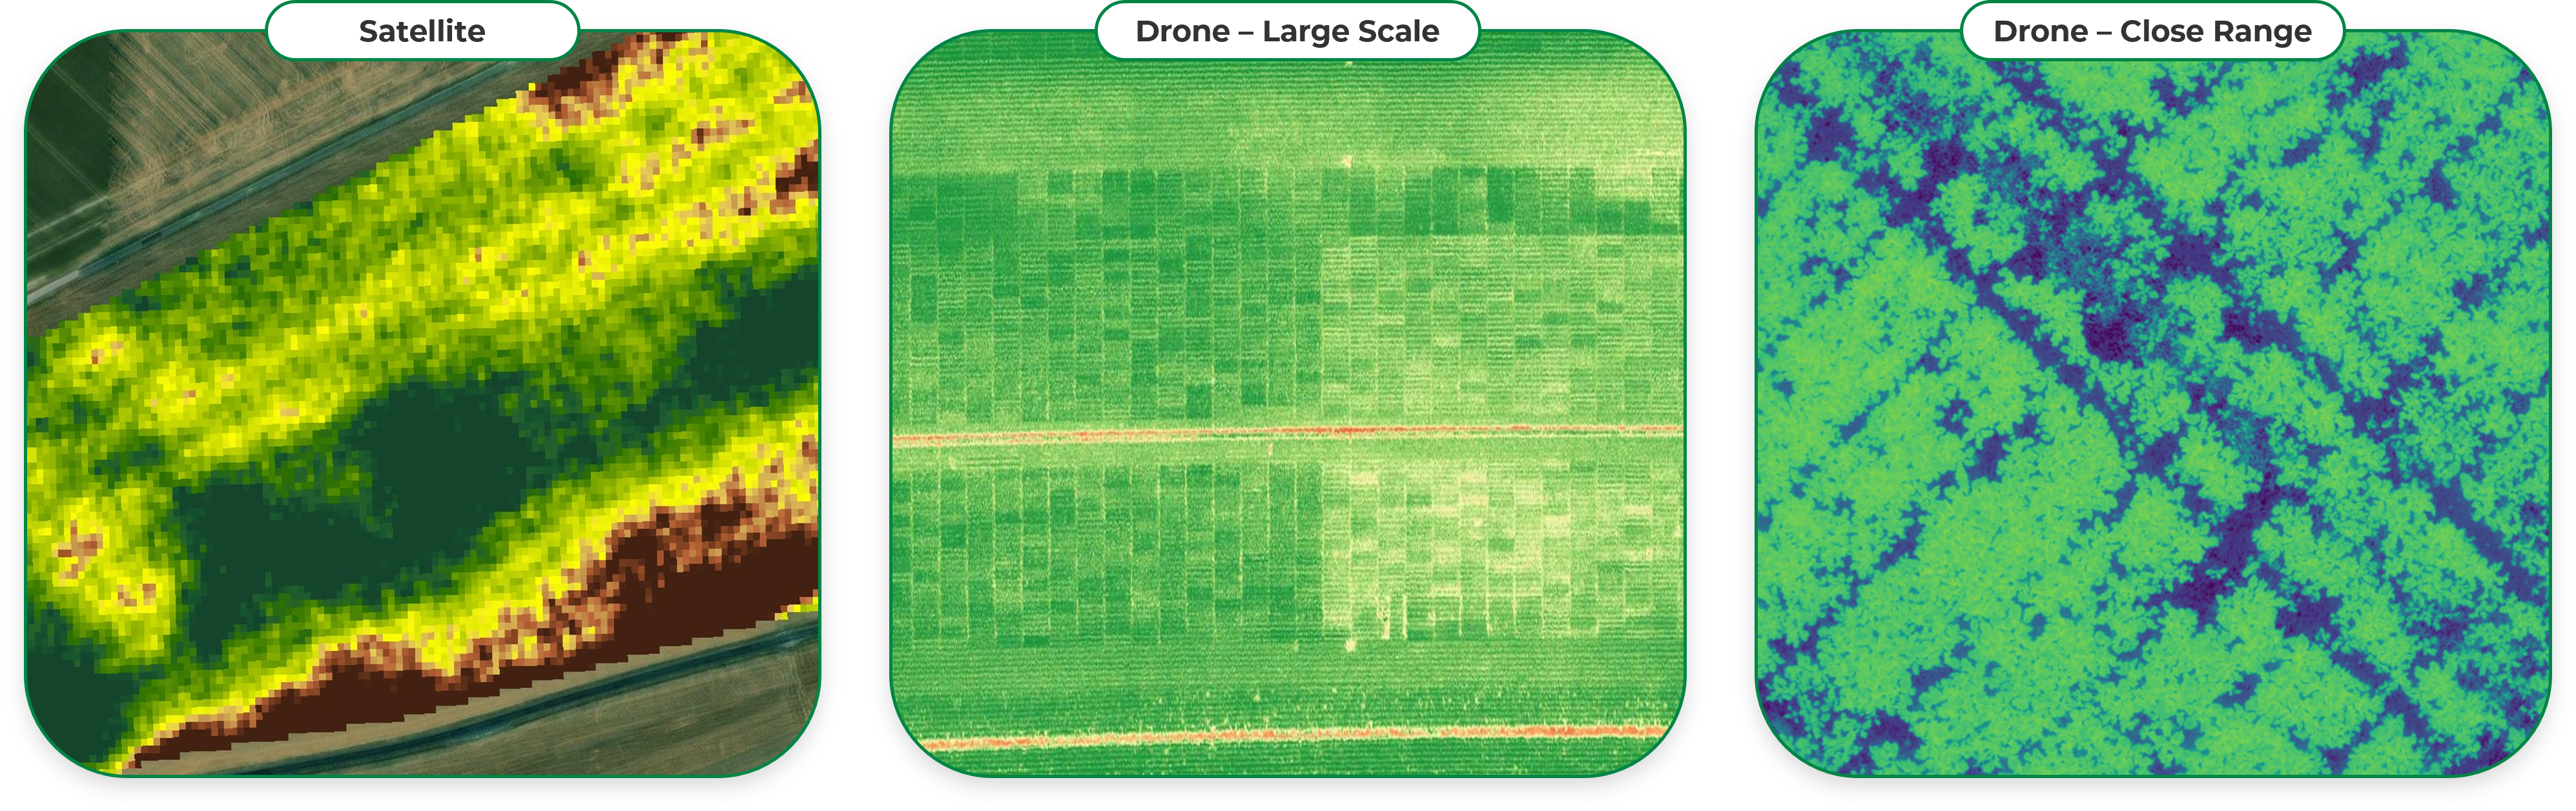
NDVI assessment from Satellite and Drone at different scales, giving access to various granularity of information.
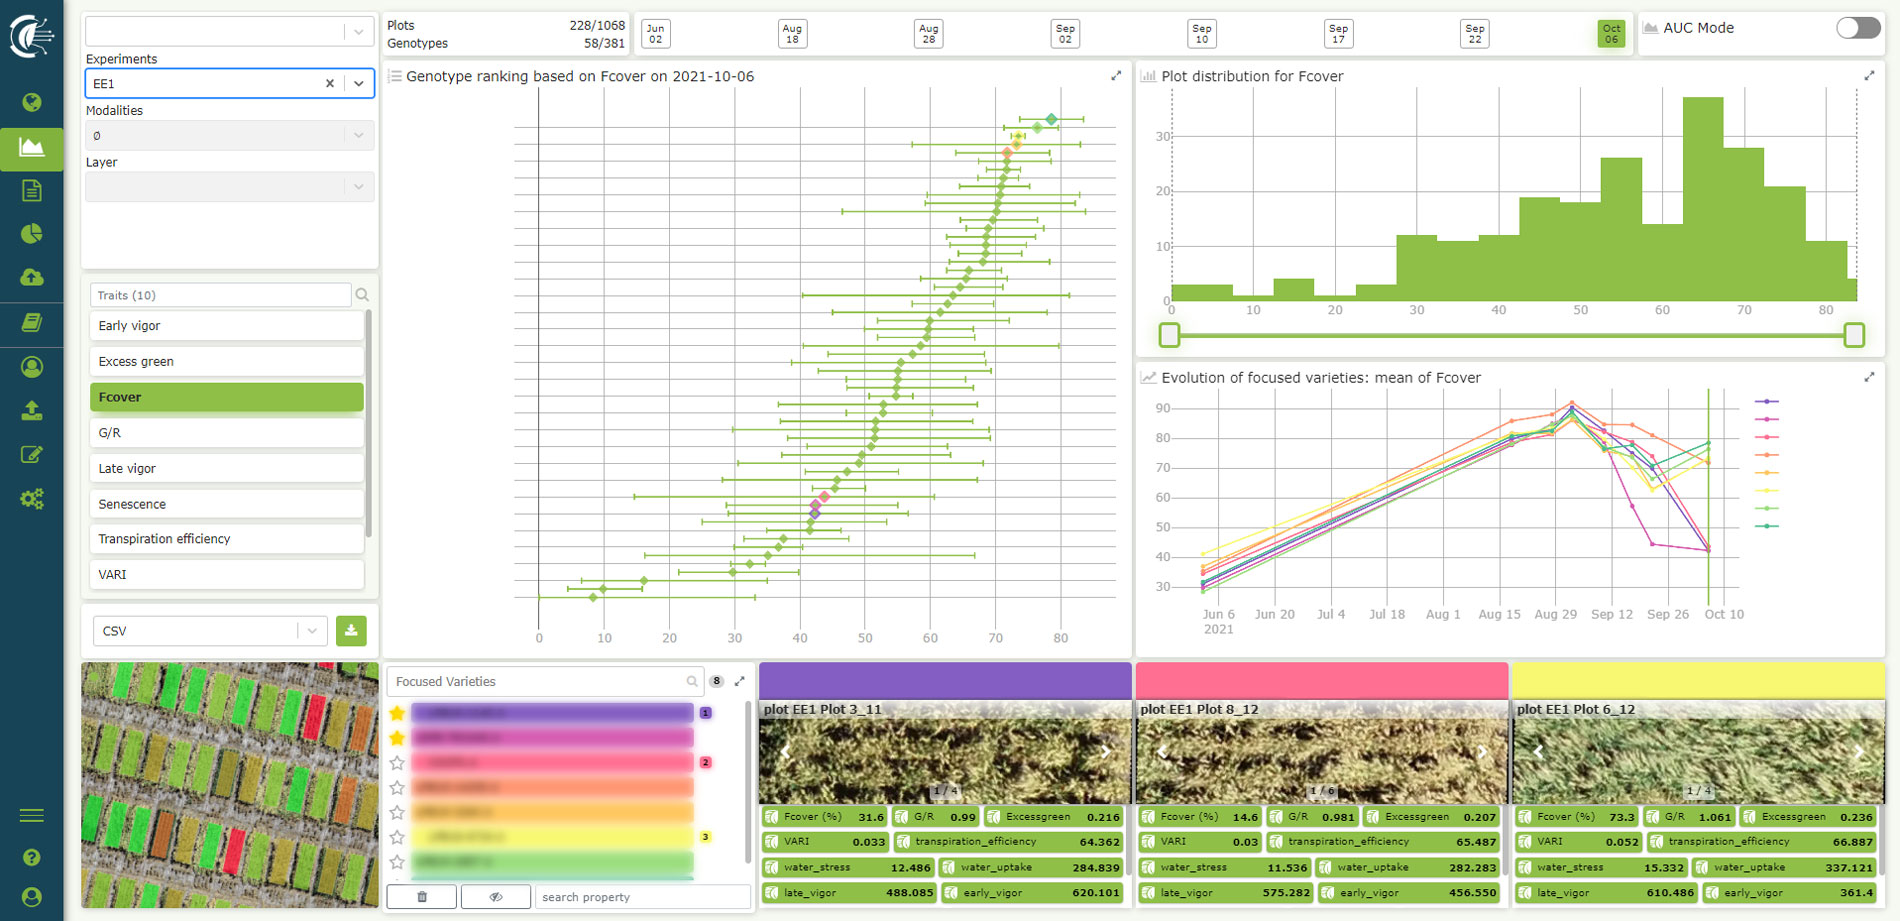
You can browse your plant traits values easily and intuitively in Hiphen's Cloverfield™.
In conclusion, drones and satellites have become indispensable tools for monitoring agricultural production. While drones excel in providing high-resolution, near real-time data for small to large plot trials assessments, satellites offer broader coverage and long-term monitoring capabilities for large-scale agricultural regions. Both options have unique value for plant phenotyping and as usual, the way you should pick either one or the other or both, should be driven by the assessments and outputs you wish to get, and by your field trial and project specifications as mentioned in the text above. By leveraging the strengths of both drone and satellite image analytics, agricultural researchers can make improved data-driven decisions, based on valuable phenotypic data and analytics, to optimize crop management practices and improve seed breeding and agricultural production globally.
Grab a time from one of our experts' Calendar to discover more.
Sincerely,
Your Hiphen Team.
Topic delivered by Patrizia ZAMBERLETTI – Imaging Solutions Specialist @Hiphen.
In this second webinar, Alexis Comar (Founder and CEO at Hiphen) meets with Rachel Maire (Sales Lead at Planet) to discuss how the Hiphen-Planet satellite solution offers great opportunities for plant breeders, farming companies, cooperatives, and other agro-industrial actors.
The webinar covers three main use cases:
We hope that you enjoy this webinar and, as always, do not hesitate to get in touch with us should you have any questions or require any assistance with your plant phenotyping and crop monitoring projects.
Hiphen is proud to announce the launch of its partnership with Planet Labs, a leading satellite imagery provider with whom we are looking to enhance the range of solutions available to the agriculture sector – from plant breeders to farmers, cooperatives and agro-industrial actors.
Planet has launched satellite constellations such as PlanetScope (2009) and SkySat (2014) that today encompass more than 150 satellites in orbit that are able to image anywhere on Earth daily at 3 meter and 72 centimeter resolution. Using Planet's API and online tools, you can access 360M+ sq km of daily imagery to monitor extensive and distributed areas of interest (AOI), and analyze trends with PlanetScope and SkySat archives.
Planet believes that space can help life on earth. Today's agriculture falls into this vision and we are making change visible thanks our near daily imagery. Hiphen's applications and expertise can leverage this information into valuable insights at the speed of change. As such Hiphen has developed robust methods to deliver daily field imagery by constantly seeking means to merge satellite imagery with sensors and with the latest advancement in crop science in order to deliver always greater value to all players across the agri-sector.
Through this partnership, both companies can leverage their technology and expertise to provide a new dimension to precision agriculture applications – that so far where essentially relying on legacy methods and tools such as Sentinel-2 (with a 10 meter resolution, and a 5-days revisit frequency). While Sentinel-2 remains a valuable asset to the agriculture sector, at Hiphen we believe that the information that we can deliver with Planet is set to augment and improve these methods – adding value to many actors in the sector and opening new perspectives to academics.
On November 7th 2019, Hiphen and Planet will be hosting a webinar that we encourage you to join to hear about the advantages behind this partnership and ask any burning questions. At this event, we will notably cover some of the hot use cases that we believe will change the game, notably explaining how plant breeders can leverage the Hiphen-Planet solution to monitor field experiments, or how we can help to improve support management tools for agro-industrial actors.
We look forward to answering your questions at this webinar.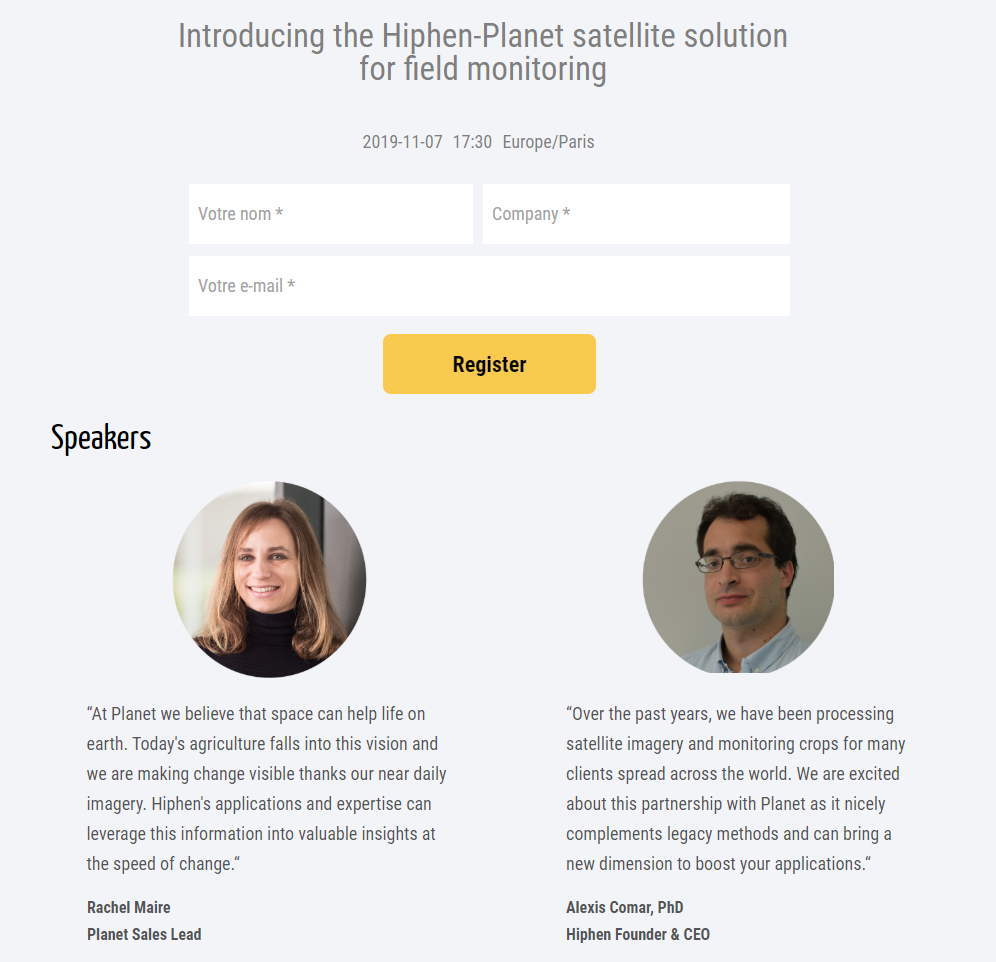
In this episode of a series of CAPTE videos, Alexis and Wenjuan from Hiphen discuss the value behind the fusion of satellite and IOT data.
Wenjuan notably explains that data fusion allows us to provide daily satellite imagery of the fields during the entire crop growing season. This is particularly important for farmers who want to monitor their fields in near real-time in order to best manage their crops – especially during key phenological stages.
Satellite imagery from Sentinel-2 is typically available every five days, unless clouds are present in which case you could have several weeks without data. This issue makes you 'data blind' during this period, which might be okay if you monitor a handful of fields located in the same region, but definitely not acceptable if you have to monitor hundreds of large fields spread across one (or more) country.
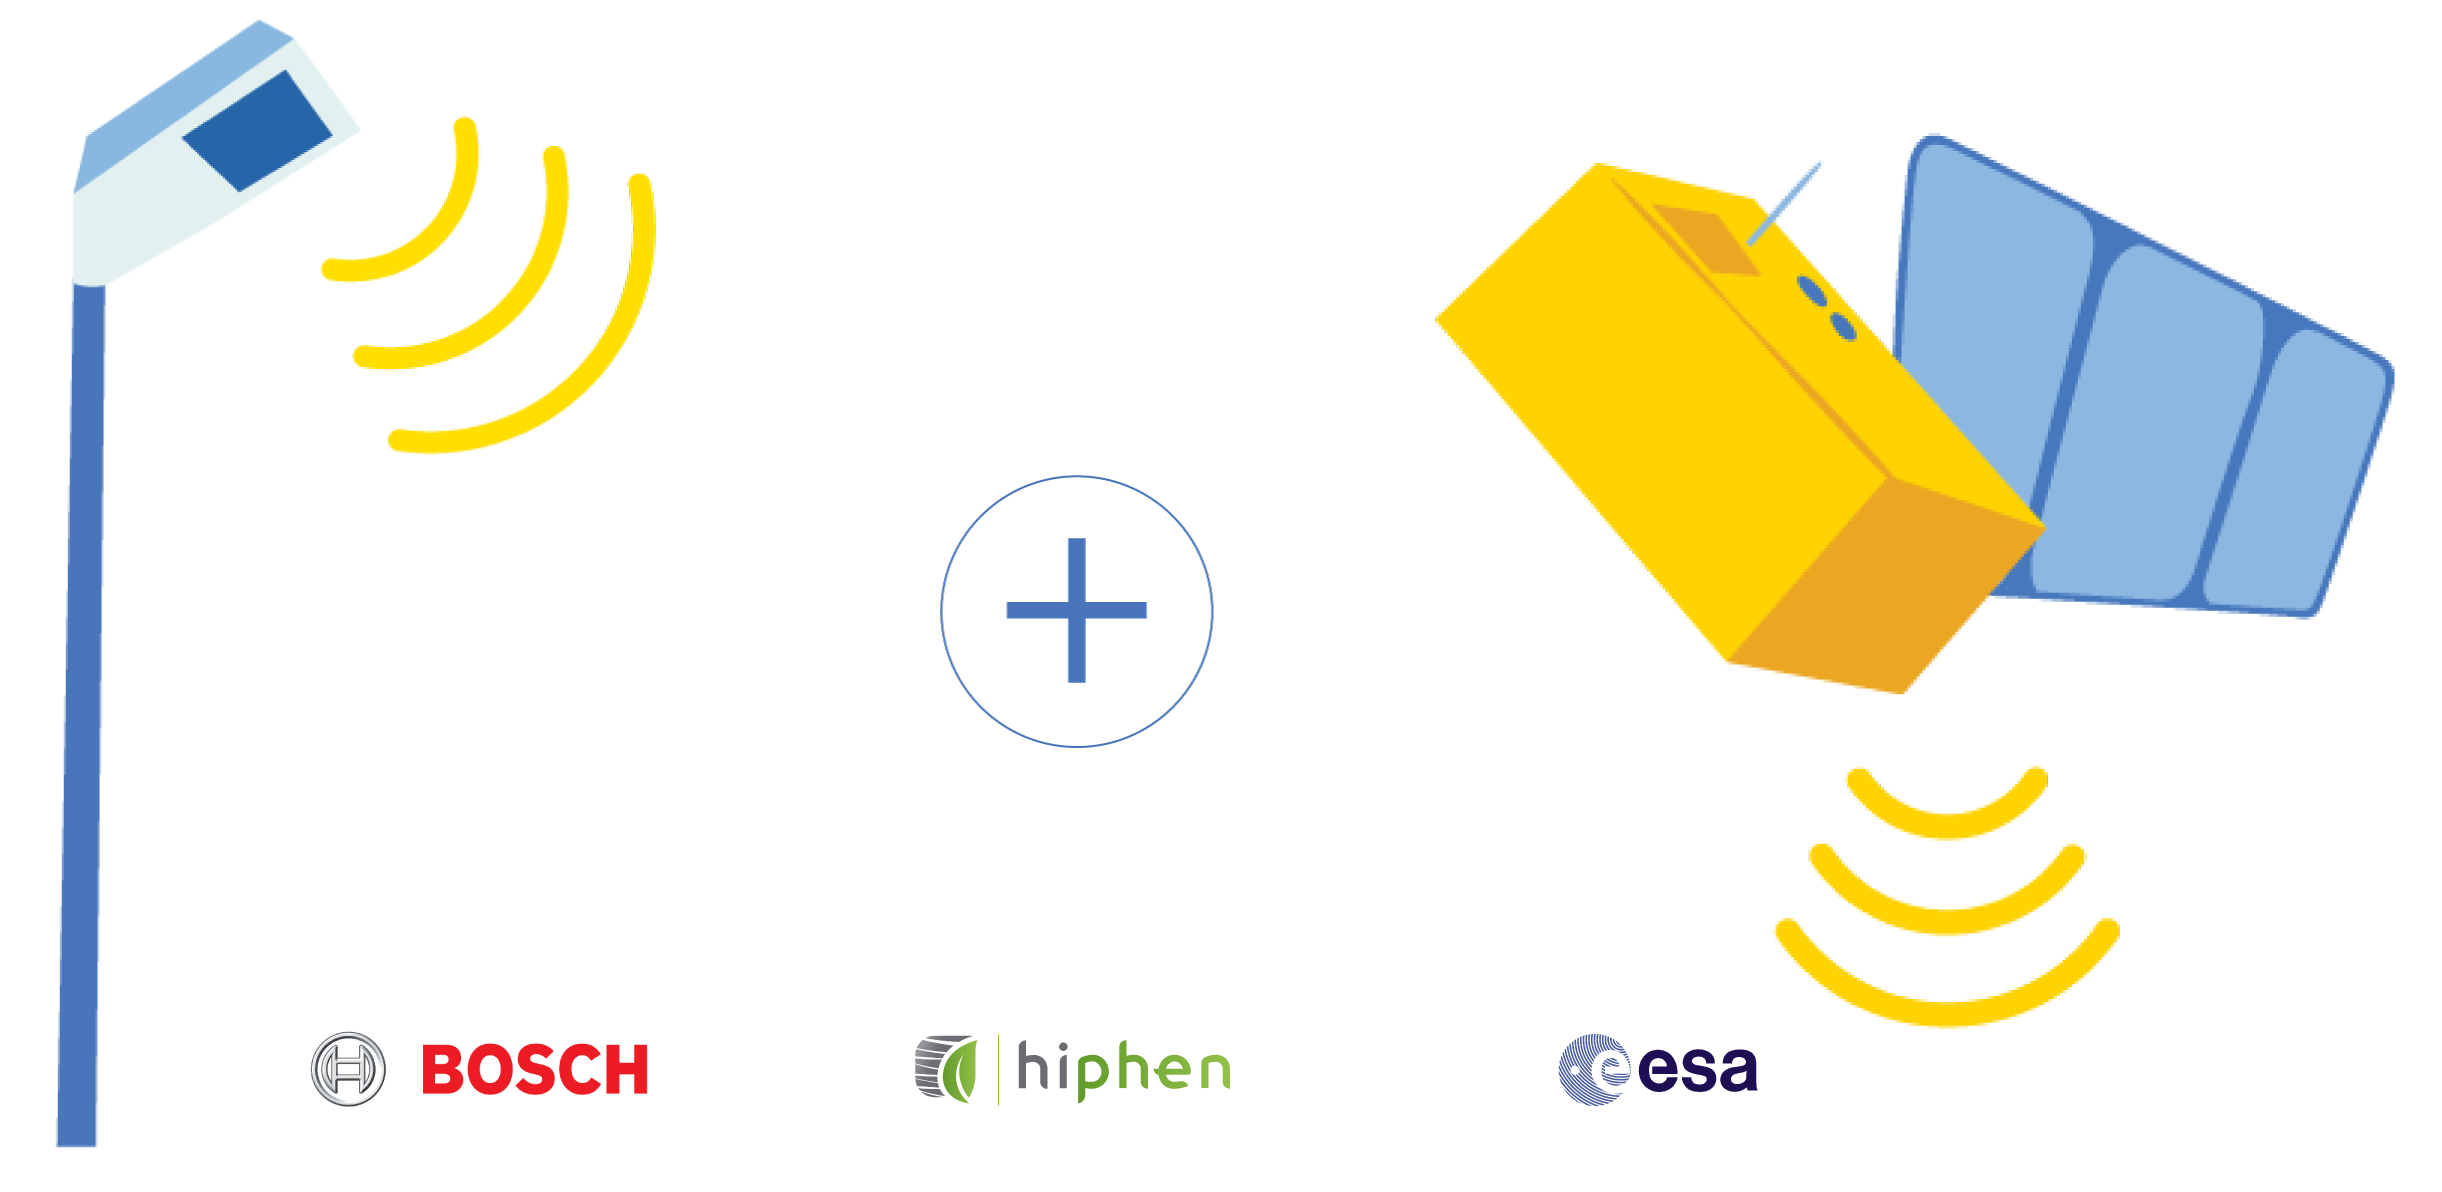
To fill in the data gaps for the periods where clouds made us 'data blind' we use IOT Field Sensors manufactured by Bosch in order to get a real-time eye in the field. The IOT sensors are placed in strategic stationary locations in the field (dependent on the pre-study of the field heterogeneity), and these IOT data inputs are extrapolated to be spatialized at the entire field level using satellite data. Thus, delivering a daily map of the fields.
Several biophysical indicators can be derived such as Leaf Area Index, NDVI (a proxy linked to the quantity of vegetation), CIgreen (a proxy of chlorophyll content) and others. The direct inputs from the satellite-IOT data fusion are then used for different applications ranging from crop management (fertilization, irrigation), yield assessments, and early warning systems inclusive of disease symptoms detection and phenologycal events detection.
As always, we would be delighted to tell you more about this type of solution and how they could potentially fit your agtech strategy. We look forward to hearing from you.