
Our products
Backoffice
A Vegetation Index is a single value calculated by transforming the observations from multiple spectral bands. It is used to enhance the presence of green, vegetation features and thus help to distinguish them from the other objects present in the image. Depending on the transformation method and the spectral bands used, different aspects pertaining to the vegetation cover in the image could be evaluated say, the percentage of vegetation cover, amount of chlorophyll content, leaf area index and so on.
All the ratio indexes, in general, are independent of the illumination conditions at the time of acquisition and slope effects.
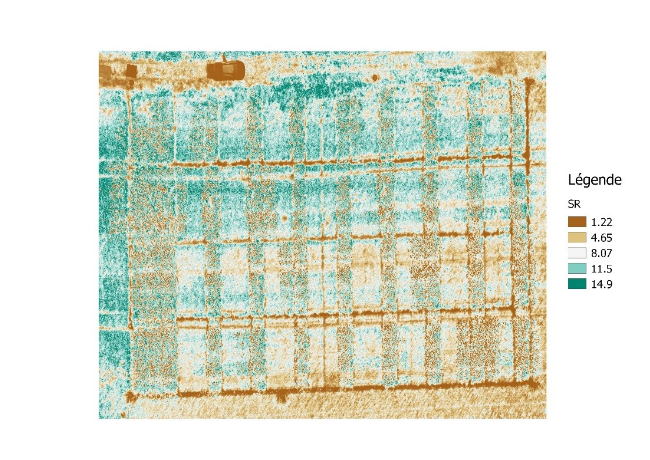
This is the simplest VI which is a ratio between the reflectance recorded in the Near Infra-Red (NIR) and Red bands. This is a quick way to distinguish green leaves from other objects in the scene and estimate the relative biomass present in the image. Also, this value may be very useful in distinguishing stressed vegetation from non-stressed areas.
Simple Ratio = ρNIR / ρRed = ρ850 / ρ675
According to the spectral signature of green leaves, they exhibit very low reflectance in the Red and Blue regions (leaves reflect more in the green region and hence appear green). However, the reflectance is relatively higher in the NIR region. Thus, the SR value is close to 1 when the object has similar reflectance in both Red and NIR bands – for example, soil. Whereas, for a green object the value would be much greater than 1.
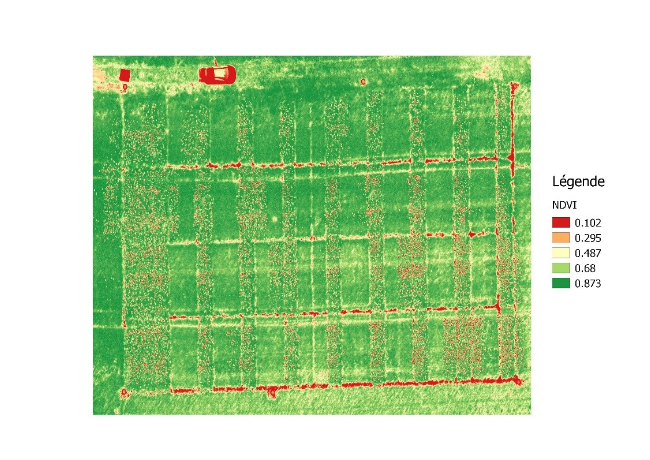
This is one of the most commonly used method for monitoring the percentage of green cover in an area. Since it is a ratio, this index is invariant to the difference in illumination conditions, slope, seasons, etc. and thus suitable for crop monitoring throughout the growth season. It is calculated by taking a ratio between the difference of reflectance from NIR and Red bands and the sum of reflectance from NIR and Red bands.
NDVI = (ρNIR-ρRed) / (ρNIR+ρRed) = (ρ850-ρ675) / (ρ850+ρ675)
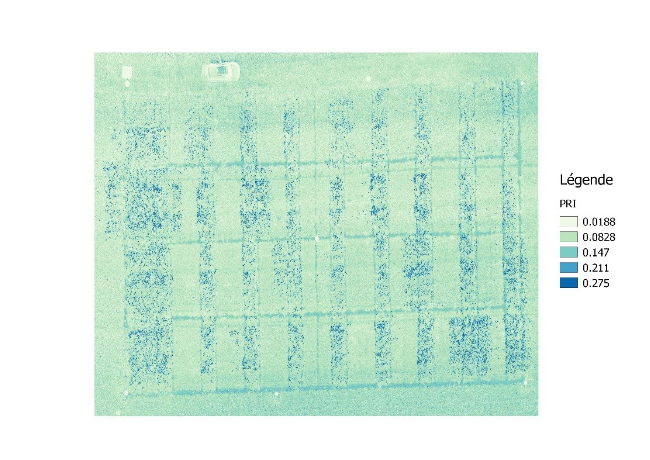
The Photochemical Reflectance Index is a measure of the light-use efficiency of foliage and thus is primarily used as an indicator of water stress and for the assessment of carbon-dioxide uptake by plants.
PRI = (ρ570-ρ530) / (ρ570+ρ530)
It is sensitive to the variations in the carotenoid pigments (for example, xanthophyll) in the leaves. These carotenoid pigments are involved in converting the absorbed photosynthetic radiation into fixed carbon.
If you want to know more about vegetations indices, take a look at our article about Vegetation Indices on Chlorophyll Content !
At Hiphen, we dedicated the past five years to developing innovative methods for plant health measurements and give life to game-changing industrial solutions. Today, we are proud to see Hiphen and Moët Hennessy savoir-faire teaming up to keep making each grape and berry count.
The technology we deployed involves robotics and advanced Deep Learning techniques that can detect the presence of diseases, such as Botrytis, in each crate of grape flowing through the supply chain during harvest. The algorithms we developed therefore provides a quality indicator to each crate of grape and can assist Moët Hennessy experts during the sorting of the grapes at the wine press facilities.
We've made a specific webinar on this topic, so check it out to find out all about this initiative and have the opportunity to ask questions about our AI solution, the Deep Learning techniques we used, and how this type of technology has found its place in Moët Hennessy's unequaled winemaking savoir-faire.
To better understand the vegetation indices for Chlorophyll, we need to take a few moment to introduce you to Chlorophyll. In fact, as you may already know, Chlorophyll is the green pigment present in the leaves and plays an important role in photosynthesis i.e. conversion of light energy to chemical energy. Hence, it is a direct indicator of the plant's primary production and photosynthetic potential. It can be also used to understand the plant's nutrient status, senescence and stress due to water, disease outbreak, etc. Several indices have been developed to estimate the chlorophyll content of the leaves as follows:
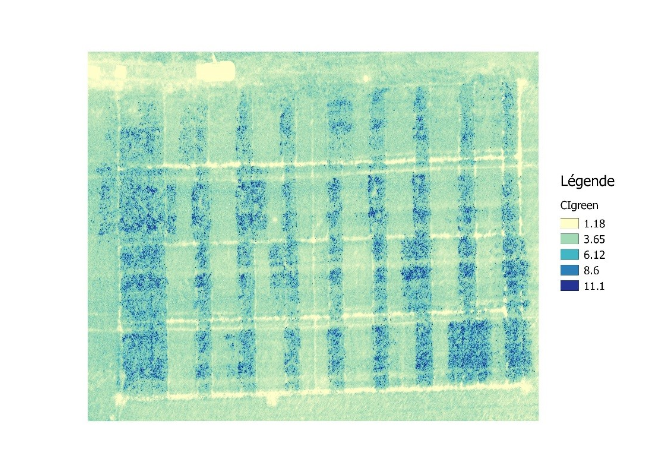
The chlorophyll index is used to calculate the total chlorophyll content of the leaves. The CIgreen and CIred-edge values are sensitive to small variations in the chlorophyll content and consistent across most species.
CI green = ρNIR / ρgreen – 1 = ρ730/ρ530 – 1
CI red-edge = ρNIR/ρred_edge – 1 = ρ850/ρ730 – 1
The red-edge band is a narrow band in the vegetation reflectance spectrum between the transition of red to near infra-red.
The total chlorophyll content is linearly correlated with the difference between the reciprocal reflectance of green/ red-edge bands and the NIR band. Hence, a CIgreen- calculated using the observation in the green region (570 nm) and a CIred-edge – using observations in the red-edge (730 nm) are widely used.
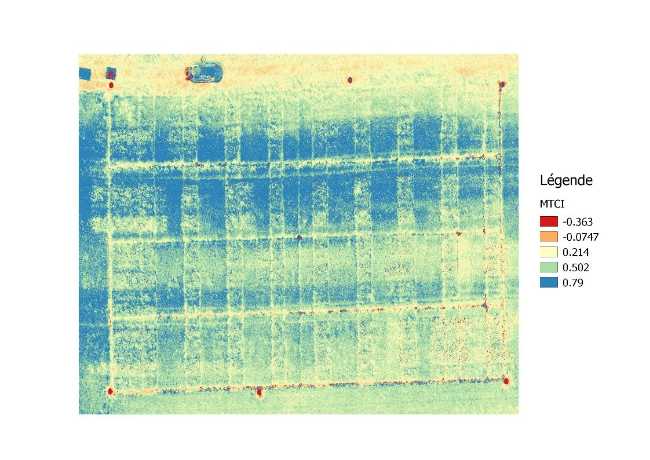
The MTCI was designed to estimate chlorophyll content especially from Merris datasets. This index is sensitive to a wide range of chlorophyll concentration since the reflectance from the NIR, red-edge and red bands are used in the calculation.
MTCI =(ρ850-ρ730)/(ρ730-ρ675)
MCARI gives a measure of the depth of chlorophyll absorption and is very sensitive to variations in chlorophyll concentrations as well as variations in Leaf Area Index (LAI). MCARI values are not affected by illumination conditions, the background reflectance from soil and other non-photosynthetic materials observed.
MCARI = ((ρ850-ρ710) – 0.2 × (ρ850-ρ570)) / ρ710
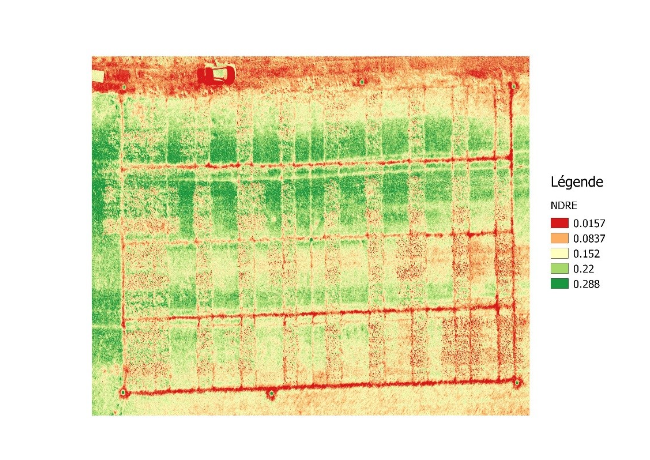
The Normalized Difference Red-Edge Index can be calculated only if the red-edge band is available. The red-edge band is very sensitive to medium to high levels of chlorophyll content.
Hence, red-edge is a good indicator of crop health in the mid to late stage crops where the chlorophyll concentration is relatively higher. Also, the NDRE could be used to map the within-field variability of foliar nitrogen to understand the fertilizer requirements of the crops.
NDRE = (ρNIR-ρred_edge)/(ρNIR+ρred_edge)
The red-edge band is capable of penetrating the leaf better than the red band that is absorbed by the chlorophyll in the first few layers.
The ND705 has a strong linear correlation with FPAR (fraction of Absorbed Photosynthetically Active Radiation) which is an indicator of chlorophyll at the canopy level. ND550 is a good indicator of GAI (Green Area Index). In addition, these indices are sensitive to senescence and are invariant to chlorophyll florescence.
ND705 = (ρ850-ρ730) / (ρ850+ρ730)
ND550 = (ρ850-ρ570) / (ρ850+ρ570)
The ND705 and ND550 are indicators of chlorophyll-a (which is the primary photosynthetic pigment).
This index gives a measure the amount of Chlorophyll-ab content at the field-level from close-range images of mm to cm resolution over sugar beet canopy. The index value is little influenced by the crop canopy structure and thus is insensitive to variations of GF (green fraction) and GAI (Green area index).
mNDblue = -(ρλ – ρ450) / (ρ850 + ρ450) λϵ{530,570,675,730}
Also, in order to know more about vegatation indices in general, we encourage you to read our article about the basics of vegetation indices