
Our products
Backoffice
Cloverfield v3.5.1 – April 25th, 2025
New features have been added to Cloverfield™, your online digital phenotyping data platform. This release includes tailored new features for plant breeding, crop protection & nutrition and also production fields to let you make decisions earlier in the season, so you can maximize time and resources.
Among these new features you'll find powerful new dashboards in the 'Analytics' tab:
This new analytic dashboard empowers plant breeders to map the diversity of the genetic material represented within their field trials. This feature allows for a fast, in-season analysis of diversity from phenotyping data, to inspect the different clusters responsible for your genetic diversity, to analyze the correlation between the calculated traits and your ground truth assessments (manual measurements or validation data), and to be able to make decisions earlier and maximize the impact of your trial.
How to access it in Cloverfield™?
You’re ready to analyze the diversity clusters of your trial!
This also new analytics dashboard allows for a fast and direct analysis of your modality performance within a product testing trial. This integrated ANOVA tool helps to quickly determine the multifactorial equation explaining the variability of your modalities from the calculated traits so you can streamline your analysis of which treatment is statistically relevant within your trial program and target the best performing modalities overall. This feature breaks down in 3 steps: Multifactorial equation definition + ANOVA computation + post-hoc test (Tukey HSD) for pairwise comparison.
How to access it in Cloverfield™?
This feature is tailored for production fields and On-Farm Experiments allowing to fuse data from multiple vectors like satellite heterogeneity map with RGB imagery from Literal, to assess the heterogeneity of the field and locate precisely sampling zone and perform non-destructive assessments of your crops to investigate further what’s going on in your field or experiment. Through accurate data collection and processing, this solution is aiming at helping you evaluate the performance of new agricultural practices and optimize harvest logistics for instance.
How to access it in Cloverfield™?
Log into your Cloverfield™ account now to discover the new features online! And for more information, please reach out to your Hiphen Campaign Manager.
Stay tuned for new Cloverfield™ features release next month.
Sincerely,
Your Hiphen Success Team.
API integrations, Plot Scoring tool & new Analytics functionalities are now available in Cloverfield™, your plant phenotyping data platform.
We are thrilled to announce a significant upgrade to our Cloverfield™ online phenotyping data platform. With the release of the latest version, we are introducing new game-changing features that will enhance your experience and streamline your data management processes:
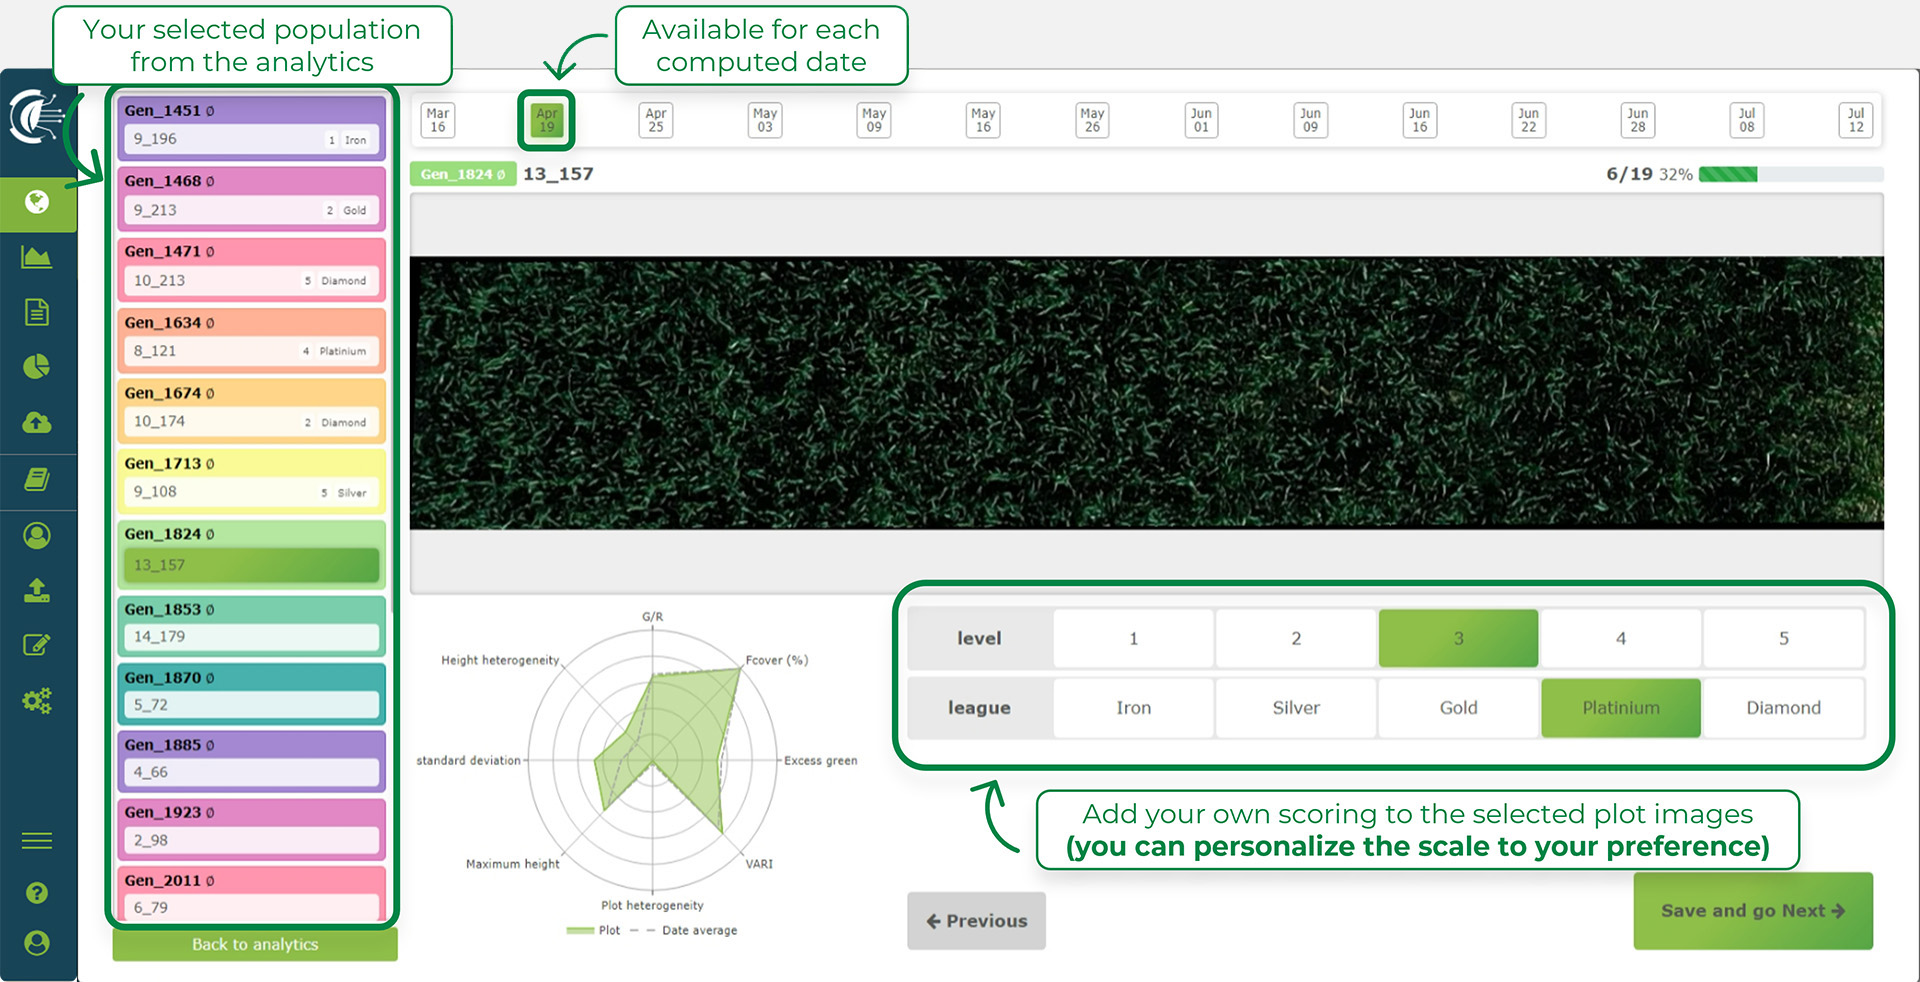
Screenshot of the Plot Scoring Tool interface in Cloverfield™.
The Plot Scoring tool is a game-changer in digital phenotyping and genotype assessment. Now, you can define your own scoring scales (numerical or categorical) and annotate plot images at the phenological stage of interest. The scores will then appear next to the digital traits allowing you to boost and scale your genotype assessments. Directly from Cloverfield, you can now deploy ground-truth annotations at scale for various applications such as plant lodging, disease resilience, plot quality and much more. The Plot Scoring Tool empowers you to augment your phenotypic information with precision and efficiency.
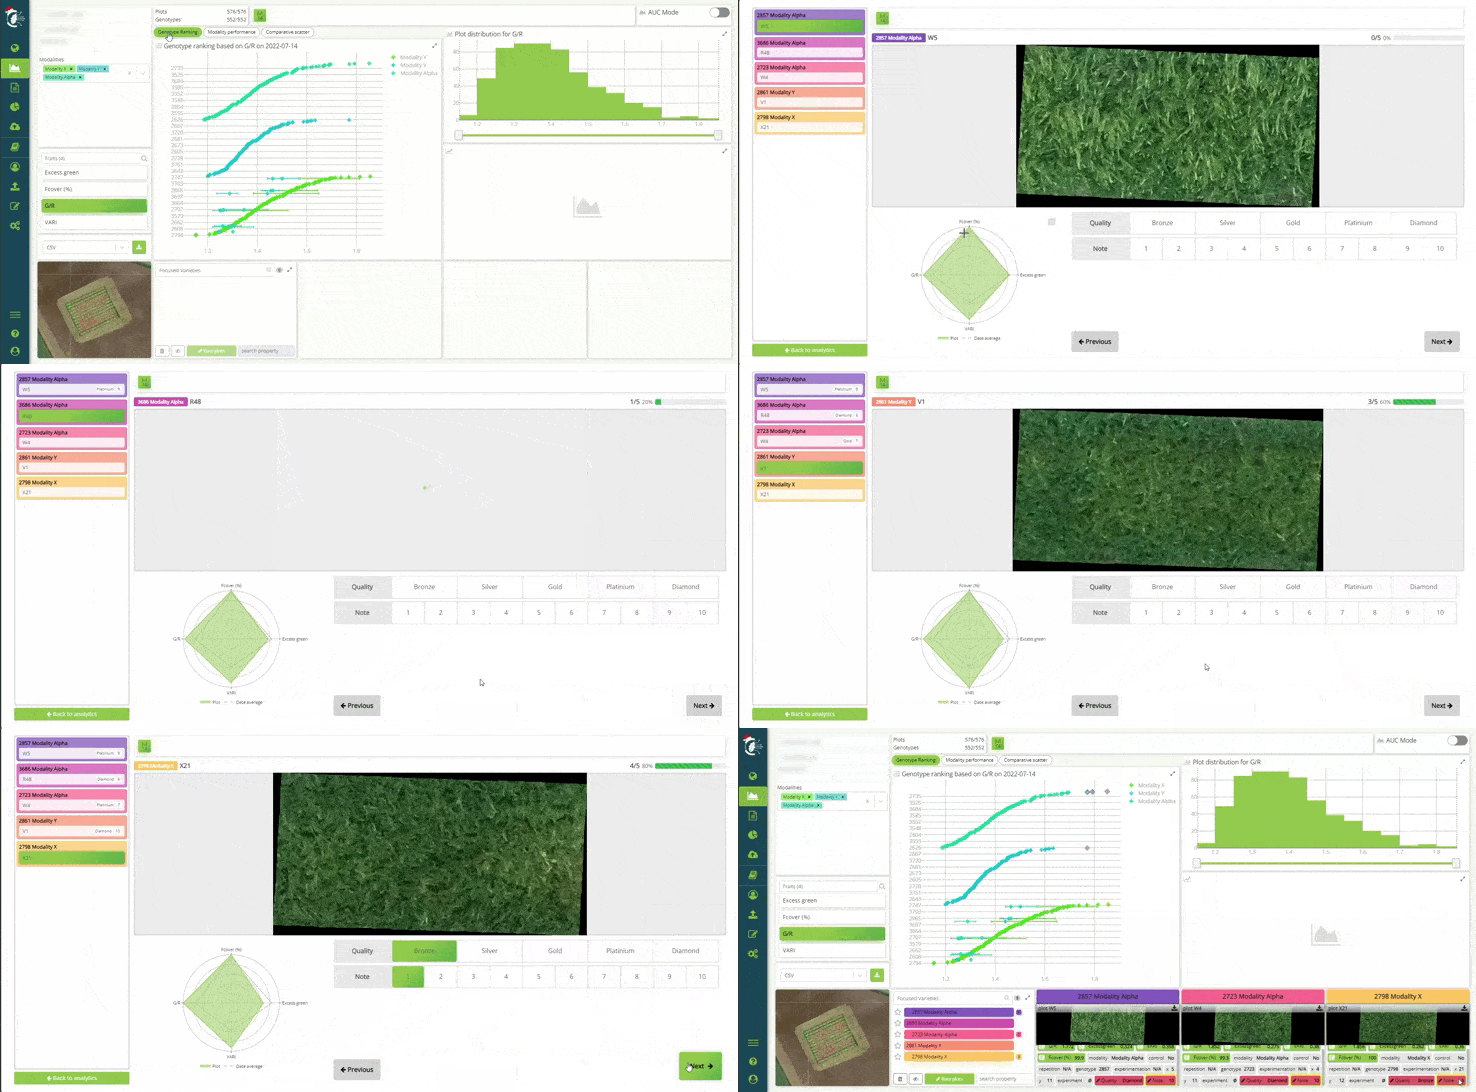
Rate your plots with your own rules directly in Cloverfield™ using the Plot Scoring Tool.
This new functionality allows you to select the agronomic variables you would like to compare on a scatter plot. It is designed to assist breeders in comparing digital traits, facilitating the identification of outliers and trends within your nurseries or field trials. It actually nicely complements the Plot Scoring Tool. Imagine scoring your images, saving this ground-truth as a new trait, and then inspecting how it stacks up against digital traits such as vigor, flowering, and biomass proxies directly from the Genotype Analyzer. This dynamic combination enhances your ability to glean valuable insights from your phenomics data.
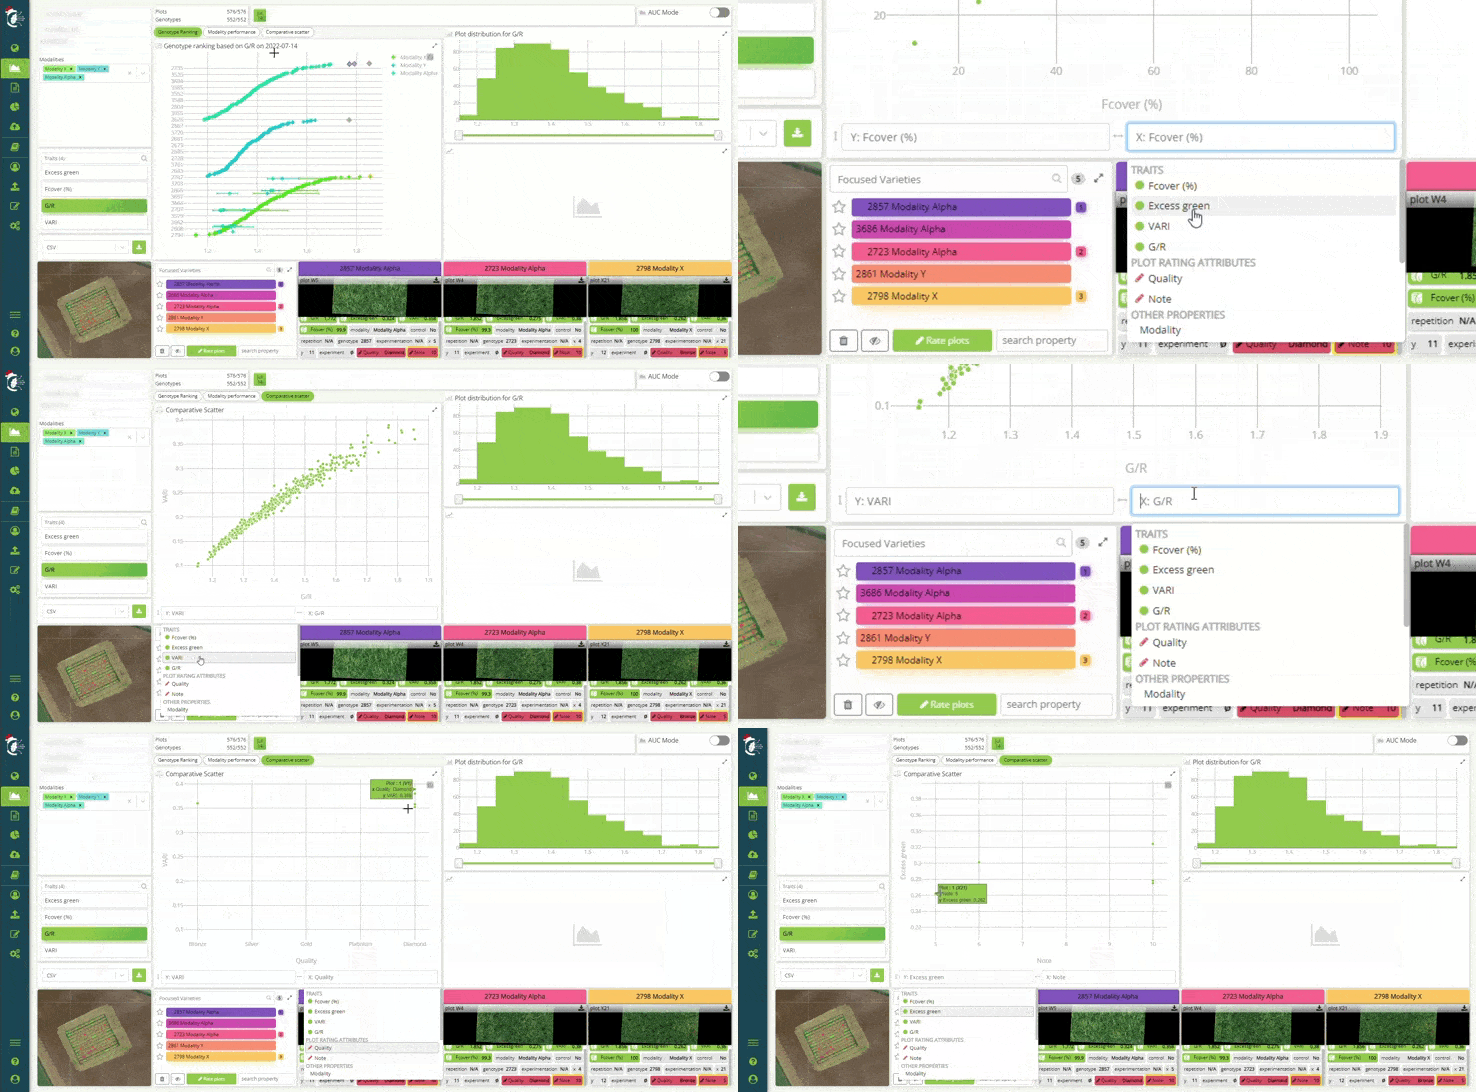
Compare Plots using the Genotype Analyzer graph in Cloverfield™.
This box plot was added at the request of crop protection specialists to efficiently assess the impact of their products per experiment. It is now very simple and quick to check how your crop responded to the various treatments applied, which we refer to as modalities. It marks the first step into analytical features designed specifically for crop protection use cases and you can expect more to follow in the next year.
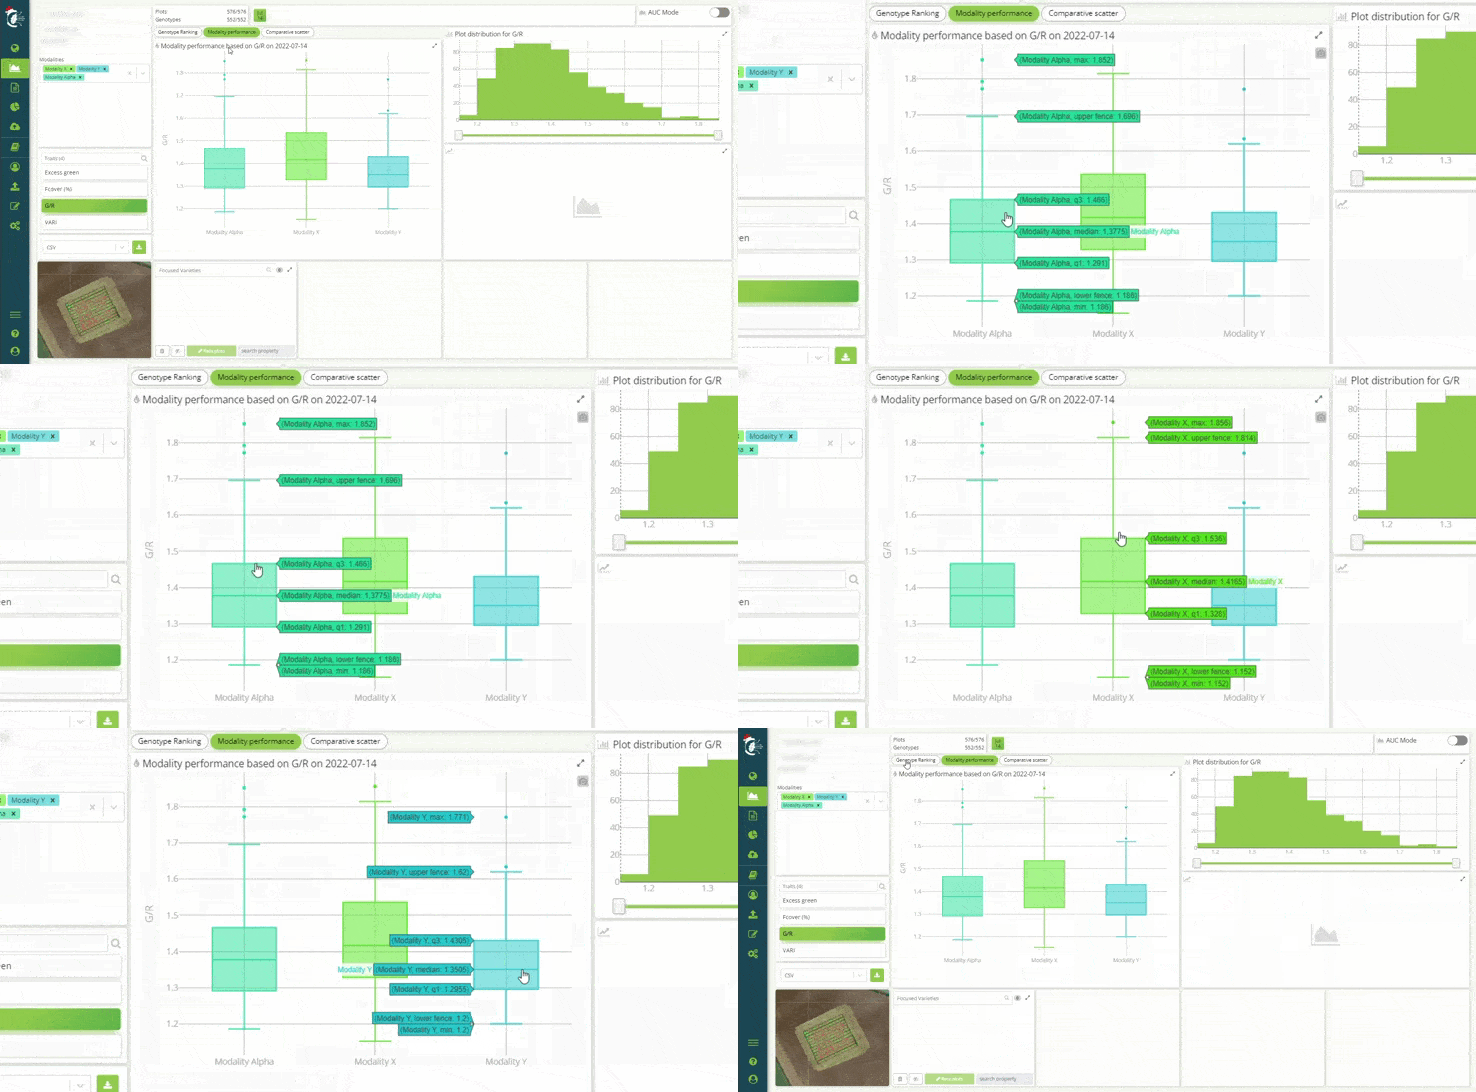
Identify outliers in product development trials using the Modality Profiler graph in Cloverfield™.
APIs, or Application Programming Interfaces, are a set of protocols and tools that allow different software applications to communicate and exchange data with one another. In the context of Cloverfield™, our APIs enable you to seamlessly connect your management or proprietary software to our platform, facilitating automated data transfer, including both uploads and downloads.
Global breeding companies are already using Cloverfield™ APIs to seamlessly connect their information system to ours. Newly acquired data is programmatically pushed to Cloverfield™ and results are automatically retrieved and published into their data lakes. Security is of the essence here as well, with Hiphen's security compliance reaching high standards to guarantee safe data transactions. Our documentation will guide your team of IT experts to connect and we are at your disposal to accompany you should you need any assistance from our software team.
At Hiphen, the team is committed to using our software expertise to help you achieve more season after season. We believe that the addition of Cloverfield™ APIs is a significant step towards making your data management smoother, more efficient, and more powerful.
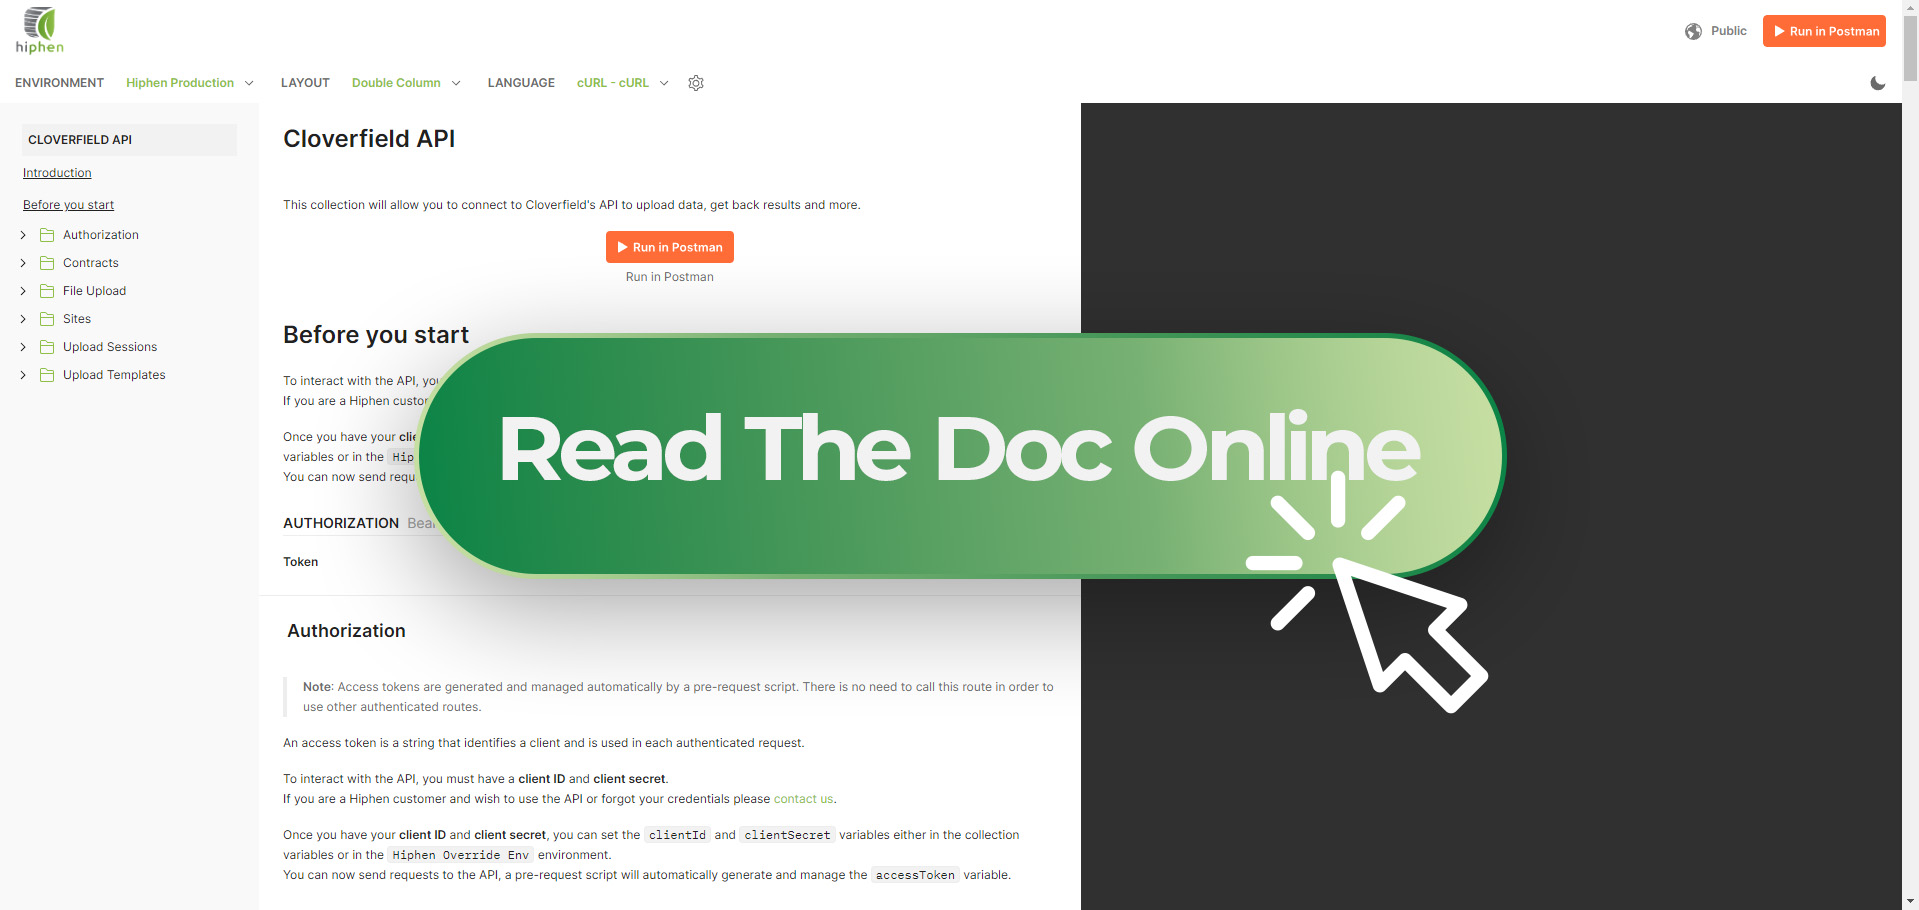
Read the public documentation online by clicking the image link

In the agricultural imaging realm, working with multiple sensors at a time is often common since each sensor give access to a specific plant information, either related to the architectural, structural, biophysical, or reflectance properties of the plant. And interpreting the data collected from these sensors is required to compute what we usually call traits (i.e., plant assessments).
Now if we want to access more granular assessments, one way of doing it is to combine data from multiple sensors to superpose them and access more insightful and accurate information for agricultural research.
Enter the fascinating world of the pinhole camera model – a simplified yet powerful concept that forms the bedrock of computer vision. In this blog post, we'll explore the wonders of the pinhole camera model and its indispensable role in simulating the behavior of a camera for deeper granularity of phenotypic assessments in agricultural research and production.
At Hiphen we have experienced working with an array of cutting-edge industrial sensors, from RGB cameras to LiDAR, multispectral, thermal sensors and more, each providing valuable data to compute essential traits. Therefore, combining the data from these multiple sensors is crucial for gaining a comprehensive understanding of how plants are behaving in their environment. However, to achieve this, it is essential to be able to simulate and understand the geometric representation of a camera.
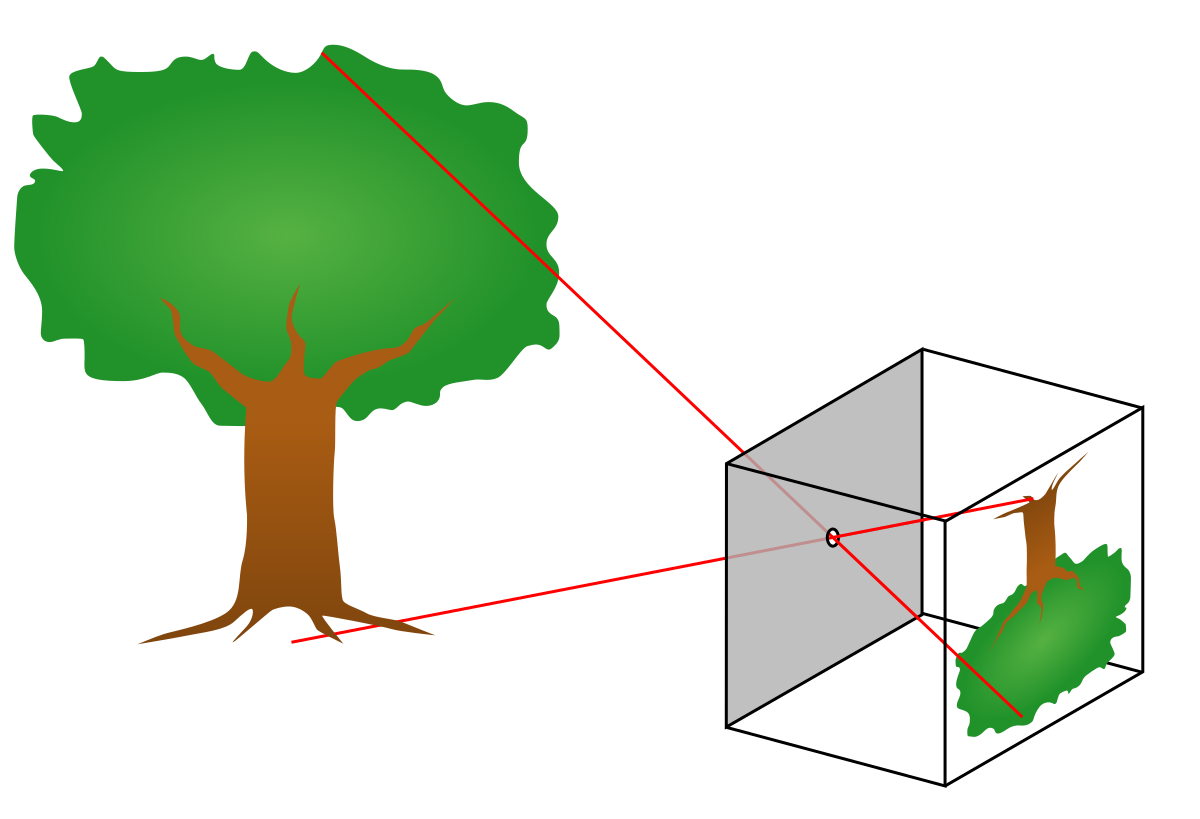
Early diagram of the pinhole camera model.
The pinhole camera model is a mathematical representation that describes how light from a three-dimensional scene interacts with an ideal pinhole camera to form a two-dimensional image. In this model, the camera aperture is represented as a point, and light travels in straight lines through the tiny hole before reaching the image sensor or film.
In agricultural imaging projects, researchers employ various sensors simultaneously to access diverse plant information. For example, RGB cameras provide valuable colour data, while 3D sensors allow for structural property assessments such as biovolume and height. By combining data from these sensors, researchers can achieve a more accurate and comprehensive understanding of plant traits. For instance, while LiDAR provides an excellent source of information for structural and architectural plant properties, it cannot provide data on leaf colour or temperature amongst other. However, by integrating LiDAR data with thermal data, researchers can precisely measure leaf temperature in a high-throughput fashion and with excellent repeatability. This level of data fusion enhances the accuracy and efficiency of plant trait assessments, revolutionizing digital phenotyping in agriculture and boosting agricultural research worldwide.
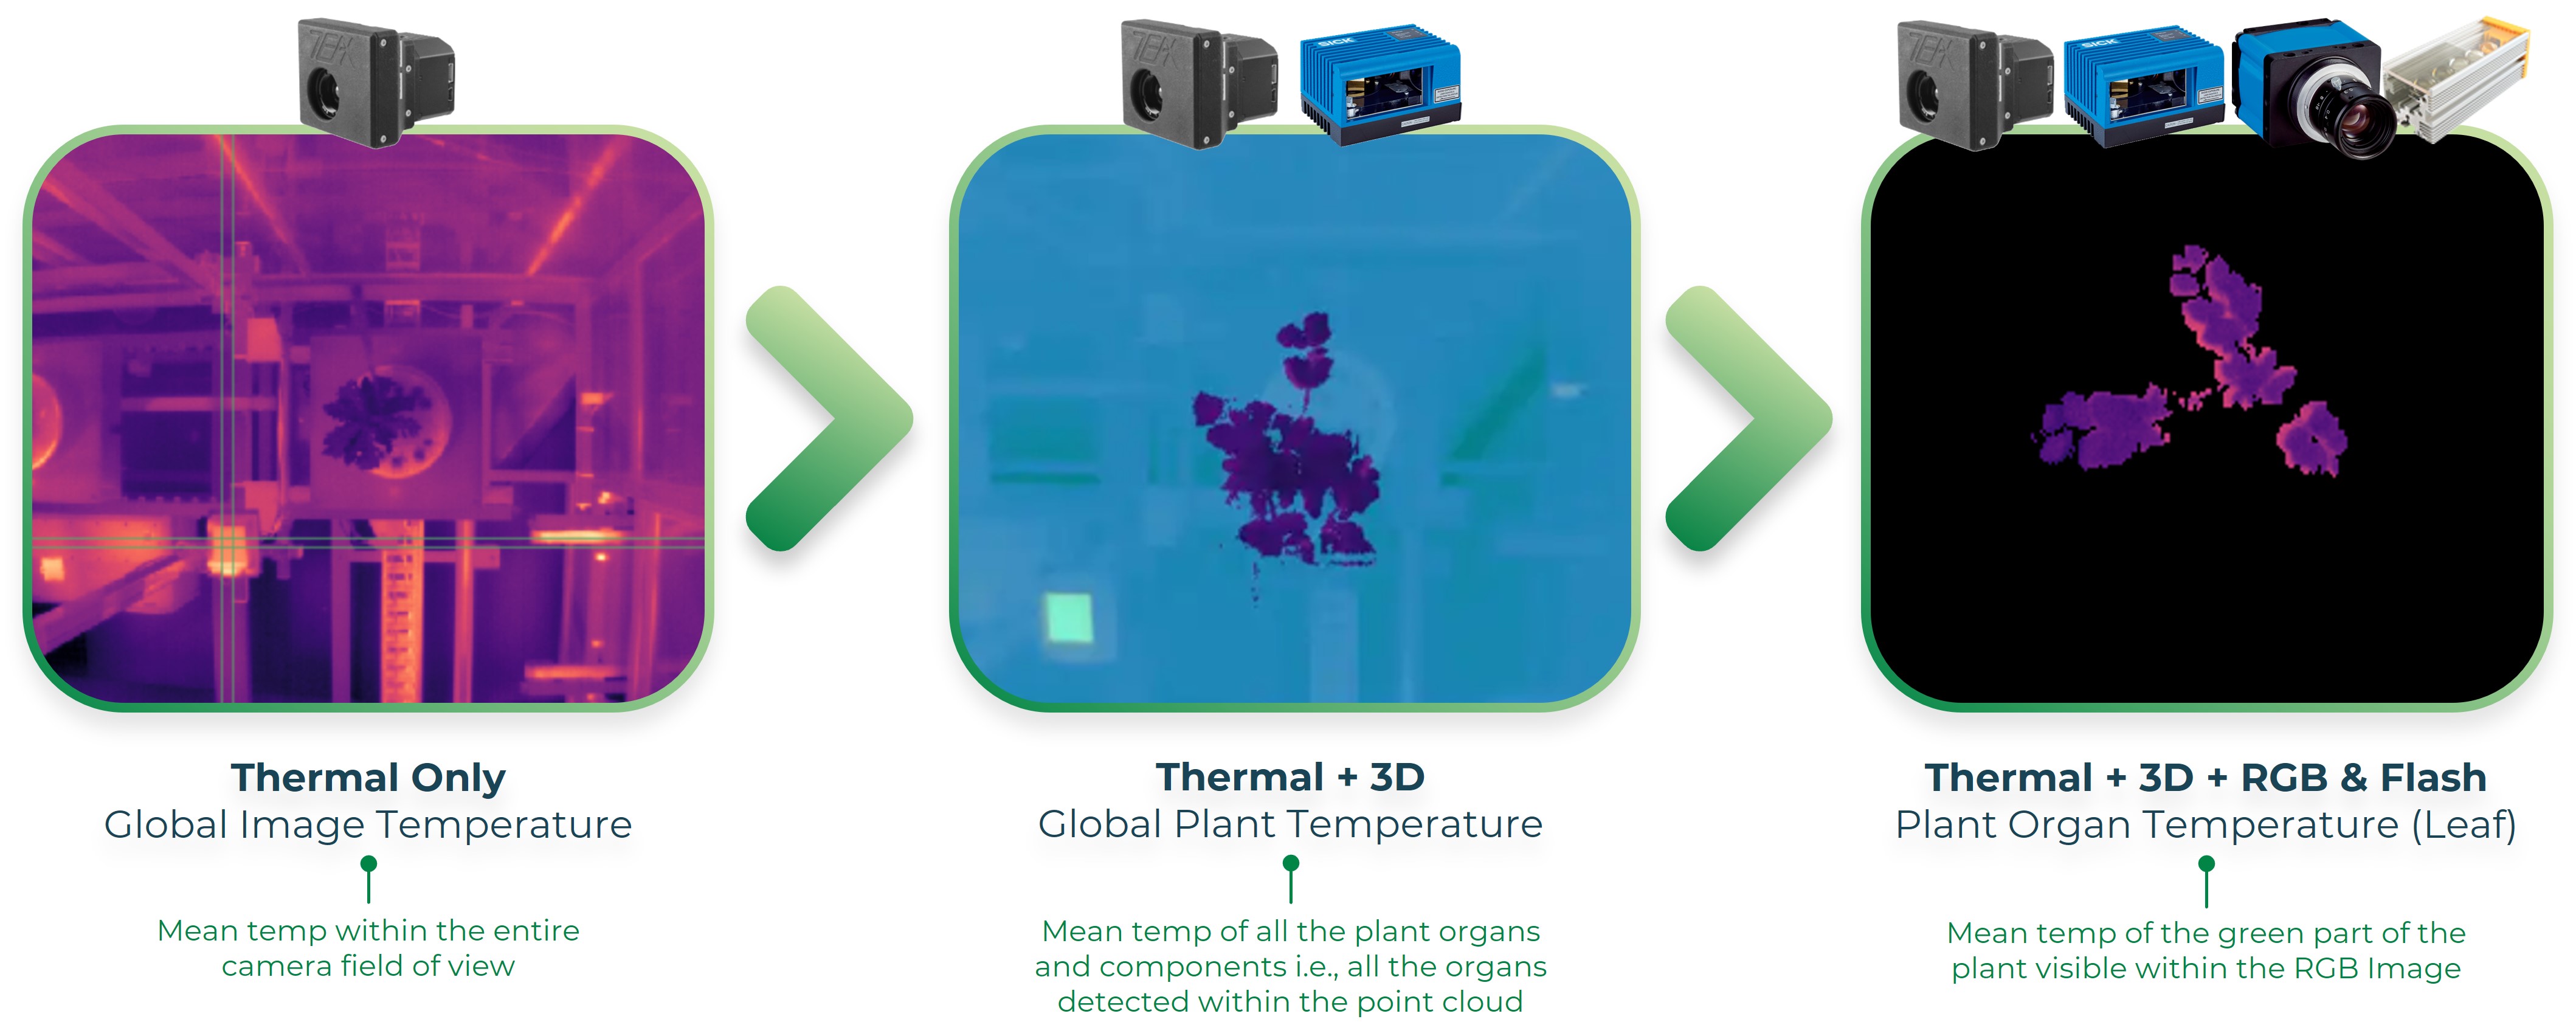
Digital phenotyping Data Fusion in practice. Leaf temperature can now be calculated precisely from imagery.
To superimpose data from different sensors, it's crucial to understand the geometric representation of the camera and ensure perfect alignment. The pinhole camera model allows researchers to put the 2D scene, captured by a thermal camera for example, into perspective to merge it with a 3D point cloud data for instance. To apply this methodology to phenotyping applications, researchers need to consider the sensors' positions on a 3-dimensional plane in comparison to the plant or tree being measured. Validating the alignment is a crucial step and involves extracting and comparing points from each image to ensure accurate layering.
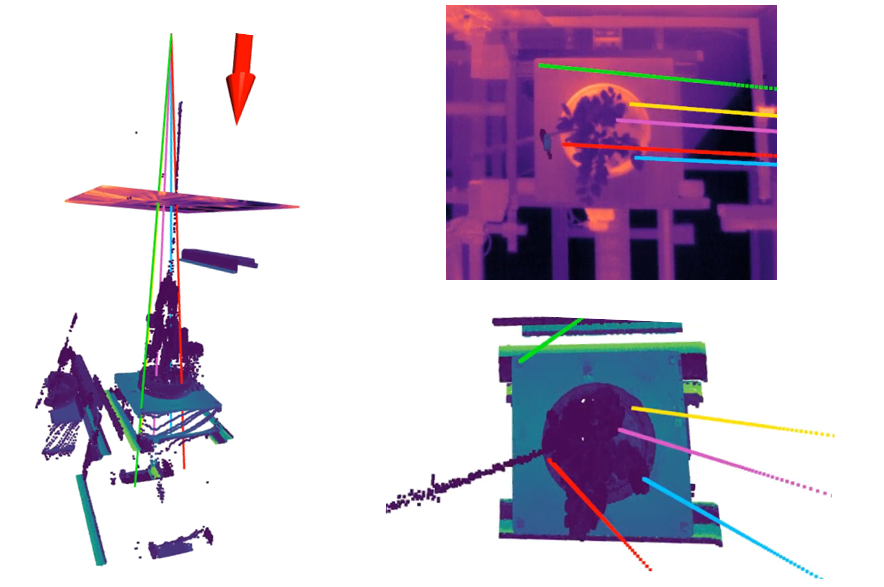
Diagram illustrating the accurate superposition of 3D (point cloud) data with 2D (Thermal) data.
The pinhole camera model has played a crucial role in digital phenotyping evolution, enabling plant phenotyping experts to combine data from different sensors to achieve a deeper granularity of plant trait assessment. By fusing information from various sensors like LiDAR and thermal cameras, researchers can gain a comprehensive understanding of plant health, stress tolerance and resilience, and understand genotypes behavior in their environment globally. It also gives access to traits assessments that we can't imagine having access to before. Such traits and mathematical calculations can be easily implemented into Hiphen's PhenoStation® for phenotyping in controlled conditions but could also be adapted to PhenoMobile® for field-focused phenotyping projects. So, with the latest advancements in data fusion and sensor technology, digital phenotyping is poised to lead the way in shaping tomorrow's agriculture.
Grab a time from one of our experts' calendar to discuss about your project.
Sincerely,
Your Hiphen Team.
Topic brought to you by Matthew Cassidy – R&D Engineer @Hiphen.
Based on a quick survey conducted on social medias recently, the vast majority of agtech professionals (72%) think that drone is today the most versatile and easy to use device for plant phenotyping. It is true that, the latest improvements in drone technology makes this type of systems more performant and more accessible than ever. Thus, most of the crop researchers we work with around the globe are internalizing drone data acquisitions to make high-throughput plant phenotyping part of their plant assessment routine.
With modern technology, flying a drone is easy. Almost anyone can now get their hands on affordable equipment that you can familiarize yourself with fairly quickly to take-off and land by the press of a few buttons on a tablet. Once data is acquired, Hiphen then provides a hassle-free experience in the sense that all you have to do is upload your data on our cloud platform and then download your results – all the heavy lifting machinery in between is our responsibility. What one gets in return from drone acquisitions is an extensive list of valuable agronomic traits that accurately and objectively describe and assess plant architecture, behavior and sanitary state. You can consult our drone phenotyping catalog for more information about the traits that can be computed.
Equipment from manufacturers such as DJI are reliable for plant phenotyping, and ensure a frictionless experience with more and more automation and fewer interactions between the pilot and the machine. That being said, while most agtech experts agree that flying a drone is easy, flying a drone for agriculture requires special knowledge about the appropriate sensor choices and configuration, flight parameters and protocol to ensure that you acquire top-quality data.
The most common mistake is to acquire images with insufficient resolution. The compromise between speed and resolution (i.e. the number of pixels per ground cm) is critical and choosing inappropriate sensors and altitudes can result in poor data quality. Depending on the traits you are interested in analyzing, these parameters have to be carefully specified in advance.
Front and side overlap ratios ensure that each of your trial plots will be photographed multiple times to be able to generate an accurate field map – often referred to as an orthomosaic in our photogrammetry jargon. Setting the wrong overlapping parameters is very likely to result in data gaps in parts of your field trials.
GCPs are targets placed on the ground that have to be geo-referenced and hooked so they remain in the same precise spot during all the flights of the campaign. Not using this common practice is likely to result in inaccurate field maps which will make time series analysis almost impossible.
You are measuring plants, and plants are living organisms. Depending on your crop, genotypes, experiment, and the traits that have to be measured, it is important to acquire top-quality data at the appropriate phenological stage. In parallel, certain weather conditions have to be carefully anticipated to avoid blurry, overexposed or underexposed images, or even multispectral image processing being negatively impacted by wet field conditions.
As mentioned above, the choice of sensor is critical to deliver the appropriate image resolution, along with the orientation angle of the camera. Setting the wrong sensor parameters and not orientating your camera at NADIR is likely to negatively impact the quality of your drone data.
At Hiphen, we are present at every step of your plant phenotyping journey, starting with data acquisition, then data processing and data analytics to serve your applications such as best cultivar selection, yield prediction, ideotype qualification, trial quality assessment, cultivar risk assessment, and so on.
Thus we accompany you with your data acquisition by providing you with a drone acquisition protocol document that lists all the flight parameters and guidelines your crew should follow to ensure data acquired is high quality and consistent from one pilot to the other. In addition, we are delighted to announce the launch of the Hiphen Academy this fall. The Hiphen Academy is the first e-learning platform of its kind, fully dedicated to crop researchers focused on drone plant phenotyping projects. This online resource contains 6 courses and 45 lessons dedicated to drone plant phenotyping, representing 8+ hours of training, all based on real-life experience. Here is a quick video to introduce you to the Hiphen Academy.
👇 Watch the replay of our Webinar about the Hiphen Academy 👇
You can also register HERE to grab the latest news about the Hiphen Academy.
So stay tuned by visiting our website and LinkedIn page to receive the latest news about Hiphen and understand how we can help you to achieve your plant phenotyping goals.
Your Hiphen Team.