
Our products
Backoffice

New features have been added to Cloverfield™, your plant phenotyping online platform. Embark on a smoother plant breeding adventure with Hiphen's latest addition: Dynamic Filtering.
Optimize your breeding scheme by effortlessly filtering your genetic material in a few clicks within Cloverfield™.
Interactively combine traits and set thresholds to filter out under-performing genotypes, or pinpoint the top-performing material you want to advance to the next stage.
Define more precisely your analytics profile. Specify more precisely the experiments, modalities and layers that you which to study and/or compare. You can create multiple profiles for the same trial site.
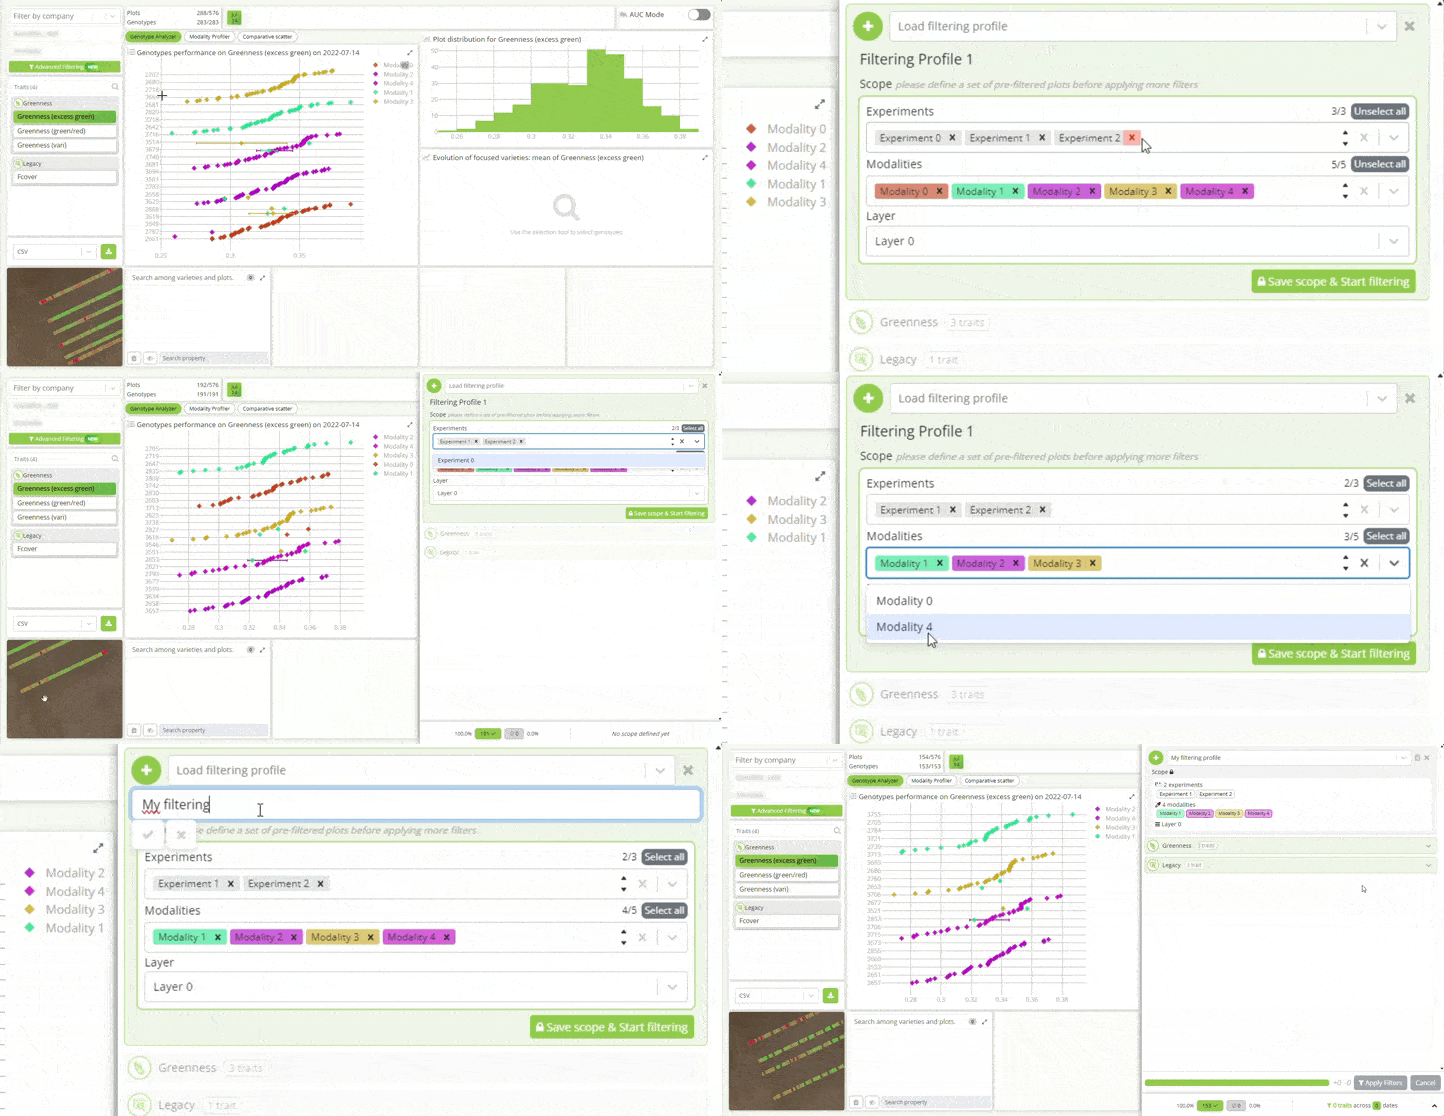
One step further in making your digital phenotyping experience frictionless with Hiphen, you're now able to make a detailed analysis of your data directly in Cloverfield™. You can easily combine traits and set for each one thresholding boundaries outside of which you wish to eliminate genetic material. For instance, one could set independent min-max thresholds for traits like plant biovolume, flower cover, stay green and lodging and see dynamically what share of the trial genetic material he/she is eliminating. This functionality will take you ever closer to reaching your ideotypes more efficiently than ever before!
User value: Apply multiple criteria filtering on your genetic material and dynamically eliminate under-performing genotypes based on your ideotype recipe.
Use Cases:
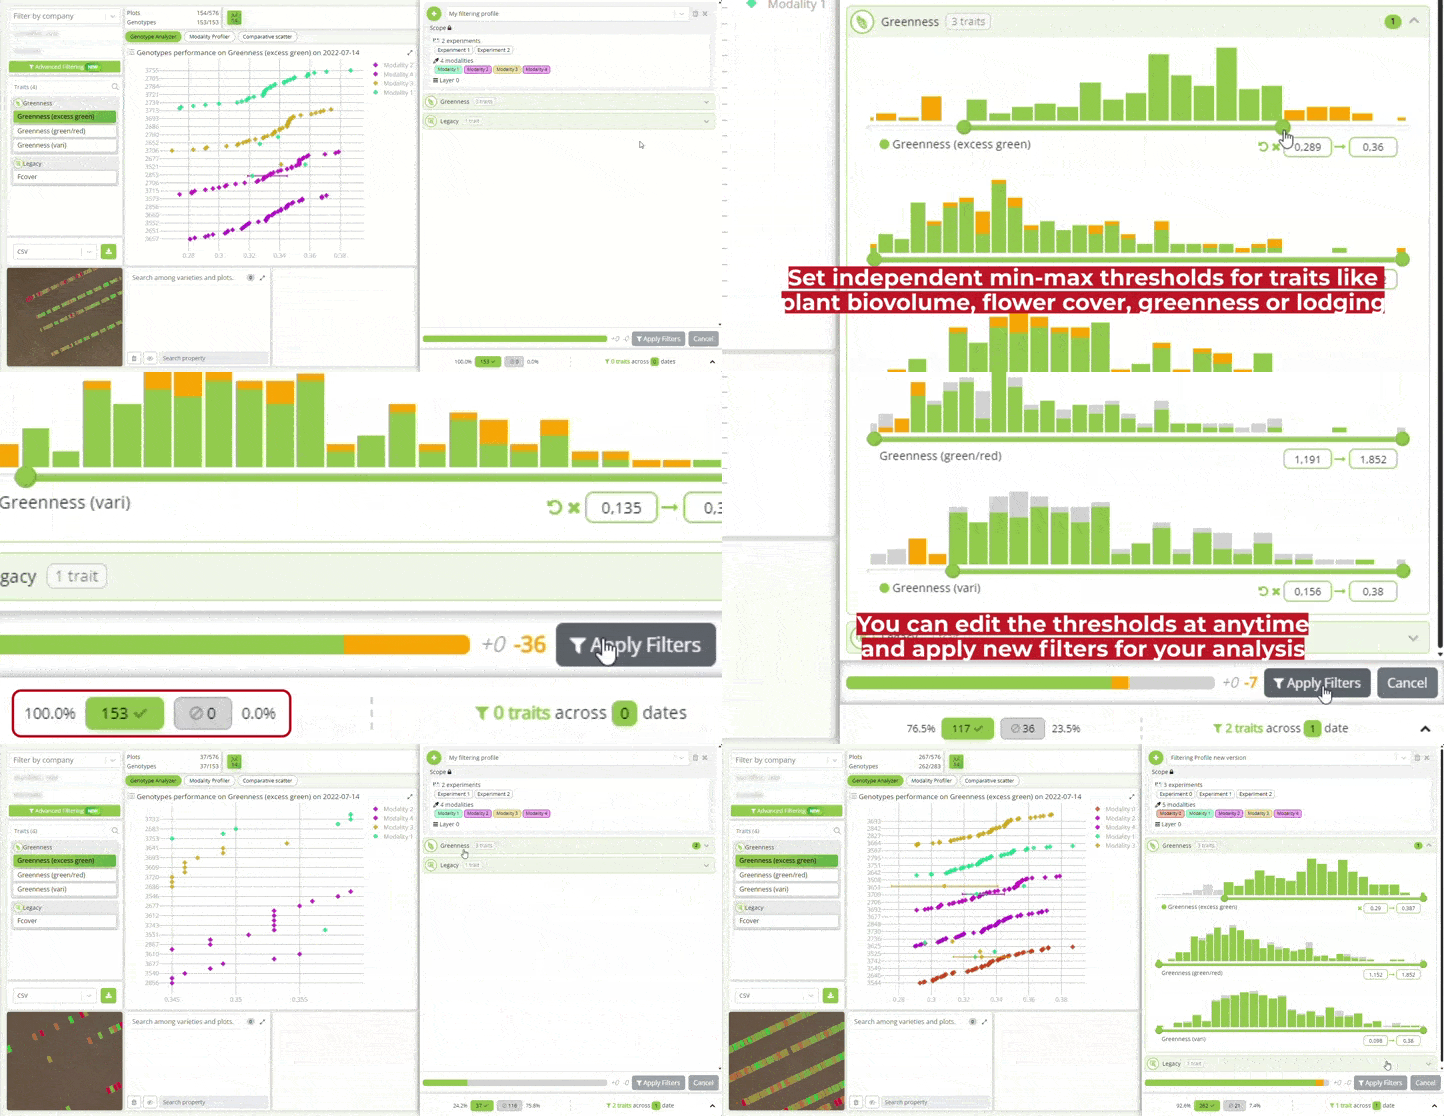
We invite you to explore the new dynamic filtering feature with the online INTERACTIVE TOUR. And please reach out to your Hiphen Campaign Manager should you have any question.
Stay tuned for the next Cloverfield™ features release update next month.
Sincerely,
Your Hiphen Success Team.

We are committed to meeting the evolving needs of crop researchers, and reimagined the way we articulate our Cloverfield™ Glossary with this this purpose in mind. This new intuitive format helps to parse the 70+ phenotypic traits we process routinely every year. Traits are grouped in explicit agronomic themes, with definitions and visuals to be transparent with regards to methodology. The new version places a strong emphasis on five distinct trait categories:
These categories have been carefully curated to cater to the unique needs of agronomic researchers, providing you with a more precise and comprehensive understanding of phenotypic measures available off-the-shelf for your crops.
With this new version, we are also unveiling our revamped interface for an enhanced user experience. Dive into an enriched journey of knowledge with our detailed visualizations and graphs, providing transparency into our advanced traits processing methodology.
Additionally, a powerful search functionality is now at your disposal to easily navigate the content of the glossary. Try it now!
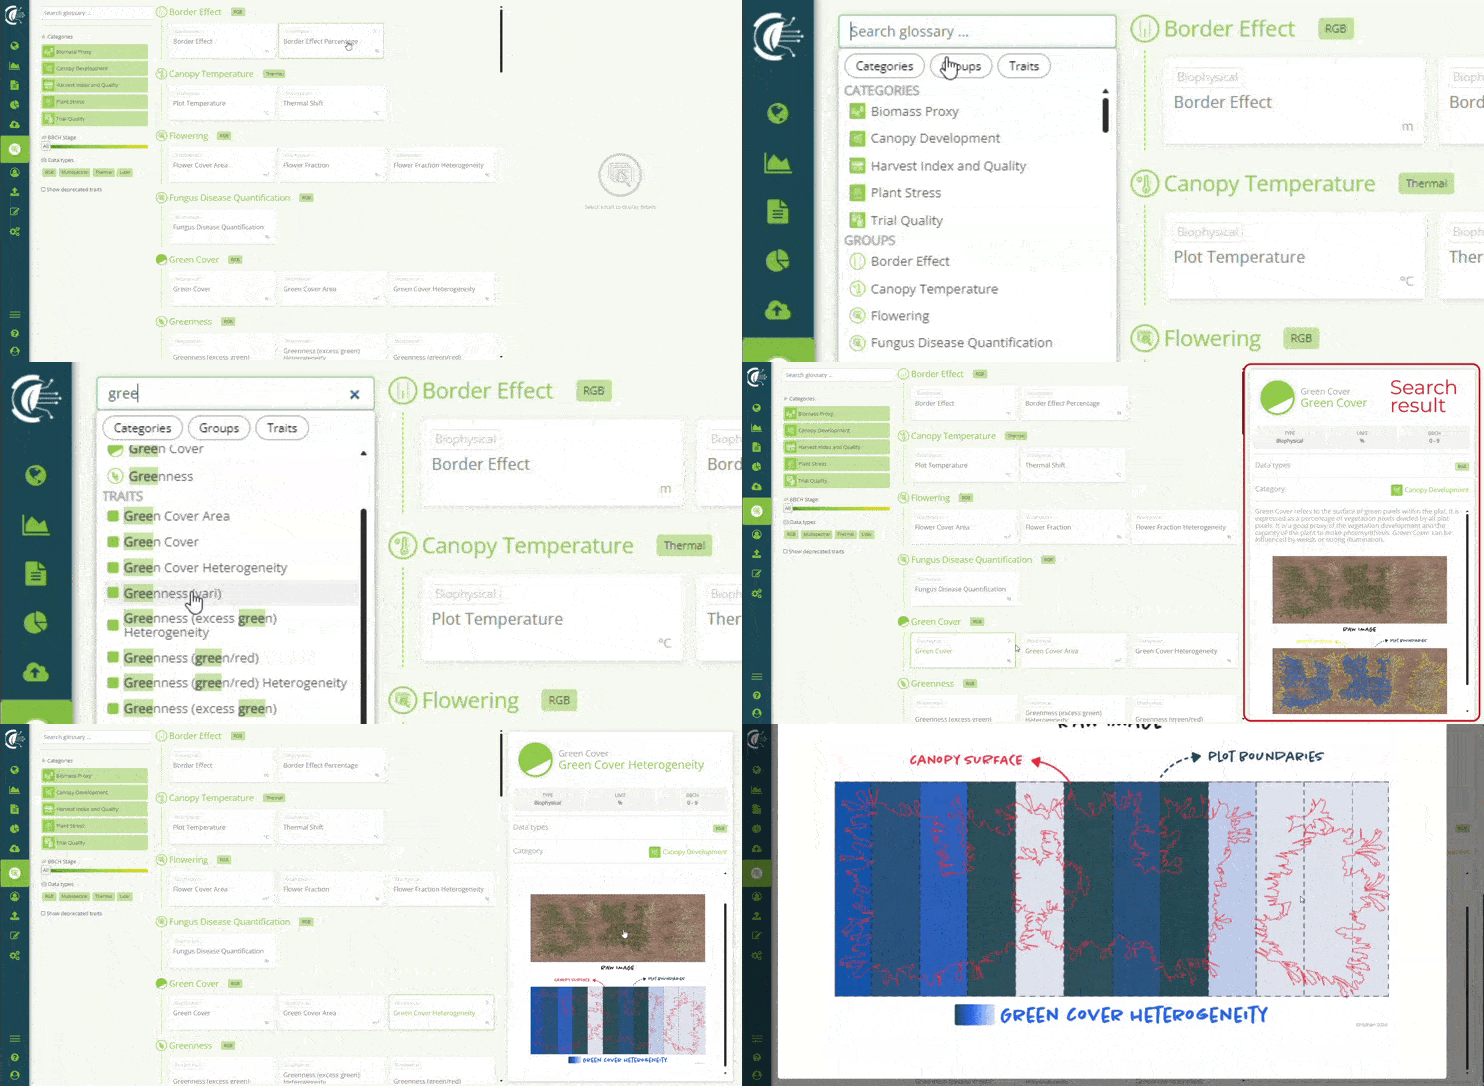
Feel free to share this open online resource, establishing the new standards in digital phenotyping methodology for Ag research, with your fellow researchers to foster discussions within the scientific community. Moreover, we invite you to regularly check out this resource to keep up to date with the latest traits available. We eagerly anticipate collecting your feedback on this new traits' glossary. Your insights are valuable as we continue to advance in the field of agricultural research.
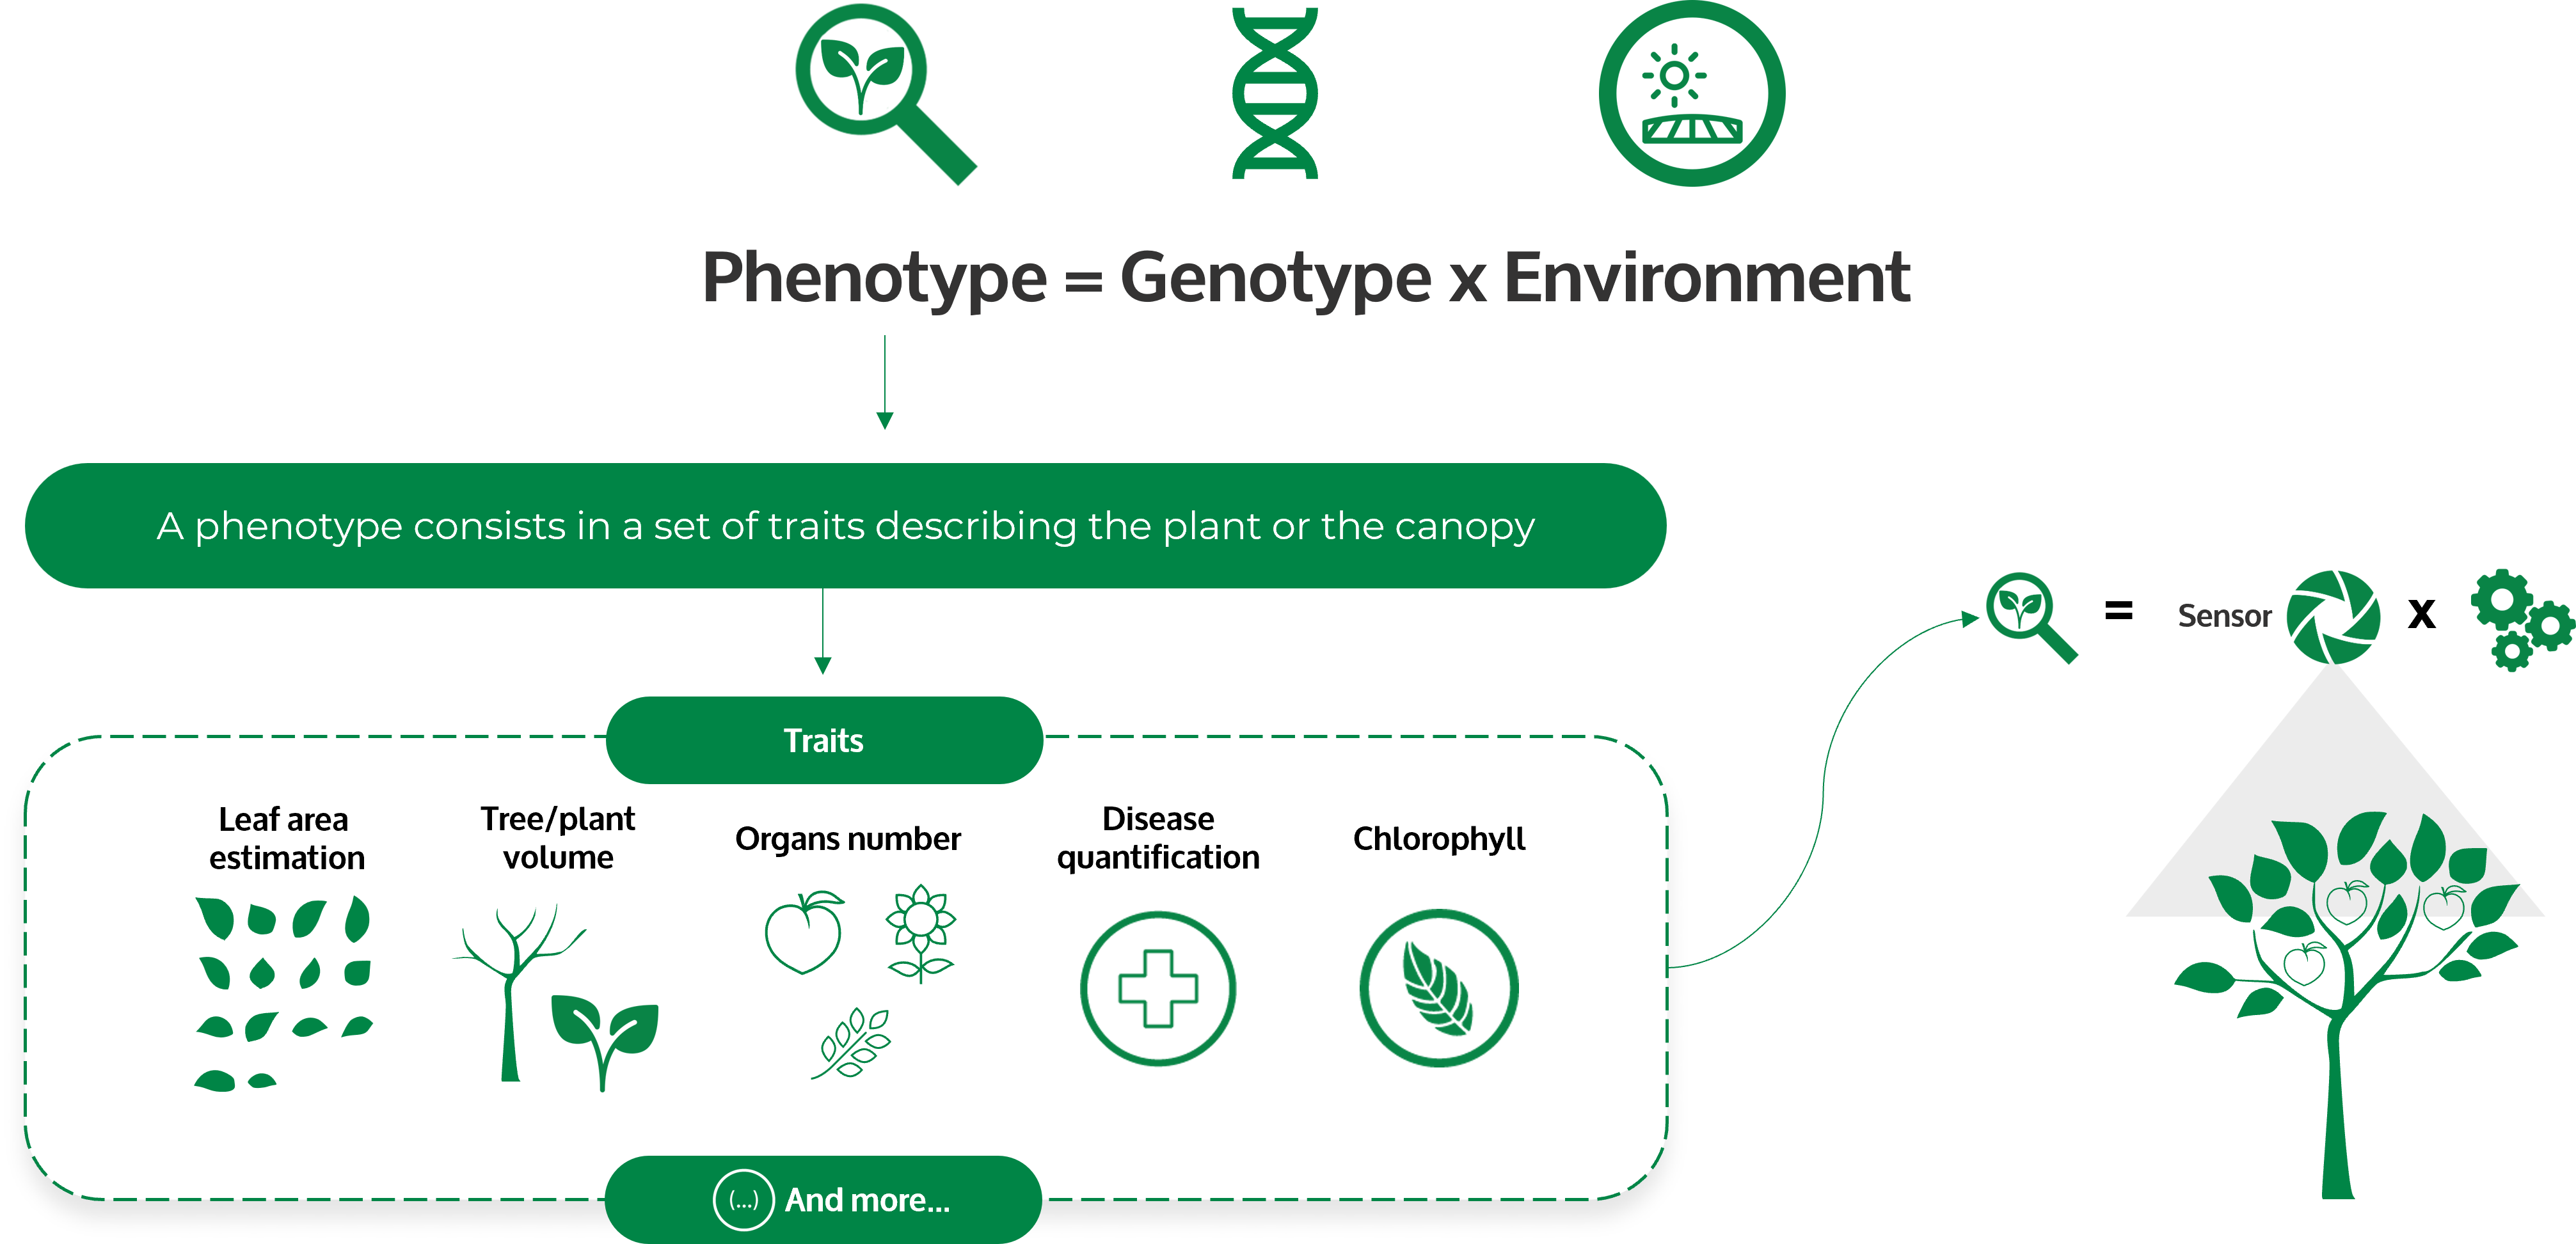
Cloverfield's Glossary is designed to offer definitions for the traits computed by HIPHEN. Alexis Comar, PhD describes a phenotypic trait as: "A measurable characteristic of the plant or canopy. It is the result of combining raw data obtained from sensors such as cameras, lidar, spectrometers, etc., with an analytical method for interpretation. This process serves as the means to transform raw sensor data into meaningful metrics for agronomists."
We've shared previouosly on our blog a post about what is a phenotypic trait – Read it now.
Hiphen's roots are deep into crop science, which truly sets us apart in the digital phenotyping realm. We gather a decade of experience and an unwavering commitment to agricultural research to ensure that our solutions align with your objectives.
The new and improved Cloverfield Glossary is a testament to our dedication to empowering you with the tools you need to make informed decisions and optimize your agricultural practices.
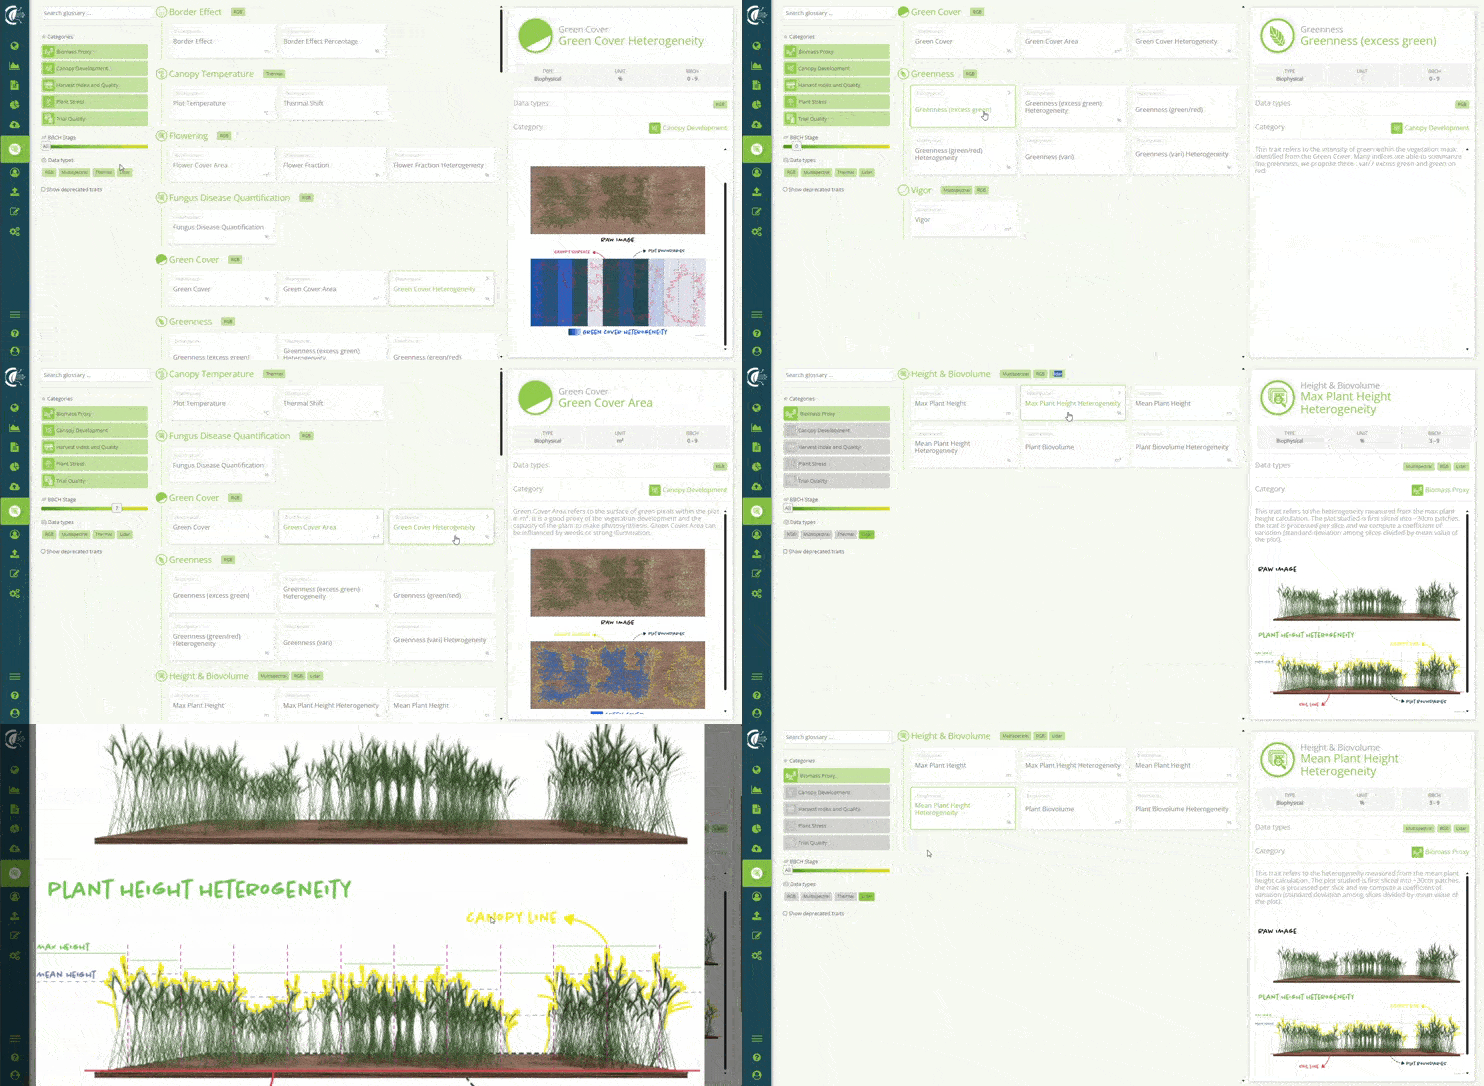
We invite you to explore the new traits' glossary and ask your Hiphen Campaign Manager should you have any question.
Stay tuned for the next Cloverfield™ features release update next April.
Sincerely,
Your Hiphen Success Team.
Cloverfield v2.8.0 – October 04th, 2023
New features have recently been added to Cloverfield™, your plant phenotyping online platform, and in this blog post we are going to take a deeper dive into those 6 new features:
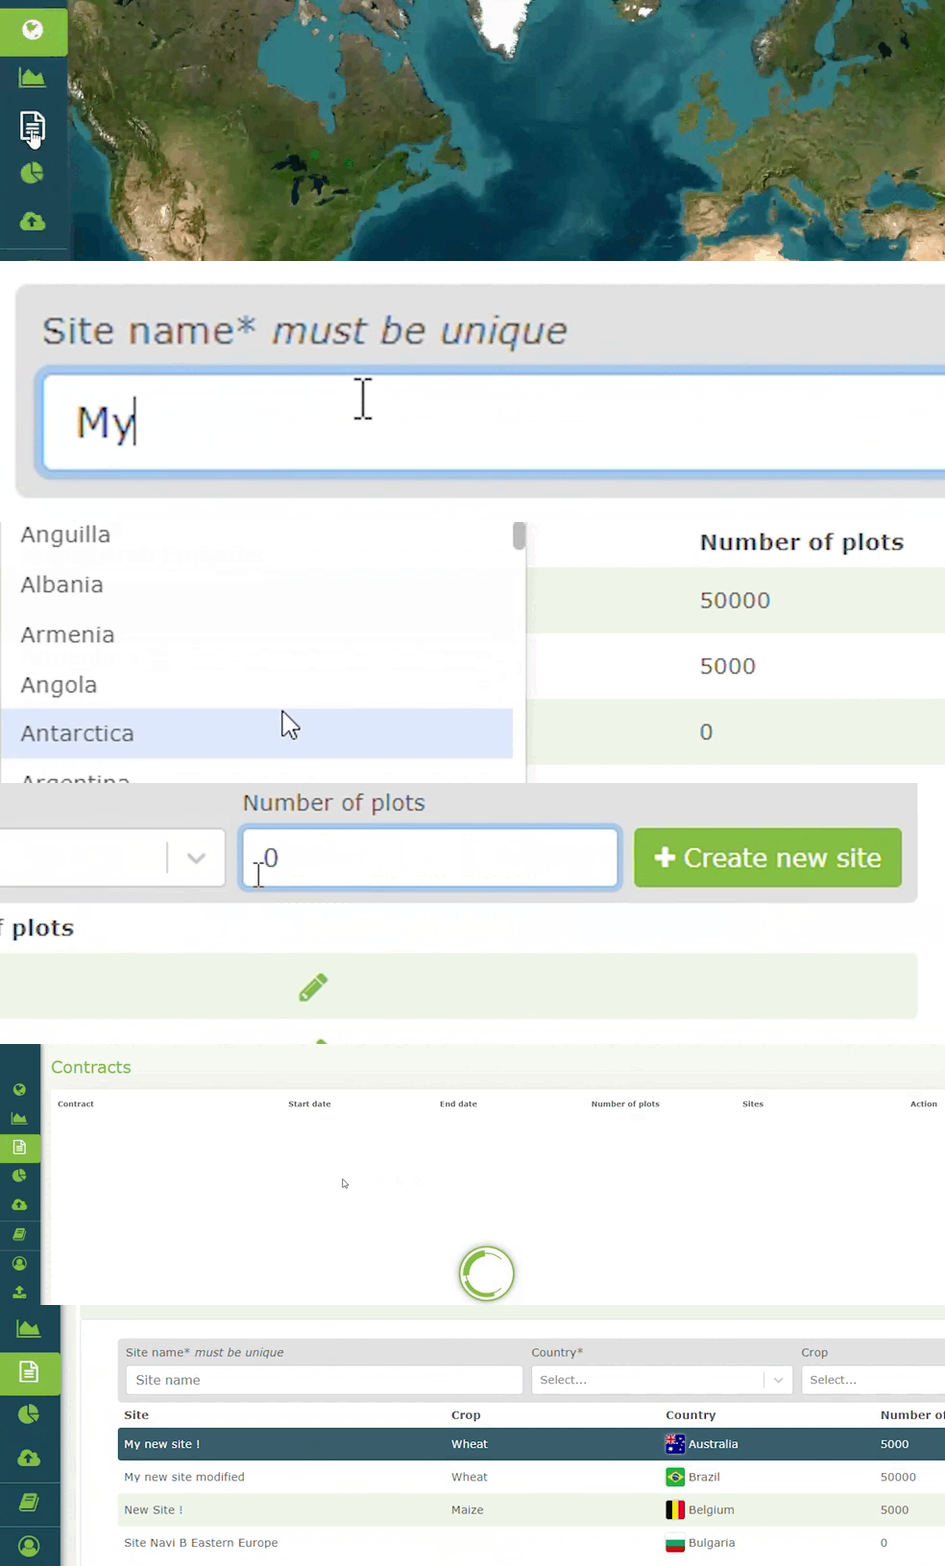
You can now autonomously manage the creation of new trial sites directly through Cloverfield™. Add a new location or change its name without having to ask your Hiphen Campaign Manager. Only accessible for users with 'Admin' rights assigned to the contract.
💎 User value: Save time and be autonomous with your campaign management.
⚙️ Use Cases:
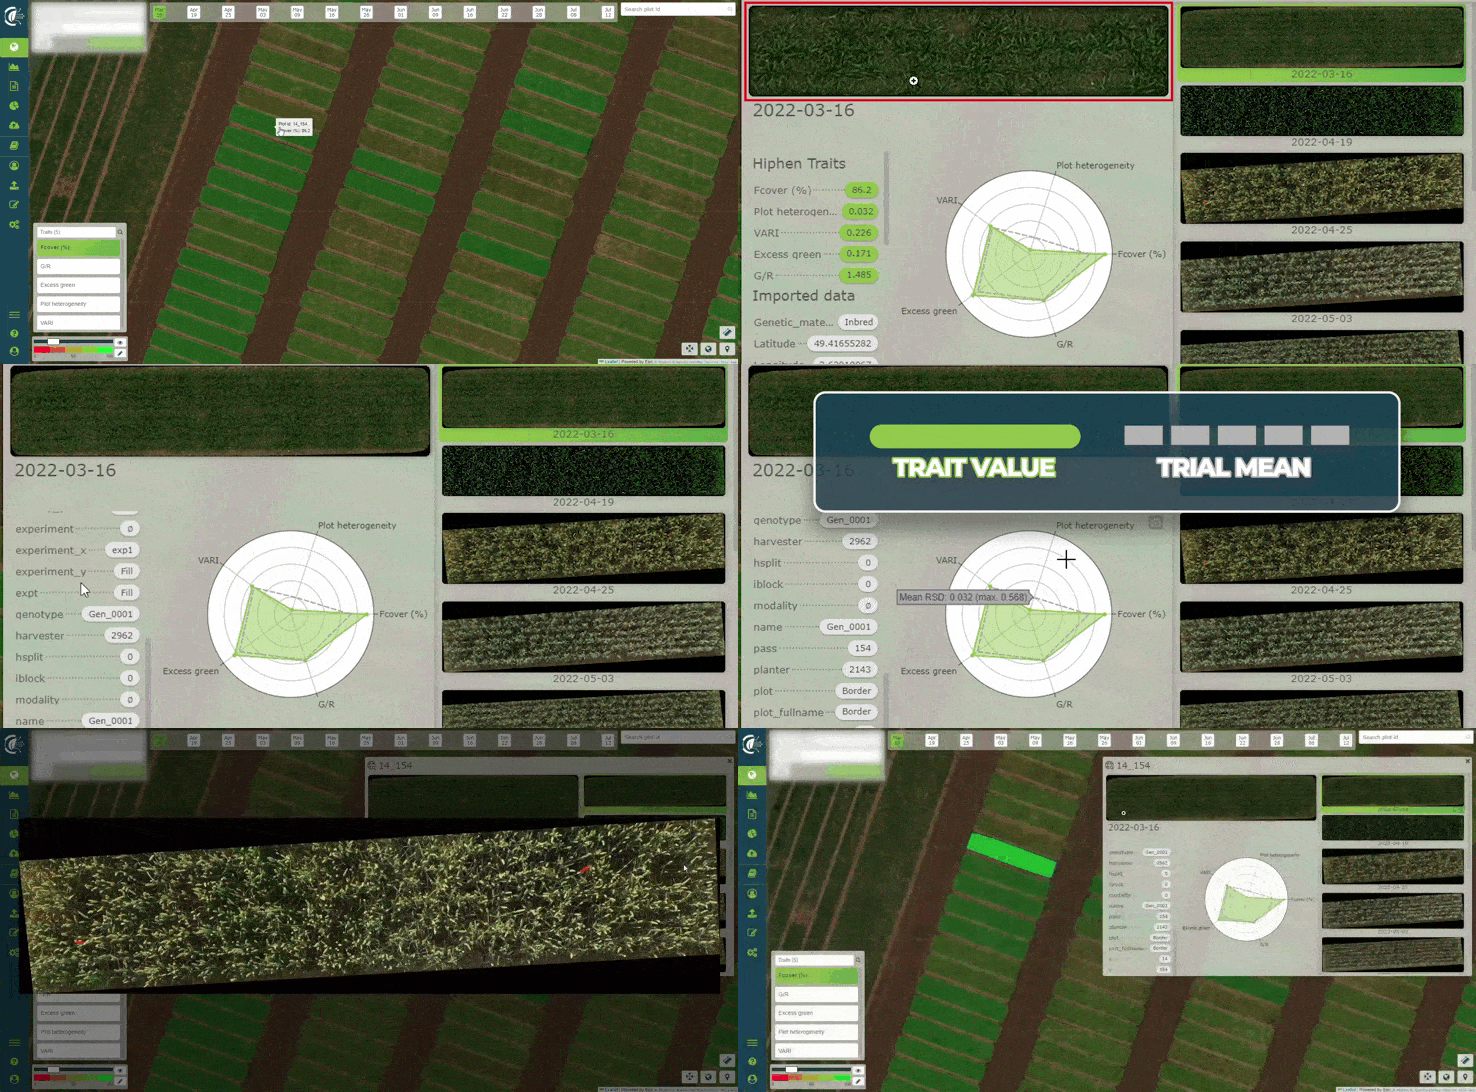
Clicking on a plot in the map view will give you access to a new window that displays next to each other the plot images from each flight. You can now efficiently visualize a single plot’s evolution through time in one click.
The new window also provides the trait results computed for the selected plot at the selected date. Finally, a new spider chart helps to efficiently assess how the plot performed versus the trial’s mean.
💎 User value: Access plot information and history at once for faster inspection and decision-making during the campaign.
⚙️ Use Cases:
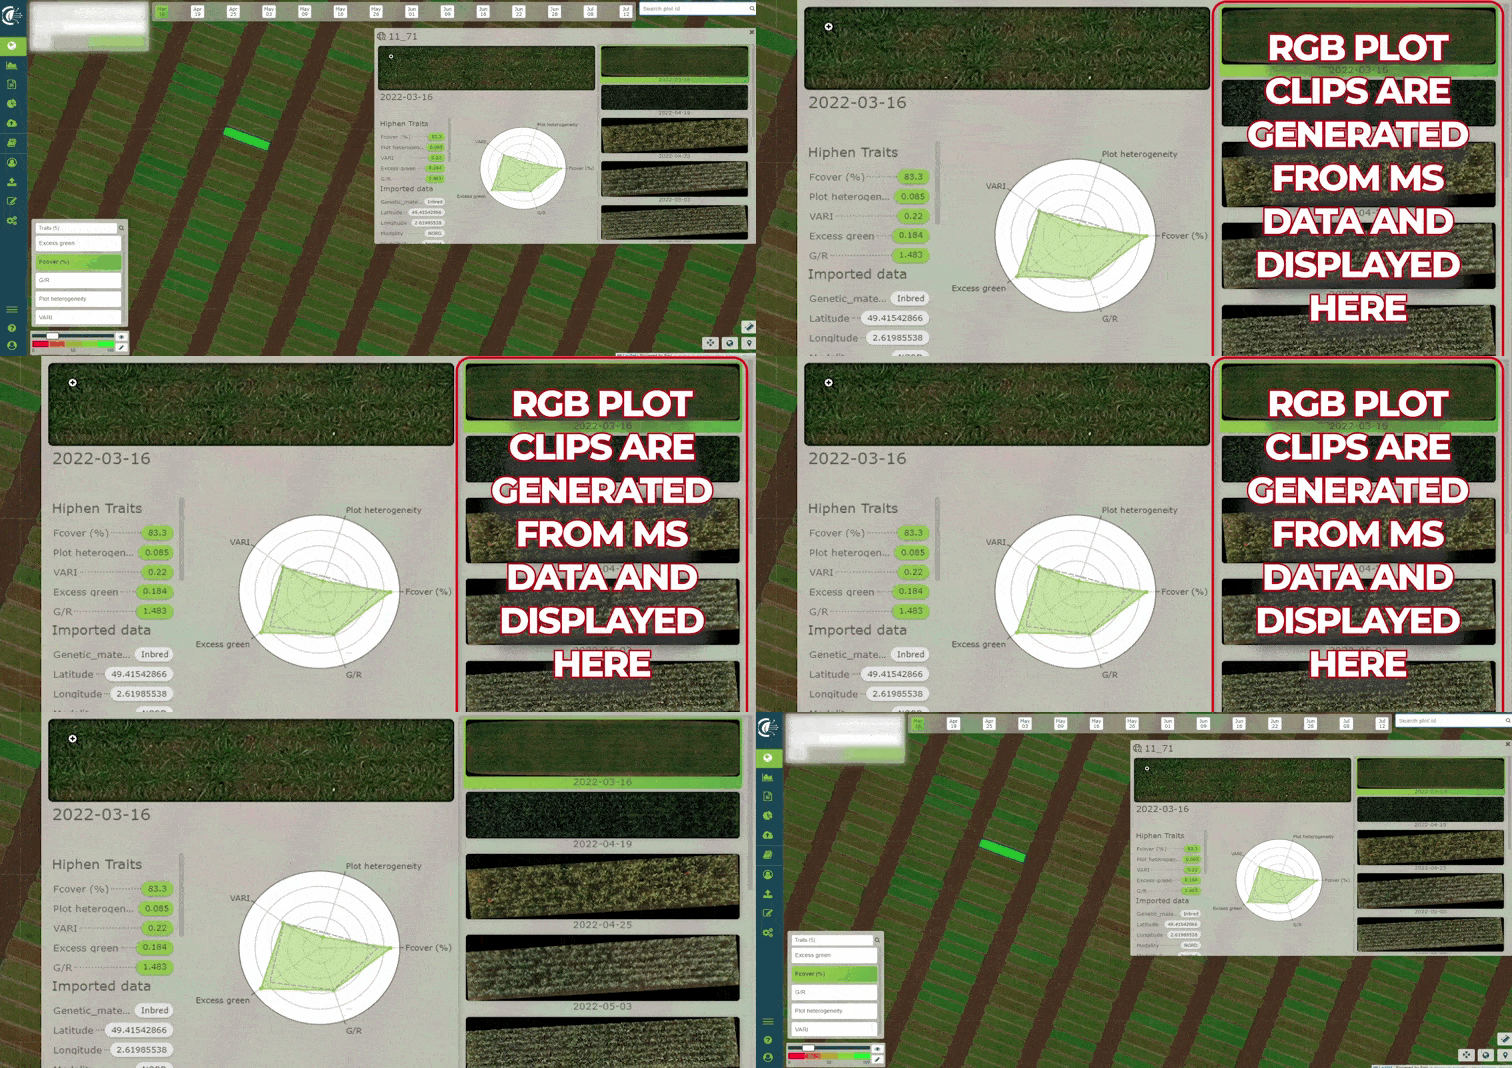
For future multispectral flights, RGB plot clips will be generated from the orthomosaic and posted into the analytics tool. Just as it is the case for RGB flights, you’ll then be able to inspect multispectral plot imagery in more details directly from Cloverfield™.
**💎 User value:**Check the raw image of your plot acquired with a MS sensor.
⚙️ Use Cases:
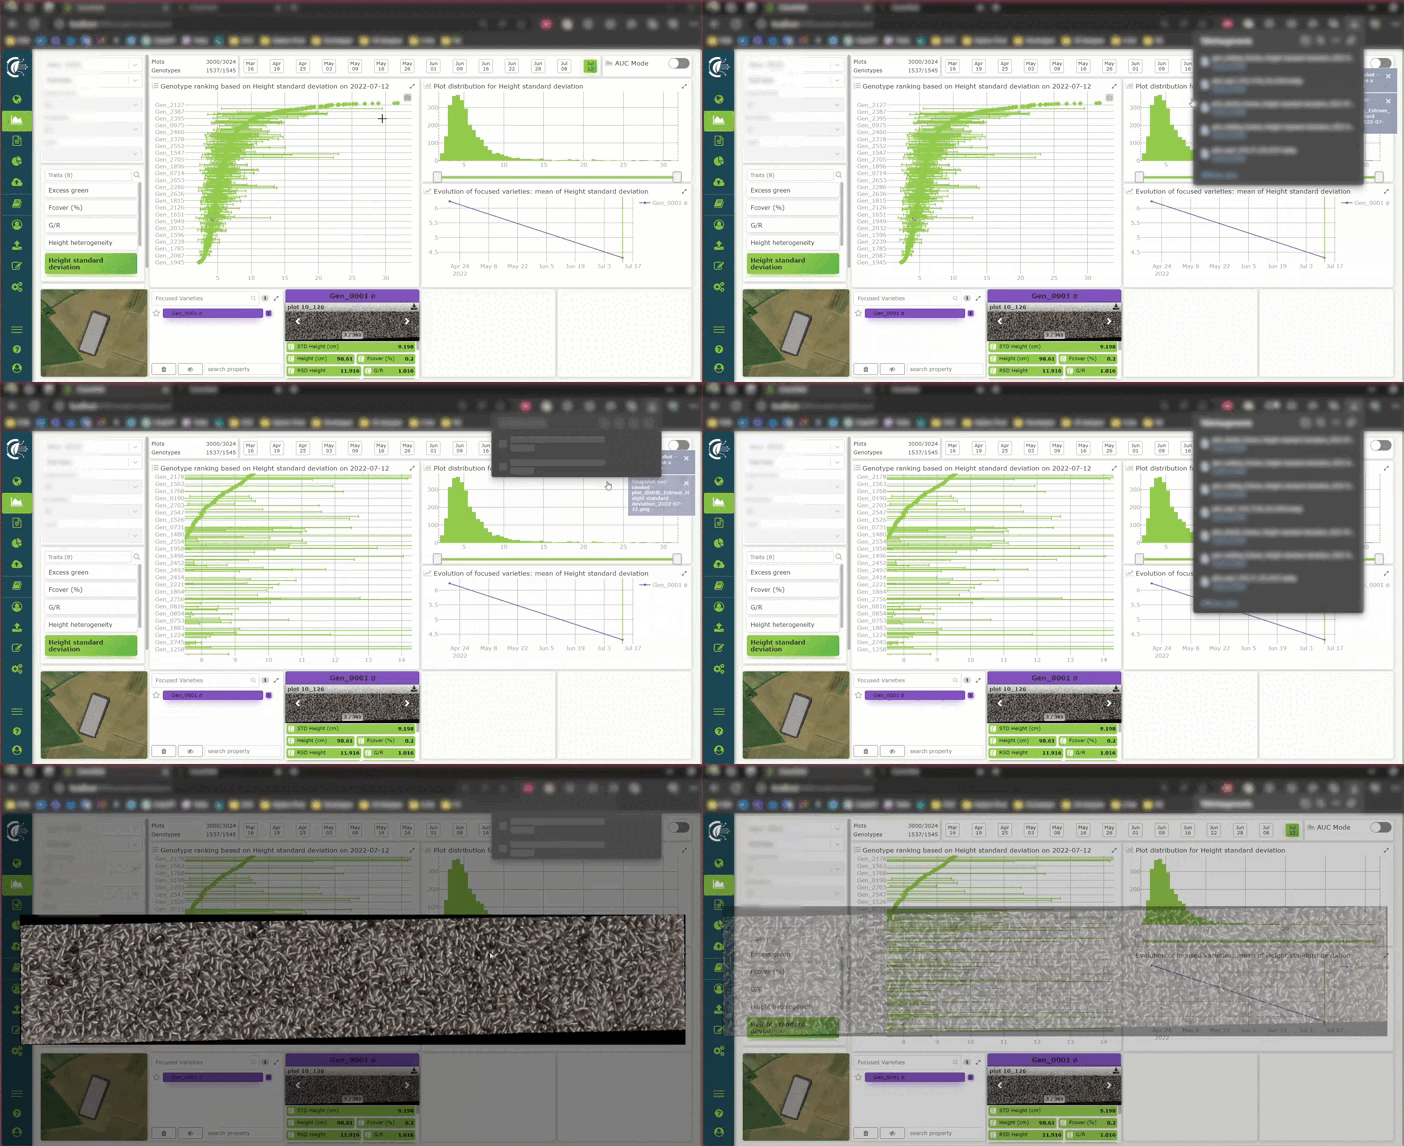
Download graphs displayed in the Analytics tool and any plot clips to insert them into your presentations and internal communication. The file format will be an image (.webp) which will following the following file naming convention: site name_date_plot name.webp.
**💎 User value:**Boost your internal communication about the results of your trial programs.
⚙️ Use Cases:
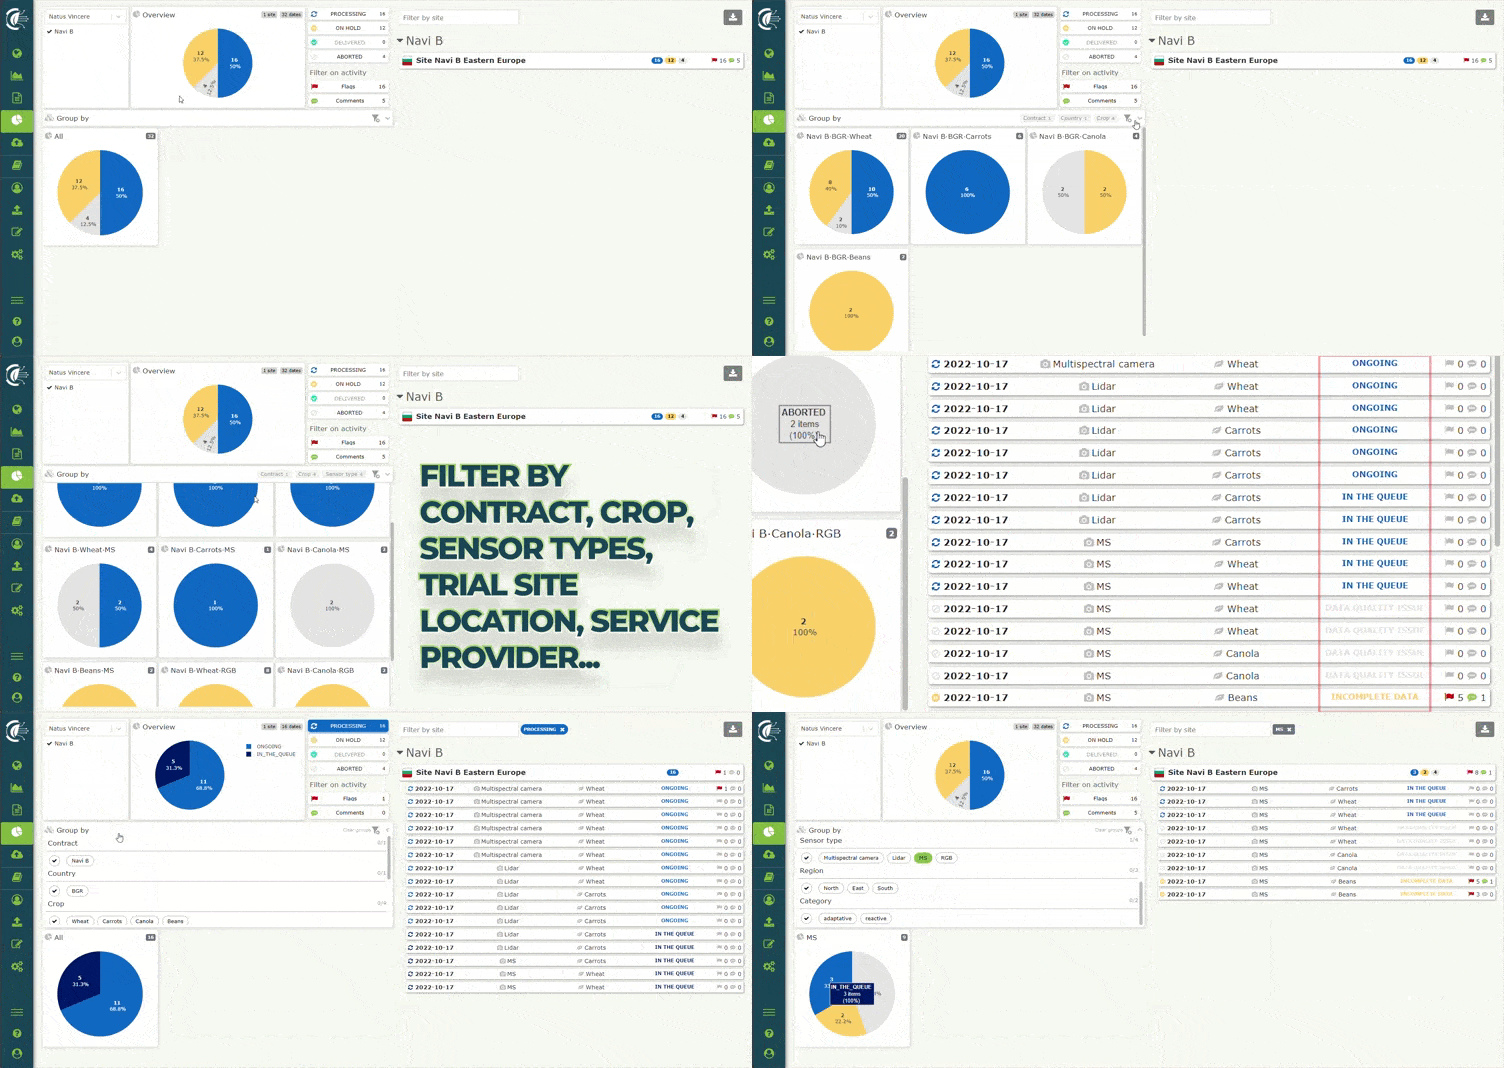
We have refreshed the design of the monitoring tool that keeps you informed of the data processing progress for each flight you upload. The page ergonomics has been improved and we added new filters based on your feedback. You can now group specific filters to get a more granular and custom progress tracking update. Filters include campaign, region, country, crop and sensor type.
You can also filter flags and comments posted by your Hiphen Campaign Manager in a more intuitive manner. This allows you to very efficiently focus on datasets that require your attention.
💎 User value: Get all the transparency you need about data processing progress, pinpoint flights that require attention and use this tracking tool for your own internal reporting.
⚙️ Use Cases:
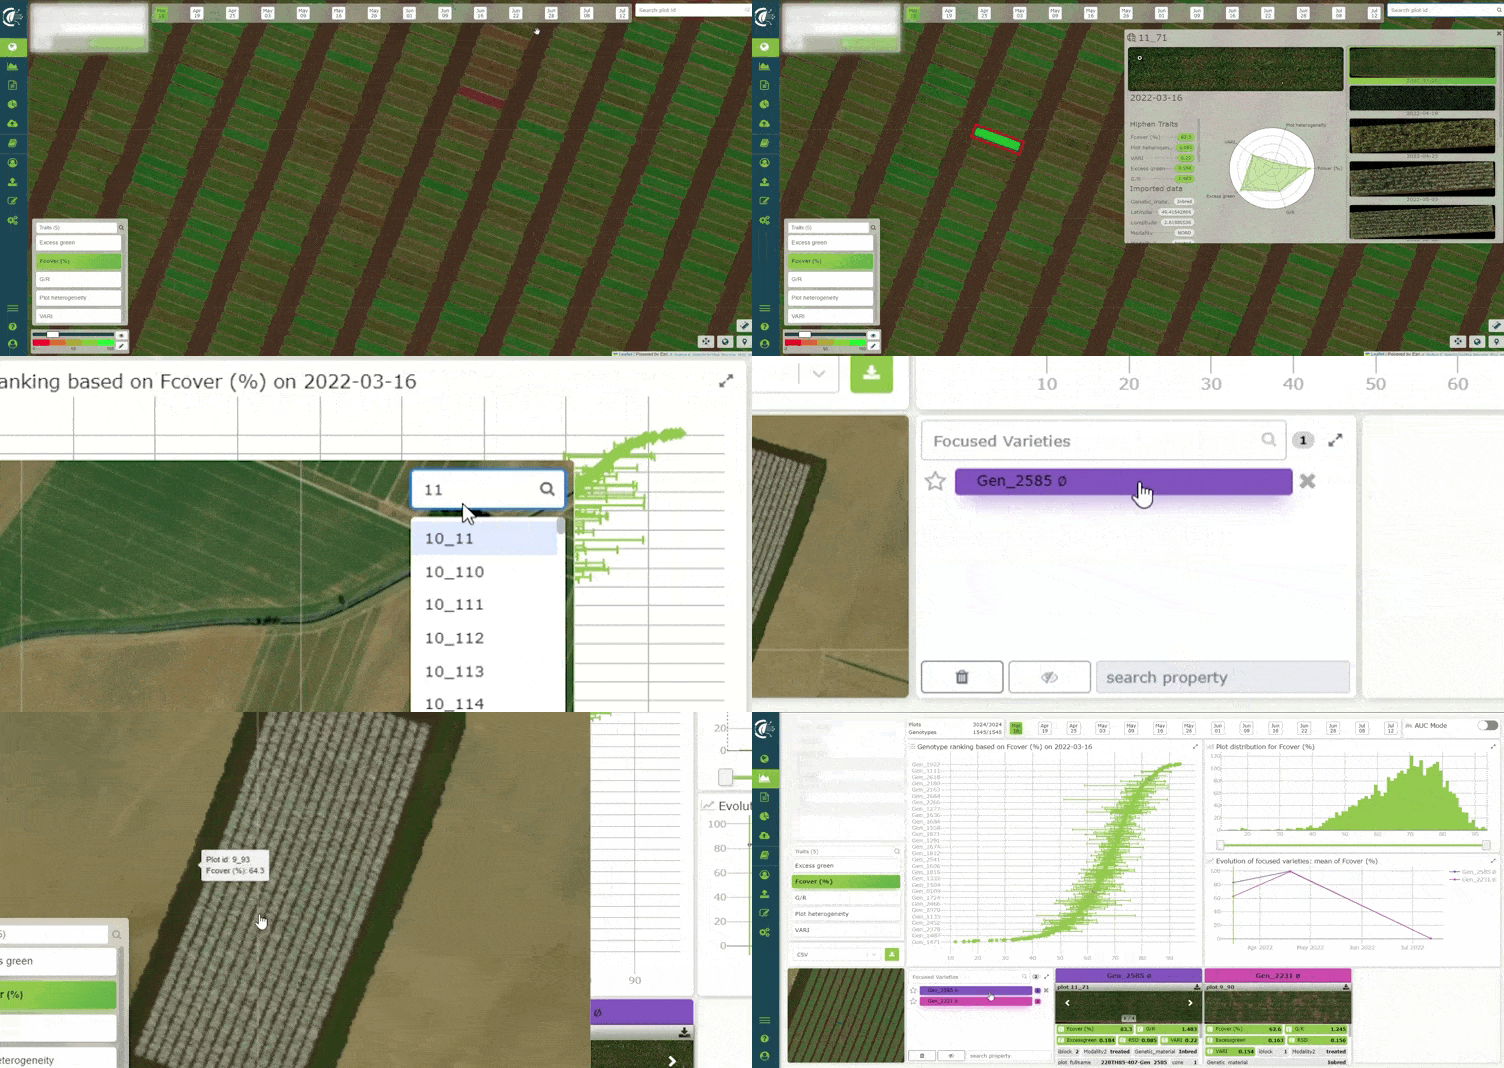
In the map and analytics pages, at the top right corner of the map, enter a specific plot name in the search bar to pinpoint its position on the plot map and select it.
Once the search bar is used, we will automatically suggest you to add the plot of interest to the 'plot exploration' section of the analytics page.
**💎 User value:**Save time exploring specific plots of interest.
⚙️ Use Cases:
For more information, reach out to your Hiphen Campaign Manager. Stay tuned for the next Cloverfield™ features release update next month.
Sincerely, Your Hiphen Success Team.
Plant phenotyping is a brick in the wall of agricultural research and plant breeding. It helps understanding how a plant is behaving in its environment, by assessing key information related to plant morphology, physiology, biochemistry, yield, and responses to biotic and abiotic stresses. Having access to such information enables us to understand plant dynamics to be able to predict how a variety will perform and produce in a specific environment. Phenotypic assessments, which are accessible by combining Genotypic information x Environment data, are mostly used to improve varietal selection and make it completer and more precise than the genomic approach, which relies on on the study of gene presence and performance through genotypic assessments.
Digital phenotyping is quite a new realm, companies like Hiphen were founded less than 10 years ago. Thus, such technology needs some time to be well-adopted and improved to unleash its full potential. Nonetheless plant phenotyping by itself is not something new, it has existed for ages since agronomists got eyes and can measure plants manually. But most of those manual techniques are either often destructive or time-consuming. However, the rising of digital phenotyping by leveraging new technologies has seen the use of sensors and imaging platforms emerging as a fast and efficient approach to quantitatively assess plant characteristics i.e., phenotypes, in a non-destructive way. And at Hiphen we believe that the use of those sensors to create data fusion enables more accurate and repeatable assessments, in a high-throughput fashion, based on the theory of the 6 dimensions of phenotyping.
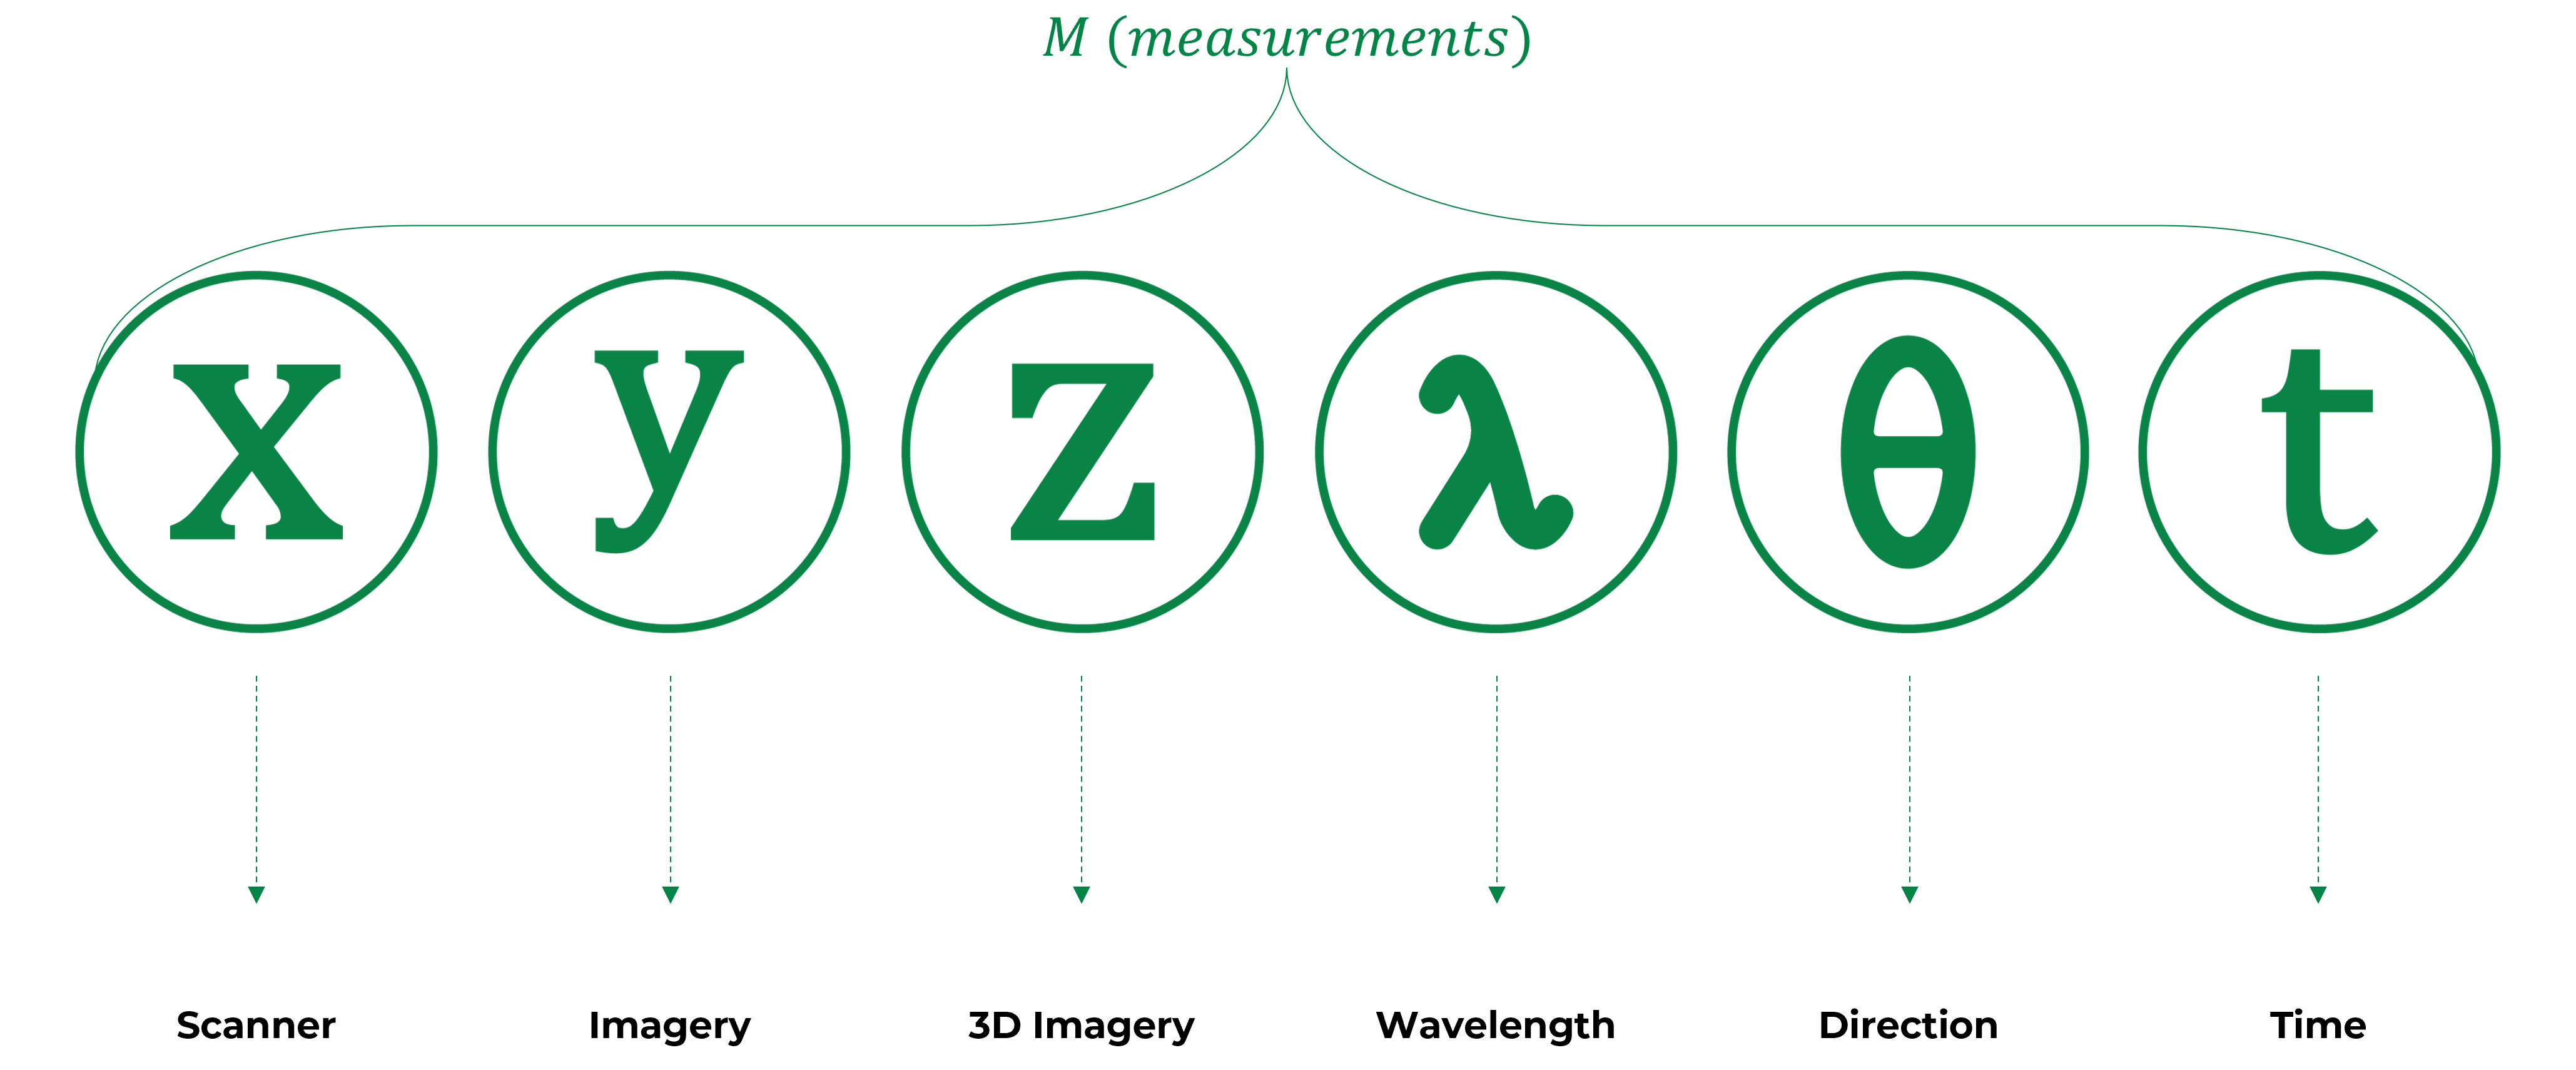
Different imaging platforms can be used for field and indoor phenotyping to process data about those 6 dimensions, like Hiphen's Cloverfield, and those platforms are using data collected from various sensors. Commonly used imaging technologies include visible light imaging, thermal imaging, 3D imaging, chlorophyll fluorescence, hyperspectral imaging, and tomographic imaging. So, let's take a deeper dive into the sensor technologies accessible for agricultural imaging nowadays.
Several imaging platforms are utilized for both field-focused and indoor plant phenotyping. These platforms gather data from various sensor types to obtain a comprehensive understanding of plant traits. Some of the commonly used imaging techniques include:
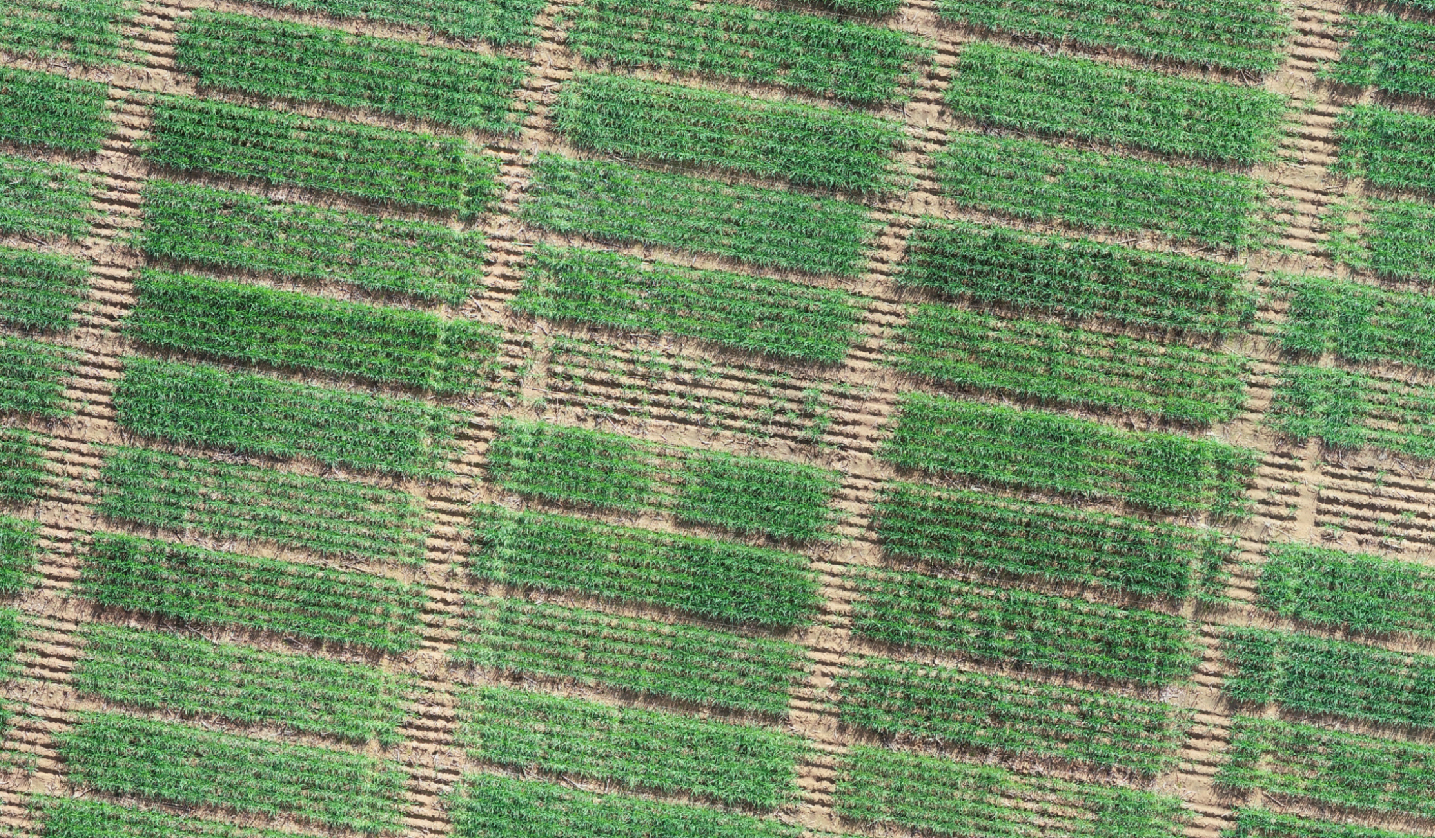
RGB image of plots with emergence issues.
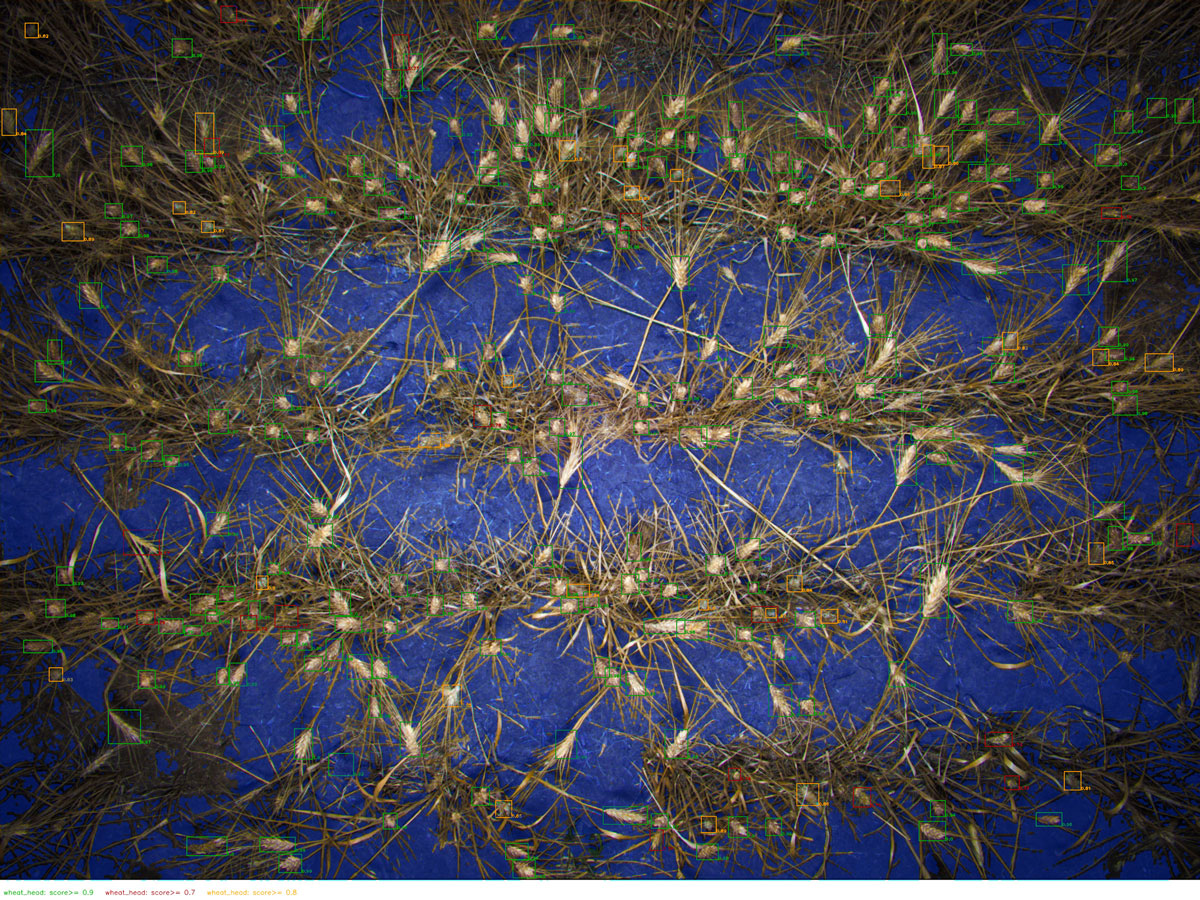
Segmented and annotated RGB image of wheat heads.
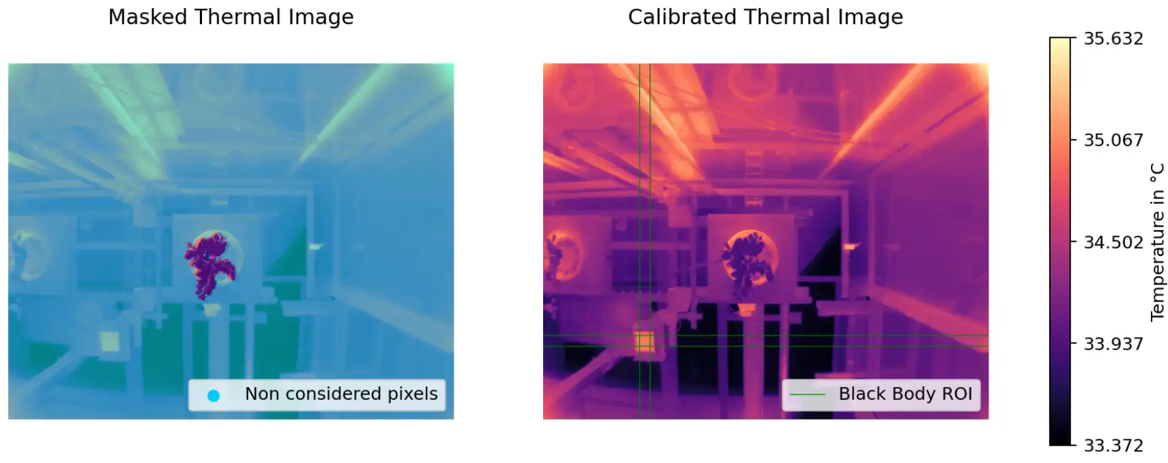
Thermal assessment of trees in greenhouse – Here we can see Data fusion in action combining RGB imagery with thermal to estimate precisely leaf temperature.
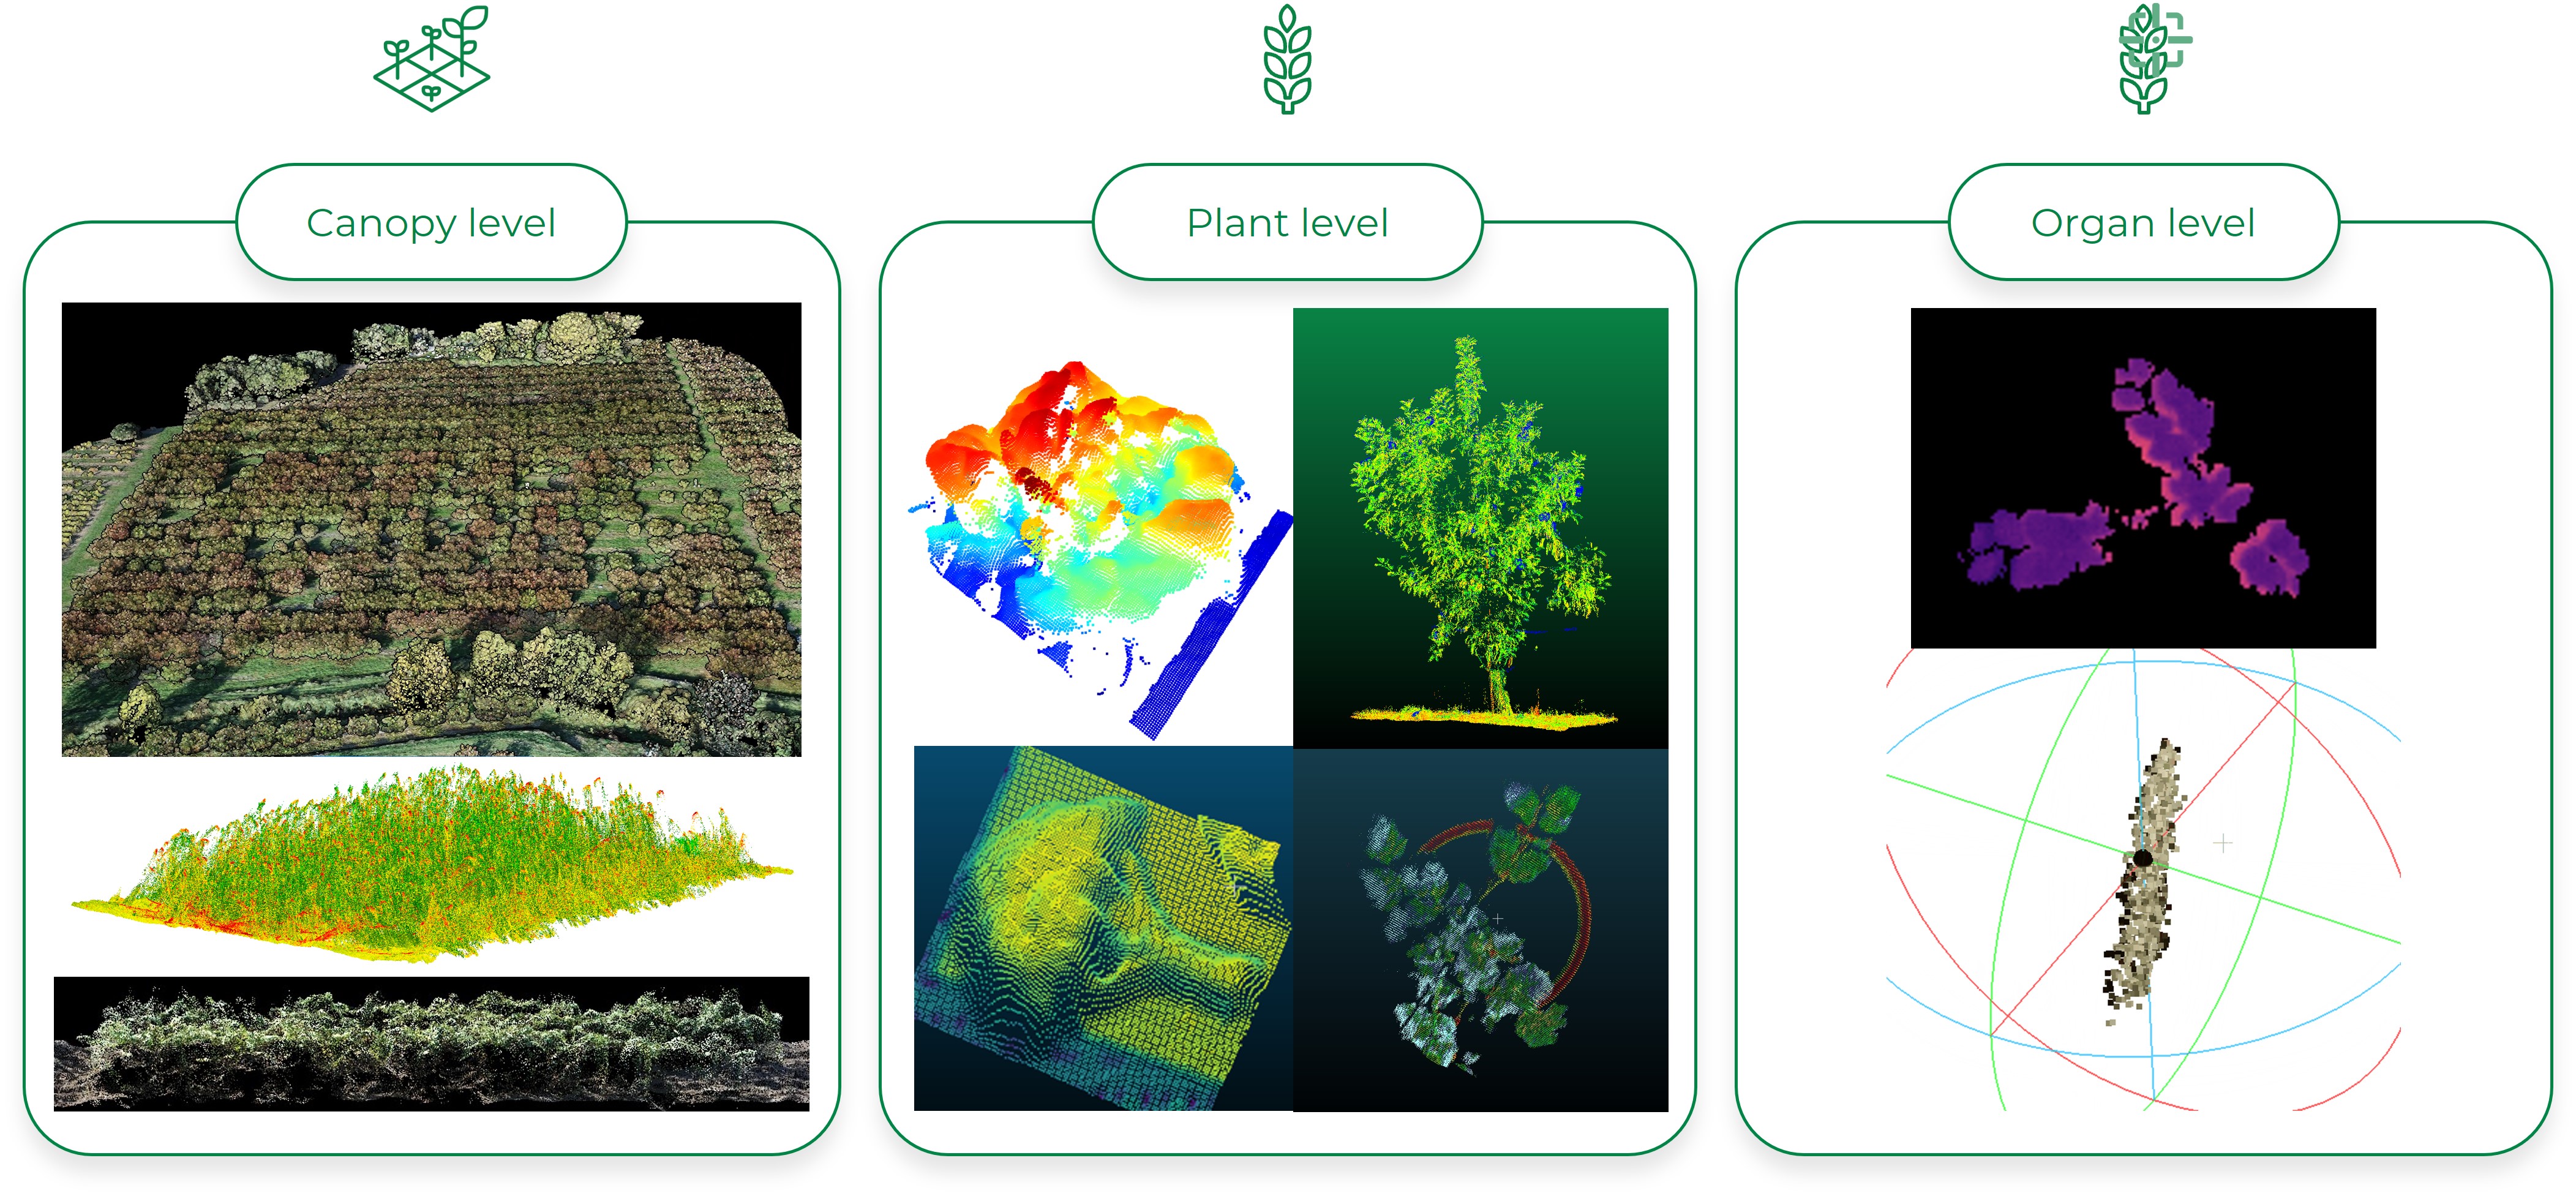
3D sensing equipment helps accessing information about crops at all plant levels.
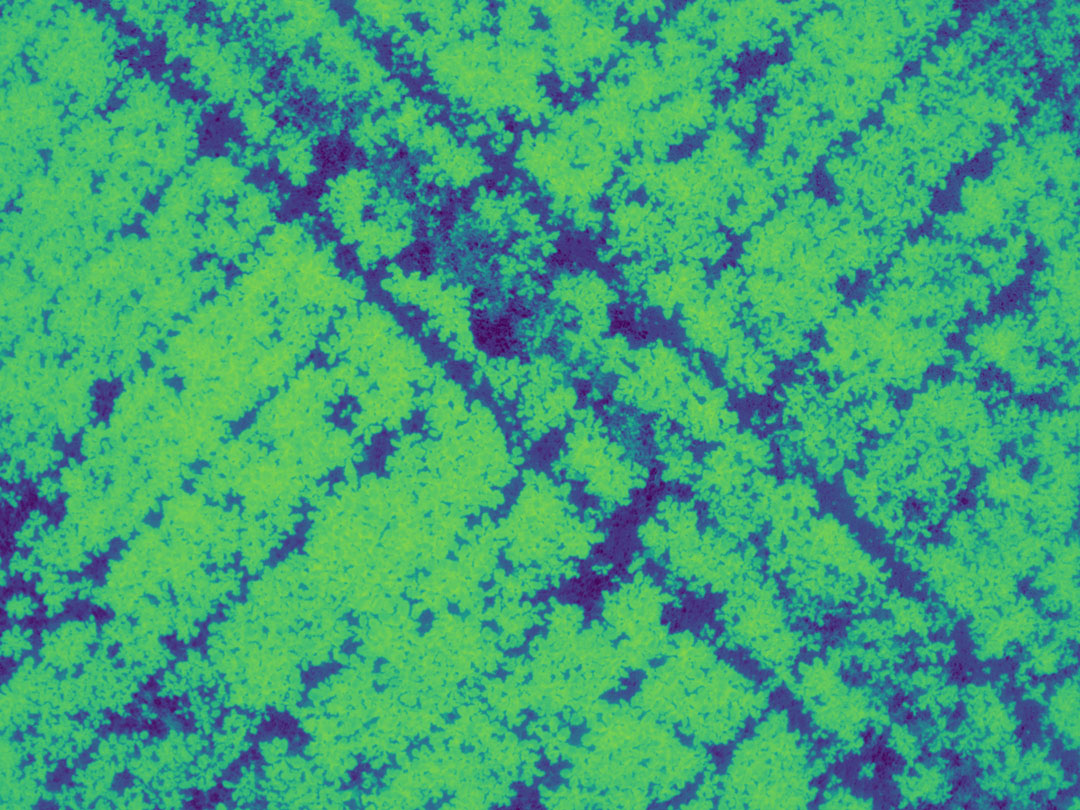
NDVI image captured from UAV.
Fluorescence Imaging: Fluorescence imaging involves measuring the light energy emitted when the plant absorbs shorter wavelength radiation, mainly through the chlorophyll complex. The emitted fluorescence is a tiny fraction (<3%) of the total radiation emitted by the light source to the object. The amount of re-emitted light (fluorescence) is a reliable indicator of the plant's ability to use the absorbed light and is used to estimate the overall health status of the plant. Fluorescence imaging is utilized to estimate photosynthetic efficiency and other associated metabolic processes affected by biotic and abiotic stresses. However, this technique does not specify the cause of variations in the plant signal, such as light, temperature, or other environmental factors.
Tomographic Imaging: Other imaging techniques, such as Magnetic Resonance Imaging (MRI), X-ray Computed Tomography (CT), and Positron Emission Tomography (PET), provide high-resolution 3D images of single plants or plant parts. MRI captures 3D images of internal structures, allowing non-invasive quantification of static and dynamic traits, such as structural, biochemical, and temporal changes inside the plant. X-ray CT visualizes the 3D structures of both internal and external plant features at the micro or macro level. These imaging techniques are time-consuming and not suitable for processing substantial amounts of data. Additionally, their large size and weight prevent their use on aerial imaging platforms.
The selection of sensor technologies depends on the specific assessments' researchers aim to perform. Companies like Hiphen are proficient in guiding researchers in identifying the most appropriate sensors and traits for their needs. Data-driven decisions and insightful research based on phenotypic data assessments are key to enhancing agricultural practices, improving crop yields, and ensuring food security for the growing global population.
In conclusion, imaging technologies for plant phenotyping have made significant strides in recent years, and their integration with digital phenotyping has brought new opportunities for advancing agricultural research and plant breeding. As these technologies continue to evolve, we can expect even more sophisticated and efficient ways to understand plant dynamics and harness their full potential to address the challenges of modern agriculture. The future of plant phenotyping is promising, and it holds the key to sustainable and efficient food production for the years to come.
Sincerely,
Your Hiphen Team.
Topic brought to you by Marc LABADIE – Project Leader at Hiphen.
In the digital agriculture realm, generating accurate plot patterns of your field trial is crucial for optimal crop monitoring to understand plant dynamics through time. To achieve this, the accurate and precise mapping of your plots, also known as plot mapping or parcellaire generation, plays a pivotal role. In recent years, the integration of deep learning techniques has revolutionized the process, enabled automated plot map generation, and offered a myriad of benefits for agricultural research and production. In this blog post, we will explore the importance of plot mapping, the advantages of using deep learning for automation, and how it impacts the agricultural ecosystem.
Traditionally, creating plot maps was a labor-intensive task involving manual measurement and mapping techniques. However, with the advent of deep learning algorithms, this process has been significantly streamlined. Deep learning models can automatically segment and delineate agricultural land into distinct plots, saving valuable time and effort for farmers, agronomists, and researchers. By automating this process, researchers can allocate their resources more efficiently and focus on other critical aspects of field trial management.
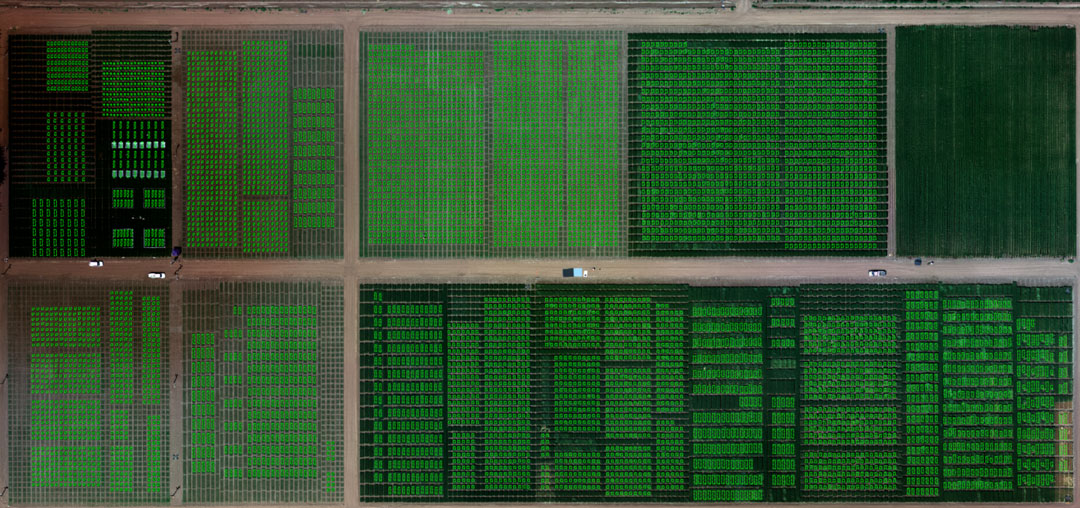
Big plots trial – Automating plot mapping with digital tools is highly helpful.
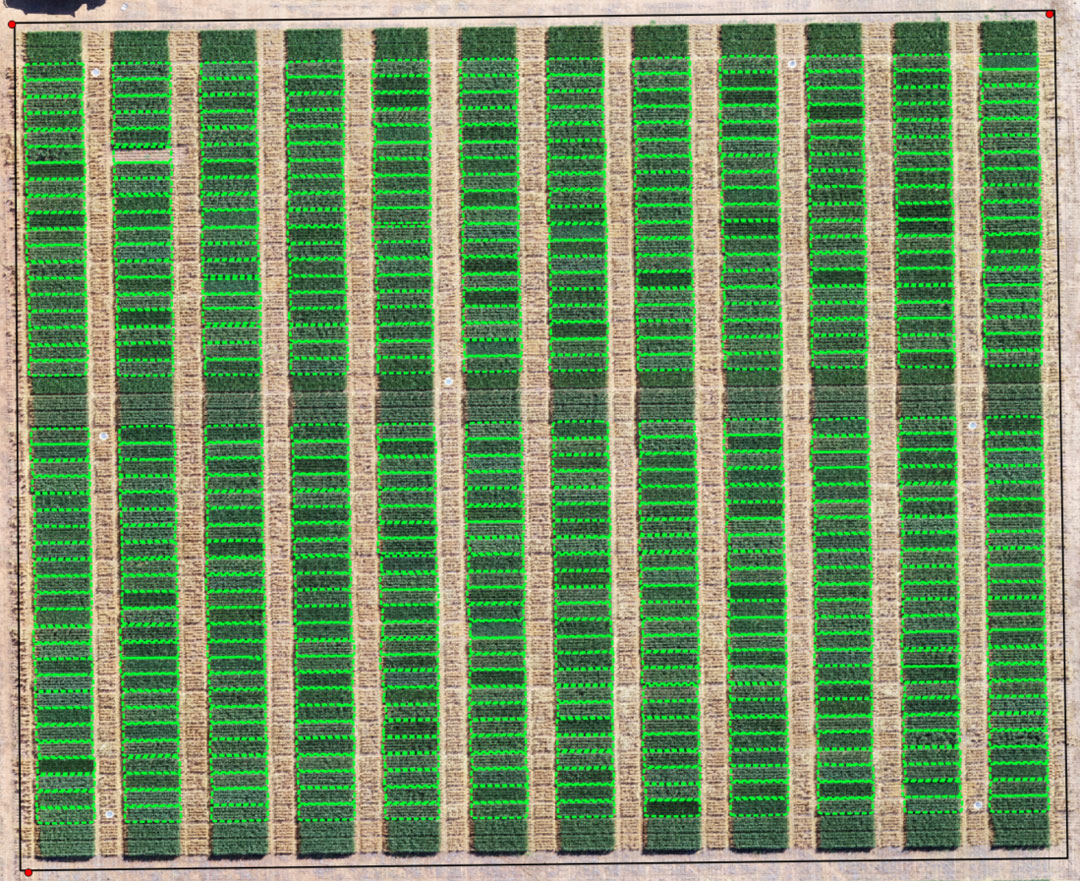
Small plots trial – Plot map still could be done manually but automation make it even more easy.
One of the remarkable advantages of using deep learning algorithms for plot map generation is the ability to achieve higher precision compared to manual mapping methods. Deep learning models can analyze aerial or satellite imagery, topographic data, and other relevant information to accurately identify plot boundaries.
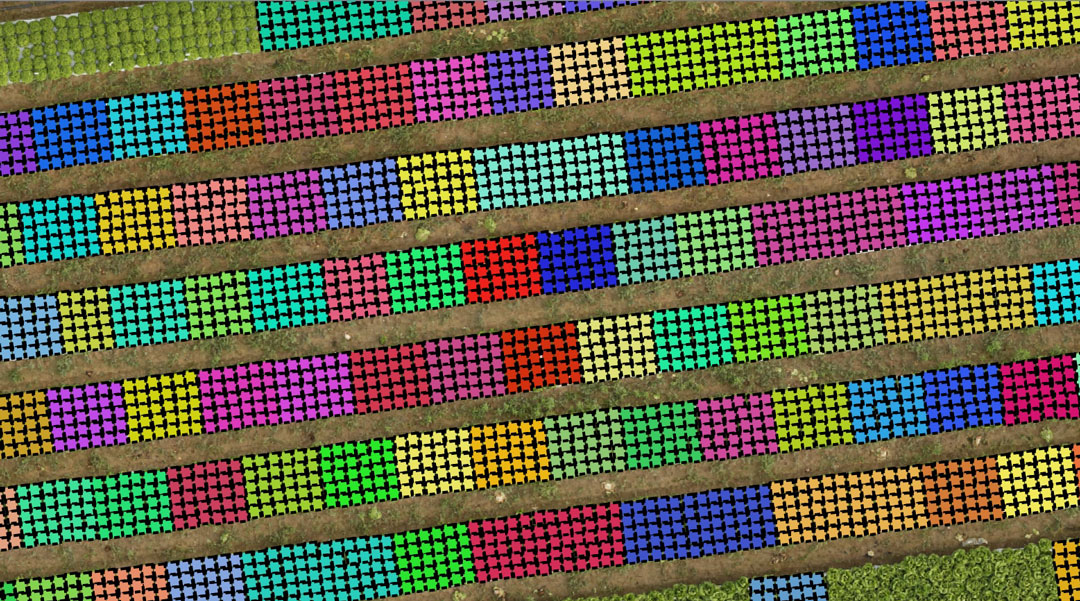
Example of automated plot mapping of salad field from UAV imagery.
Accurate plot maps generated through deep learning algorithms have a direct impact on the processing of phenotypic data collected for each plot. Phenotypic data is the result of plant assessments like canopy development, stress and disease resilience, yield predictions and more, is essential for agricultural research and breeding programs. By having precise plot boundaries, researchers can associate specific phenotypic data with corresponding plots, enabling more accurate analysis and interpretation of plant assessment distribution within the entire field trial. This granular information facilitates the identification of patterns, trends, and correlations, ultimately leading to informed decision-making for crop research and production.
To achieve reliable and versatile deep learning models for plot map generation, robust training datasets are paramount. High-quality datasets that encompass diverse geographical regions, crop types, and plot patterns variations and orientation are essential for training models to identify plot boundaries effectively within images captured in various environments. This emphasizes the need for collaboration and data sharing within the agricultural community to develop comprehensive datasets that can improve the accuracy and applicability of deep learning models for plot map generation.
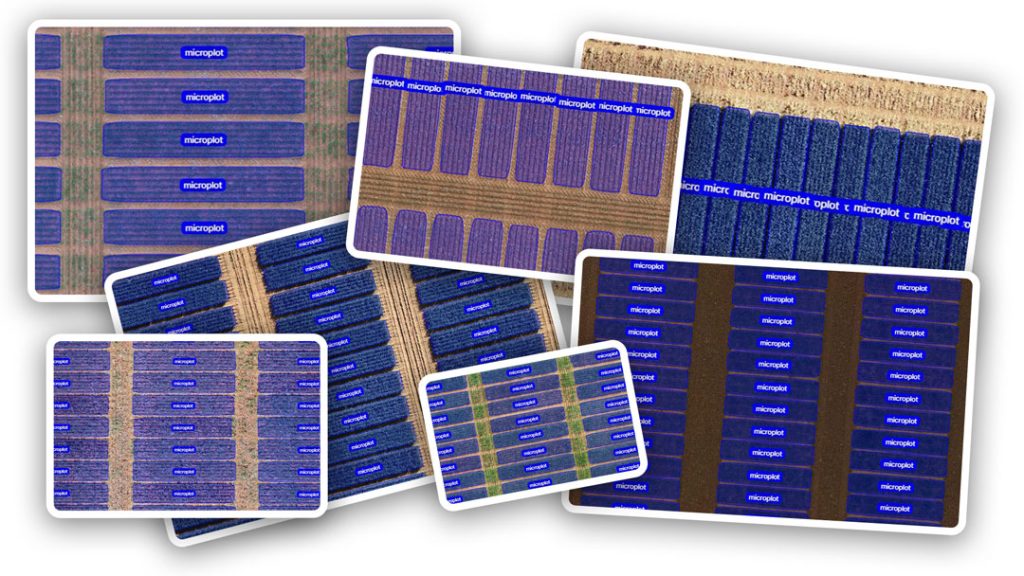
Set of images of plots in various conditions used for training DL models.
At Hiphen, we specialize in developing digital plant assessment solutions for agricultural research and production. We understand the significance of plot map generation and the transformative potential of deep learning in the agricultural sector. Our expertise lies in leveraging cutting-edge technologies to empower our clients with accurate and automated plot mapping alongside data acquisition and processing, enabling them to make better decisions and adapt to ever-changing environmental conditions. Through our tailored AI solutions, we strive to revolutionize the agriculture industry, promote sustainable practices, and enhance crop researchers productivity.
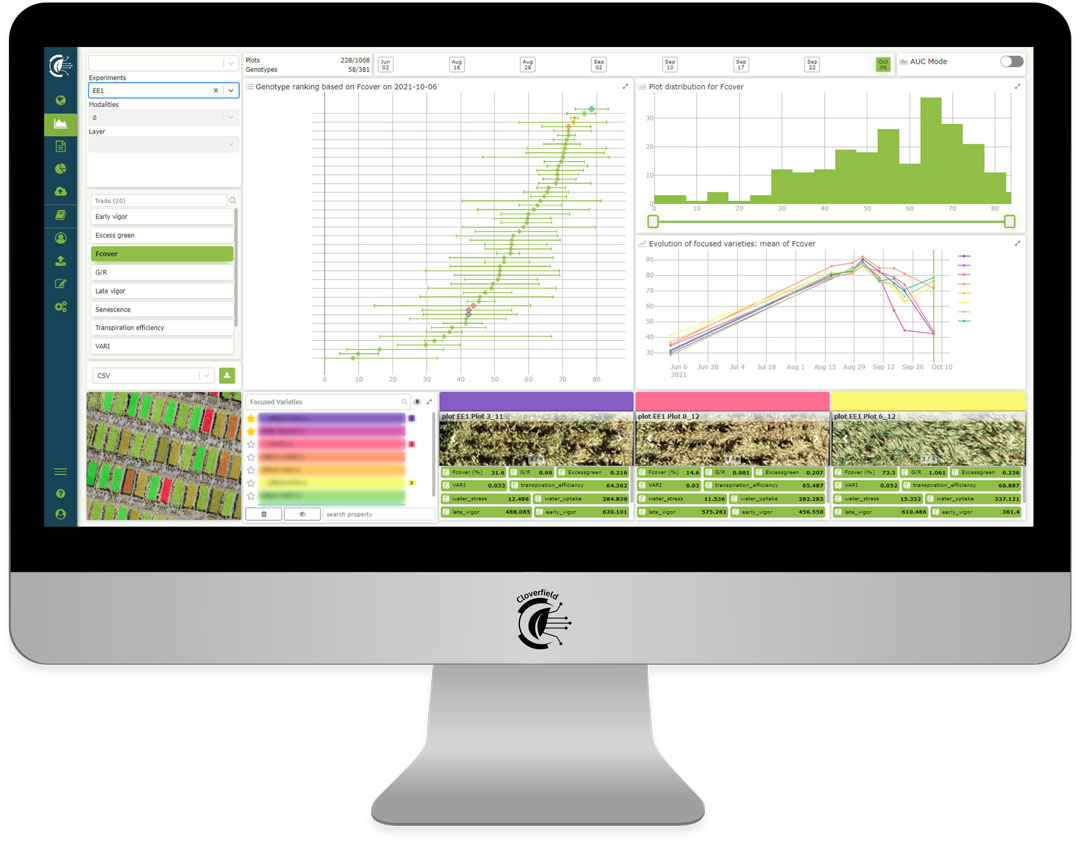
View of Hiphen's Cloverfield™ Data Platform.
Plot map generation holds immense importance for agricultural research and production. By utilizing deep learning algorithms, we can automate the process, saving time and improving precision. Accurate plot maps enable efficient resource allocation and precise data processing. However, it is vital to build robust training datasets to ensure the reliability and versatility of deep learning models. With Hiphen's AI methodologies, the agricultural industry can embrace innovation, make informed decisions, and adapt to the evolving needs.
Sincerely,
Your Hiphen Team.
Topic brought to you by Rhianna MCANENY – Image Processing Specialist @Hiphen.