
Our products
Backoffice
Cloverfield v3.5.1 – April 25th, 2025
New features have been added to Cloverfield™, your online digital phenotyping data platform. This release includes tailored new features for plant breeding, crop protection & nutrition and also production fields to let you make decisions earlier in the season, so you can maximize time and resources.
Among these new features you'll find powerful new dashboards in the 'Analytics' tab:
This new analytic dashboard empowers plant breeders to map the diversity of the genetic material represented within their field trials. This feature allows for a fast, in-season analysis of diversity from phenotyping data, to inspect the different clusters responsible for your genetic diversity, to analyze the correlation between the calculated traits and your ground truth assessments (manual measurements or validation data), and to be able to make decisions earlier and maximize the impact of your trial.
How to access it in Cloverfield™?
You’re ready to analyze the diversity clusters of your trial!
This also new analytics dashboard allows for a fast and direct analysis of your modality performance within a product testing trial. This integrated ANOVA tool helps to quickly determine the multifactorial equation explaining the variability of your modalities from the calculated traits so you can streamline your analysis of which treatment is statistically relevant within your trial program and target the best performing modalities overall. This feature breaks down in 3 steps: Multifactorial equation definition + ANOVA computation + post-hoc test (Tukey HSD) for pairwise comparison.
How to access it in Cloverfield™?
This feature is tailored for production fields and On-Farm Experiments allowing to fuse data from multiple vectors like satellite heterogeneity map with RGB imagery from Literal, to assess the heterogeneity of the field and locate precisely sampling zone and perform non-destructive assessments of your crops to investigate further what’s going on in your field or experiment. Through accurate data collection and processing, this solution is aiming at helping you evaluate the performance of new agricultural practices and optimize harvest logistics for instance.
How to access it in Cloverfield™?
Log into your Cloverfield™ account now to discover the new features online! And for more information, please reach out to your Hiphen Campaign Manager.
Stay tuned for new Cloverfield™ features release next month.
Sincerely,
Your Hiphen Success Team.
Cloverfield v3.0 – November 6th, 2024
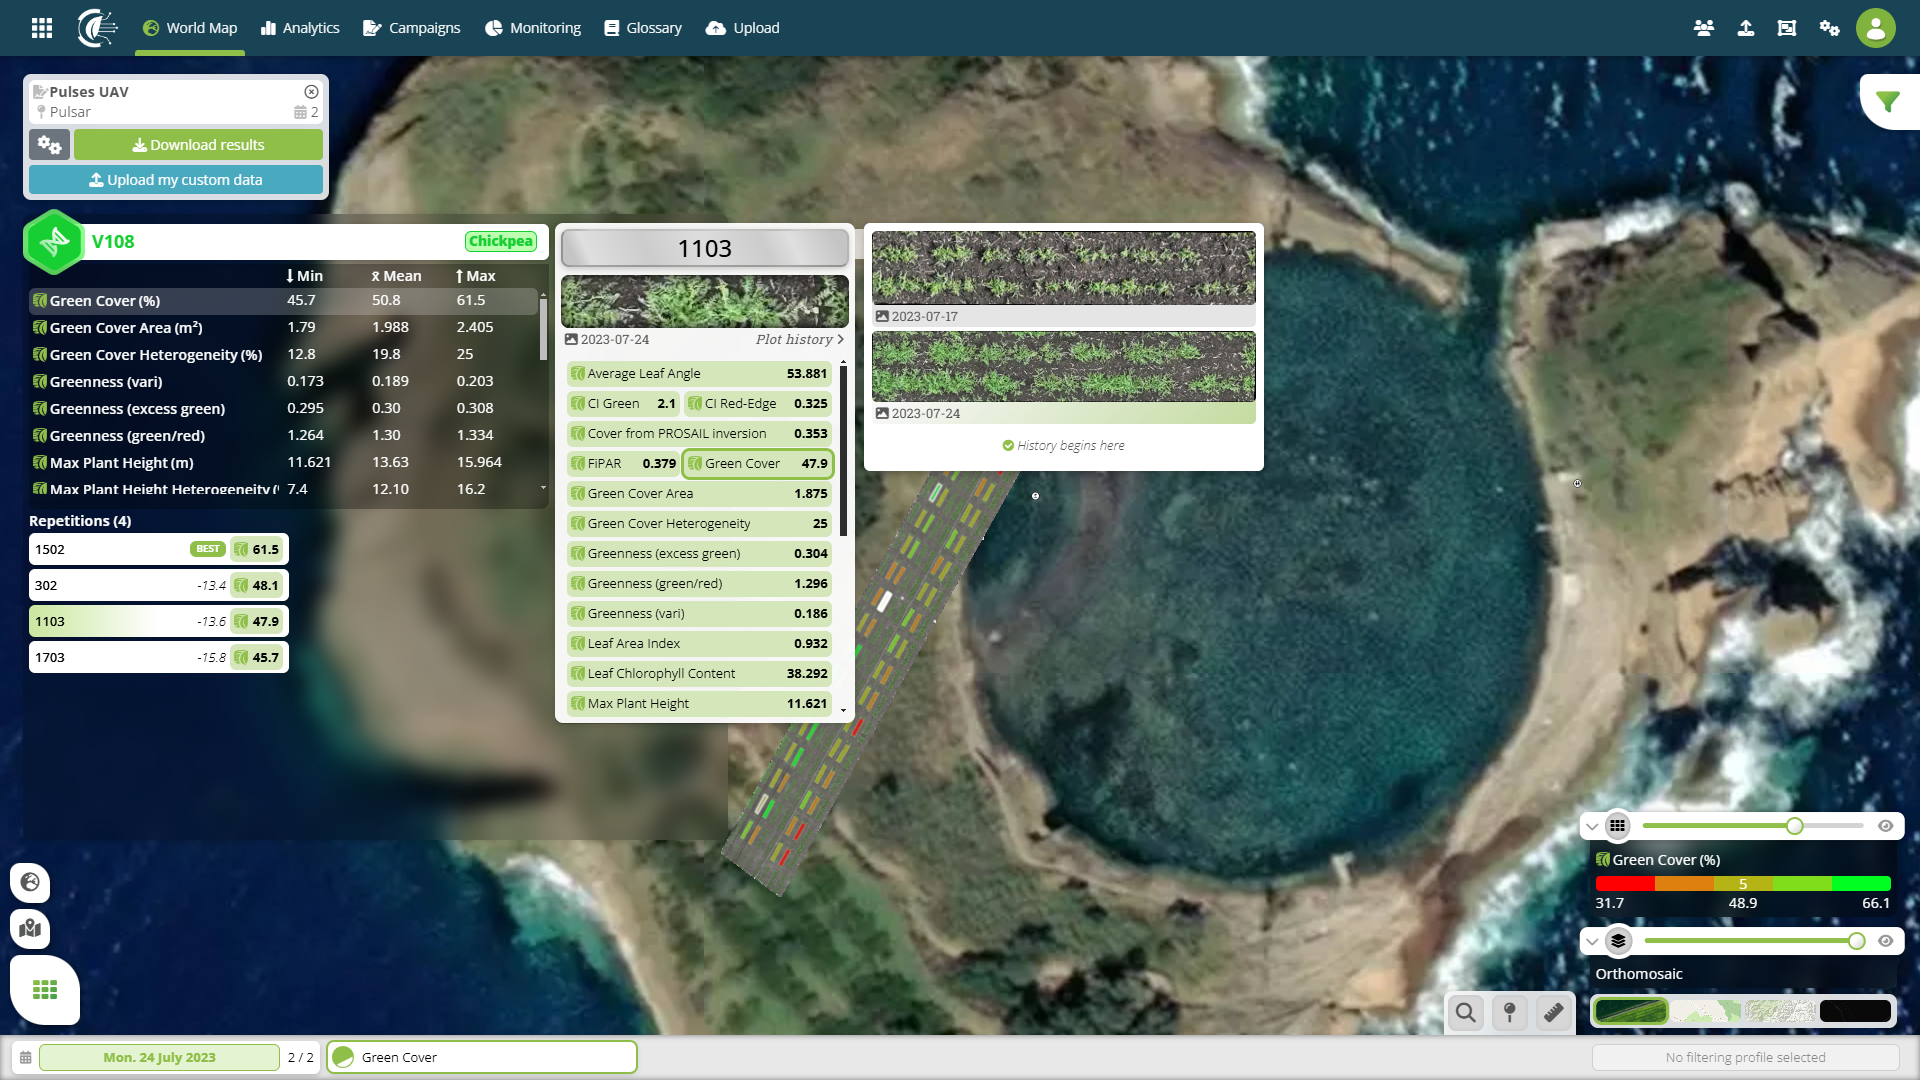
Your Cloverfield™ data platform has a fresh new look!
With this software update, we introduce a fully redesigned web interface, adding even more value to your phenotyping data experience:
Thanks to your feedback and update requests, our software roadmap for the year to come is packed with user interface improvements and new analytic functionalities.
Introducing the new, streamlined Cloverfield web interface! We've given it a fresh look to enhance your experience with phenotyping data:
With these Cloverfield software updates, managing your phenotyping data is more efficient and user-friendly than ever, all in one place!
Log into your Cloverfield™ account now to discover the new features online! And for more information, please reach out to your Hiphen Campaign Manager.
Stay tuned for new Cloverfield™ features release next month.
Sincerely,
Your Hiphen Success Team.
Cloverfield v2.20.0 – September 10th, 2024
New features have been added to Cloverfield™, your plant phenotyping online platform. With these additions, we continue to make your digital phenotyping journey frictionless and to allow you to optimize your breeding schemes with always more advanced and efficient analytical capabilities.
New features include:
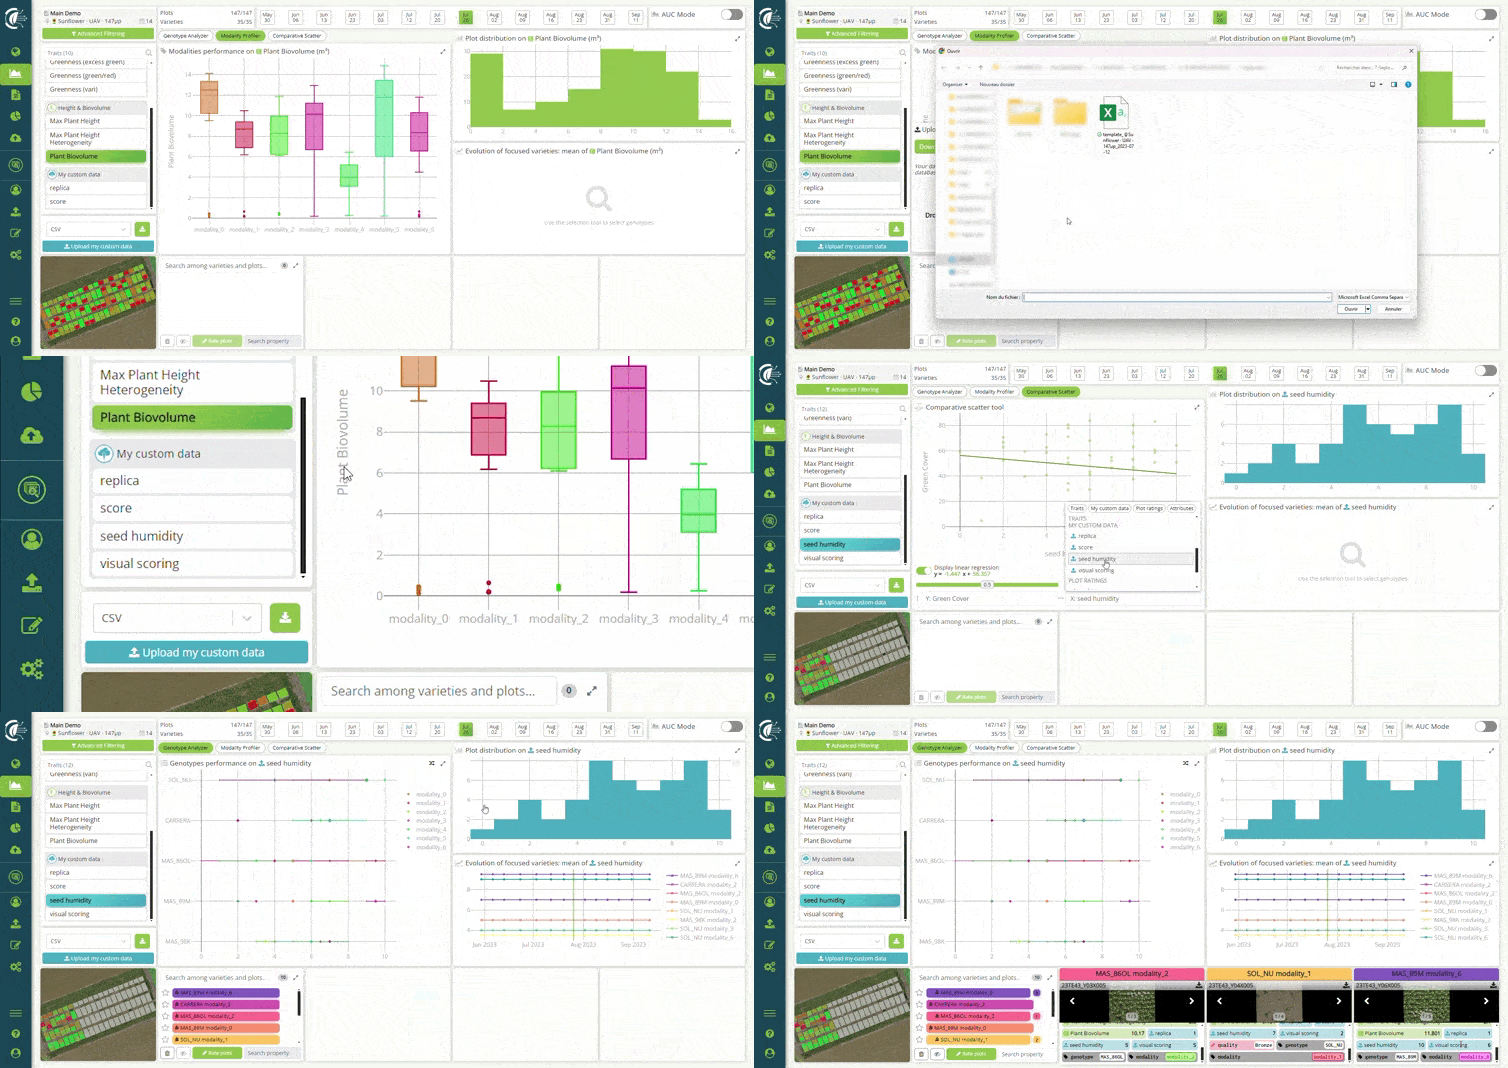
Easily upload your own data (such as visual scoring, yield, experimental design attributes, lab measures, etc.) and access this data in different sections of Cloverfield: Analytics, Maps and Advanced Filtering. Use our Excel template to package and import your data and your custom metrics will appear as a new trait in Cloverfield next to your favourite drone traits. For instance, the Comparative Scatter Plot will now let you plot one of your custom metric (e.g. disease scoring) on the x-axis against any drone trait (e.g. chlorophyll content) in the y-axis, and let you navigate the correlation coefficients across time.
Important: Your uploaded data is not stored on our servers and is only available to you during your web session. It is only cached in your browser and will disappear once your cache is refreshed or when you close your session. Saving your data in our server to keep it available to you and your team is done by your project manager upon your request.
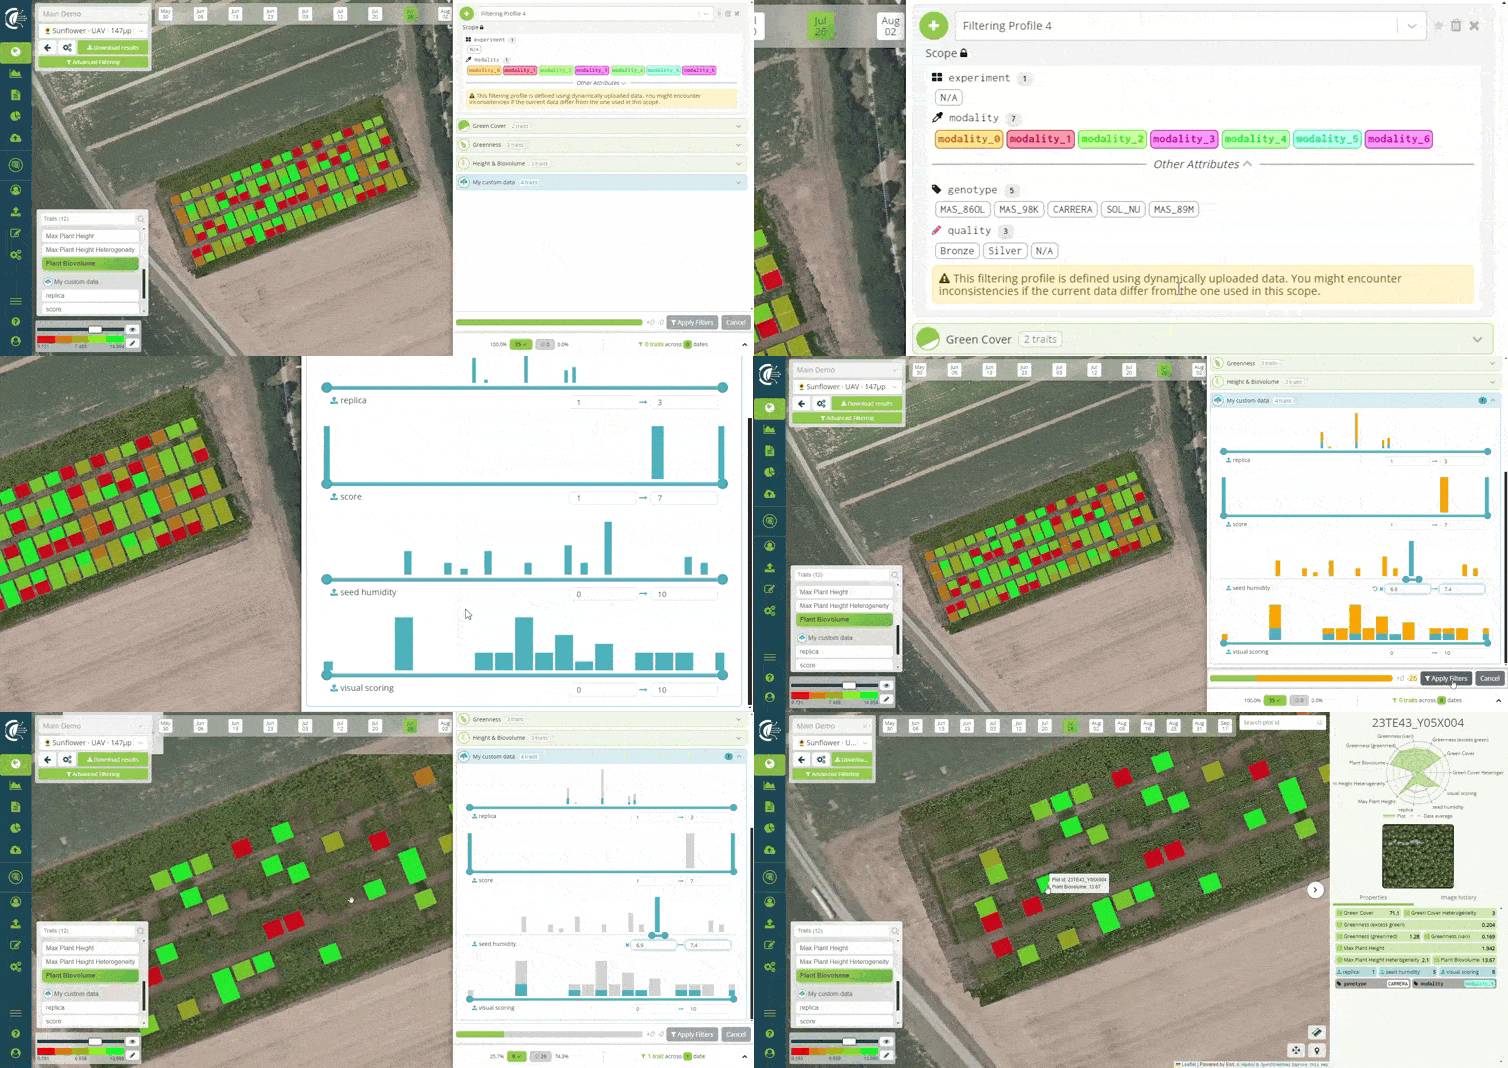
Now, you can filter your experiments faster than ever. The Advanced Filtering tool allows you to identify the top performing varieties or modalities across multiple factors. For instance, if you are running breeding nurseries, you can use it to very efficiently eliminate materials that do not match multiple criteria such as drone traits (e.g., flowering precocity, vigor, biovolume, fruit count) and your custom metrics (e.g., brix ratings from your lab measures). Simply select the drone traits and custom metrics, place your thresholds for each using the sliders and filter dynamically your experiment's material in a flash.
The custom data that you uploaded in Cloverfield will appear in Advanced Filtering tool in the attributes table and under the My Custom Data category marked in blue.
Log into your Cloverfield™ account now to discover the new features online! And for more information, please reach out to your Hiphen Campaign Manager.
Stay tuned for new Cloverfield™ features release next month.
Sincerely,
Your Hiphen Success Team.
Cloverfield v2.16.0 – June 26th, 2024
New features have been added to Cloverfield™, your plant phenotyping online platform. With these additions, we continue to make your digital phenotyping journey frictionless and to allow you to optimize your breeding schemes with always more advanced and efficient analytical capabilities.
New features include:
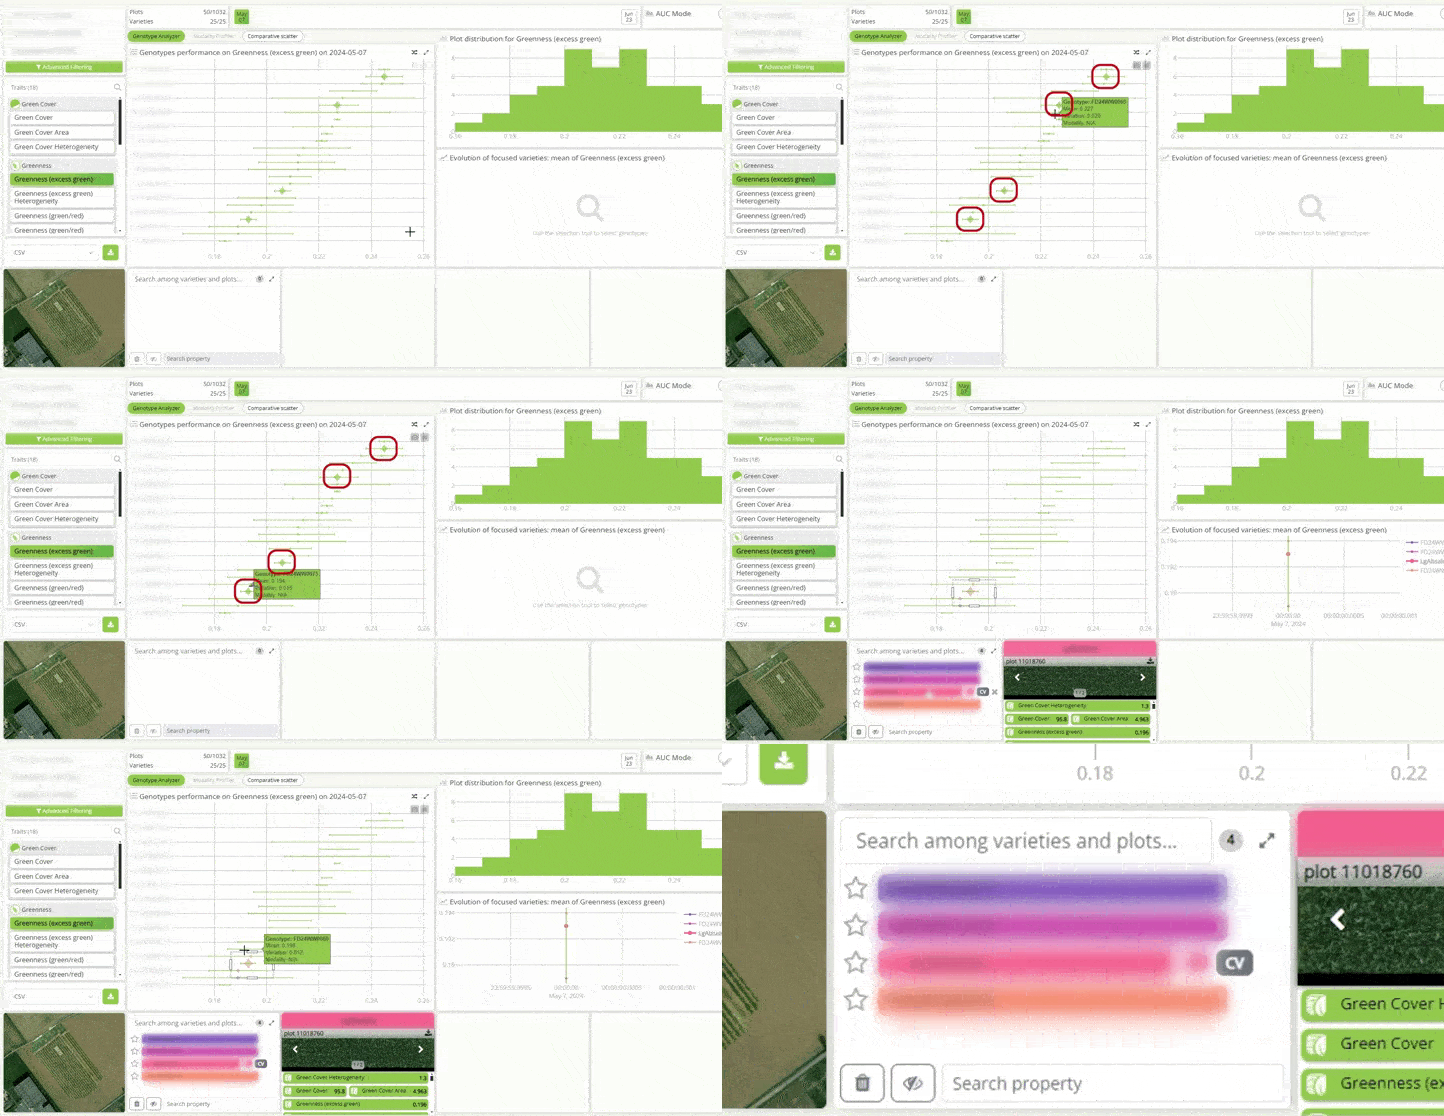
Declare your control varieties (check plots) within your trial and identify them clearly in the Analytics section in Cloverfield for better trait analysis.
User value: This functionality helps to enhance your analytics.
Use case: Very efficiently benchmark your plots or genotypes against your control varieties (check plots) within your trial.
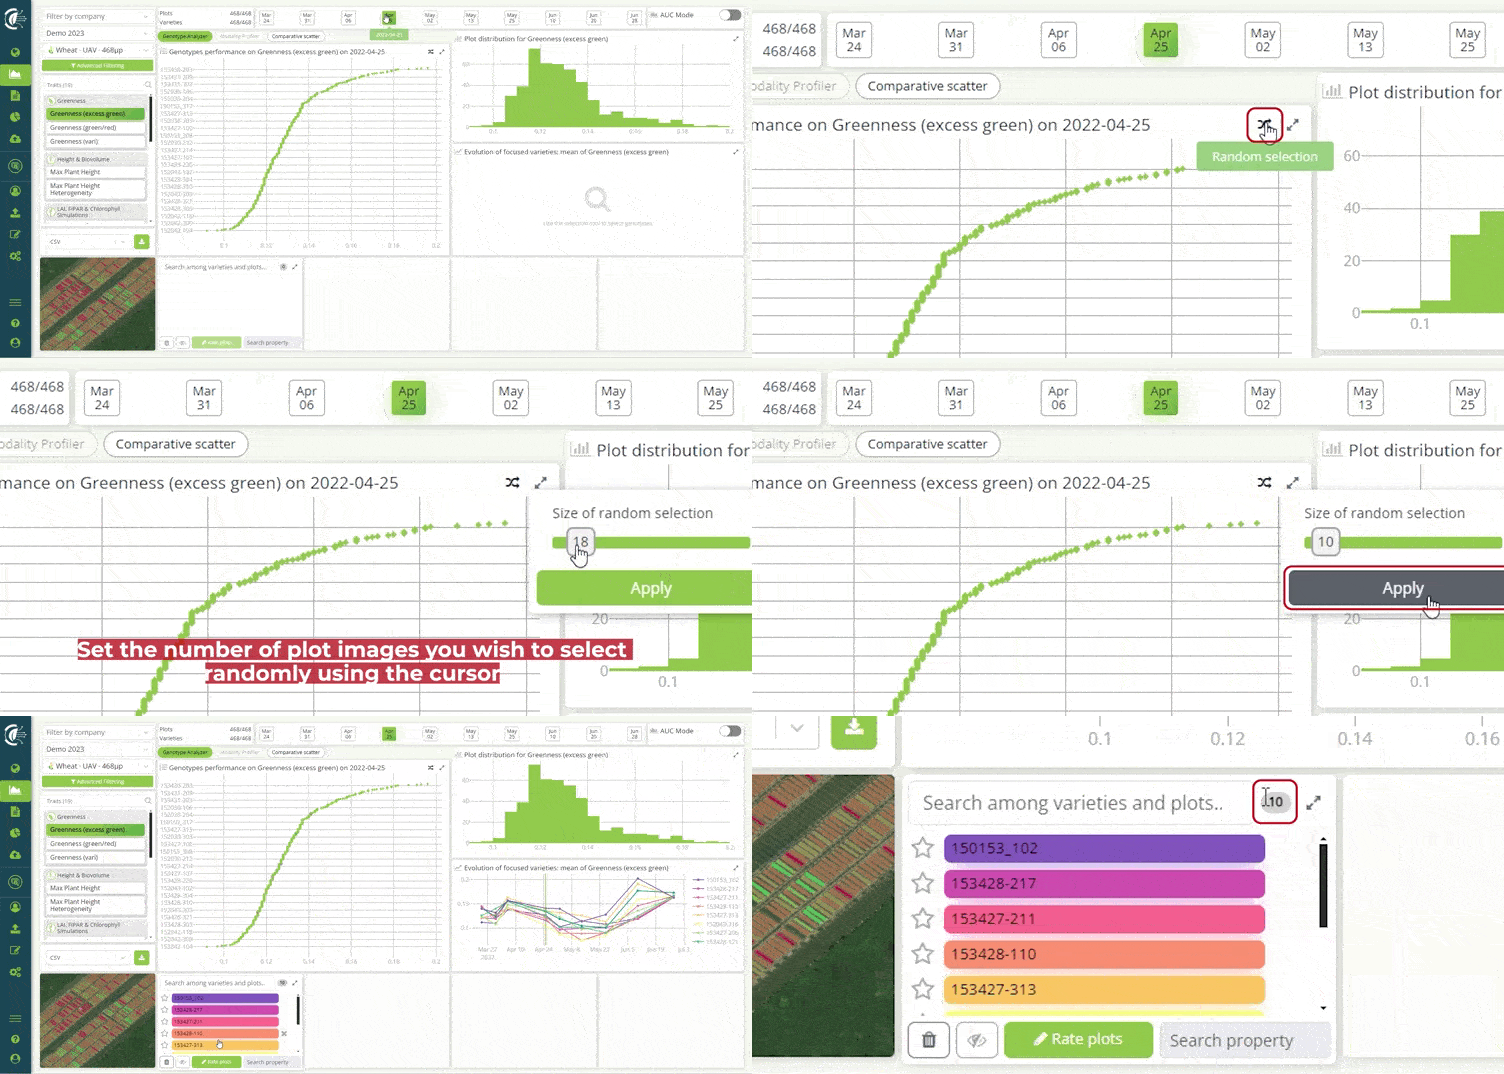
This new feature has been added to allow you to select a random sample of plot or genotypes in a few clicks. Simply select the sample size of interest and analyze your selection or use it to score visually your plots and genotypes via the Plot Rating tool.
User value: This feature paves the way for phenomic prediction use cases and more advanced analytical projects.
Use Cases: Select a random sample of plots or genotypes and visually score them (e.g., disease score, or lodging score). Then let us extrapolate your visual scores to the rest of the trial.
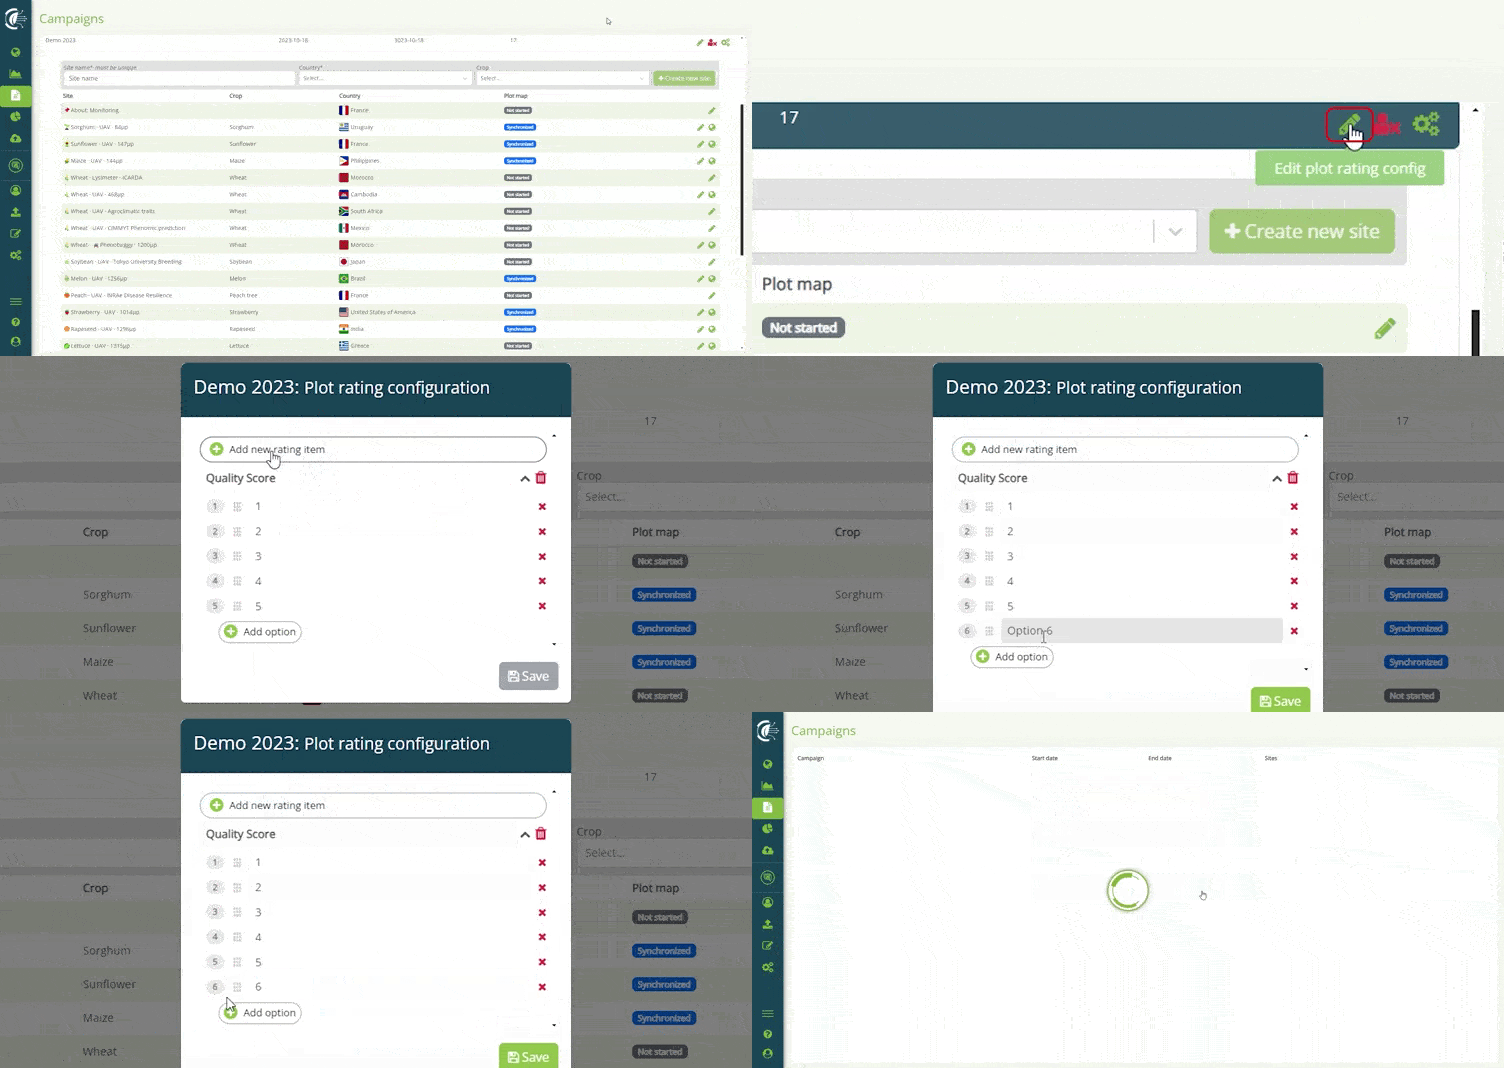
You can visually score your plots and genotypes directly via the Analytics section in Cloverfield. With this update, you can autonomously declare your scoring range and scales, whether you want a disease score ranging from 1 to 9 or categorical values such as "low", "medium", high". You can cumulate different scales during your visual assessment through Cloverfield™.
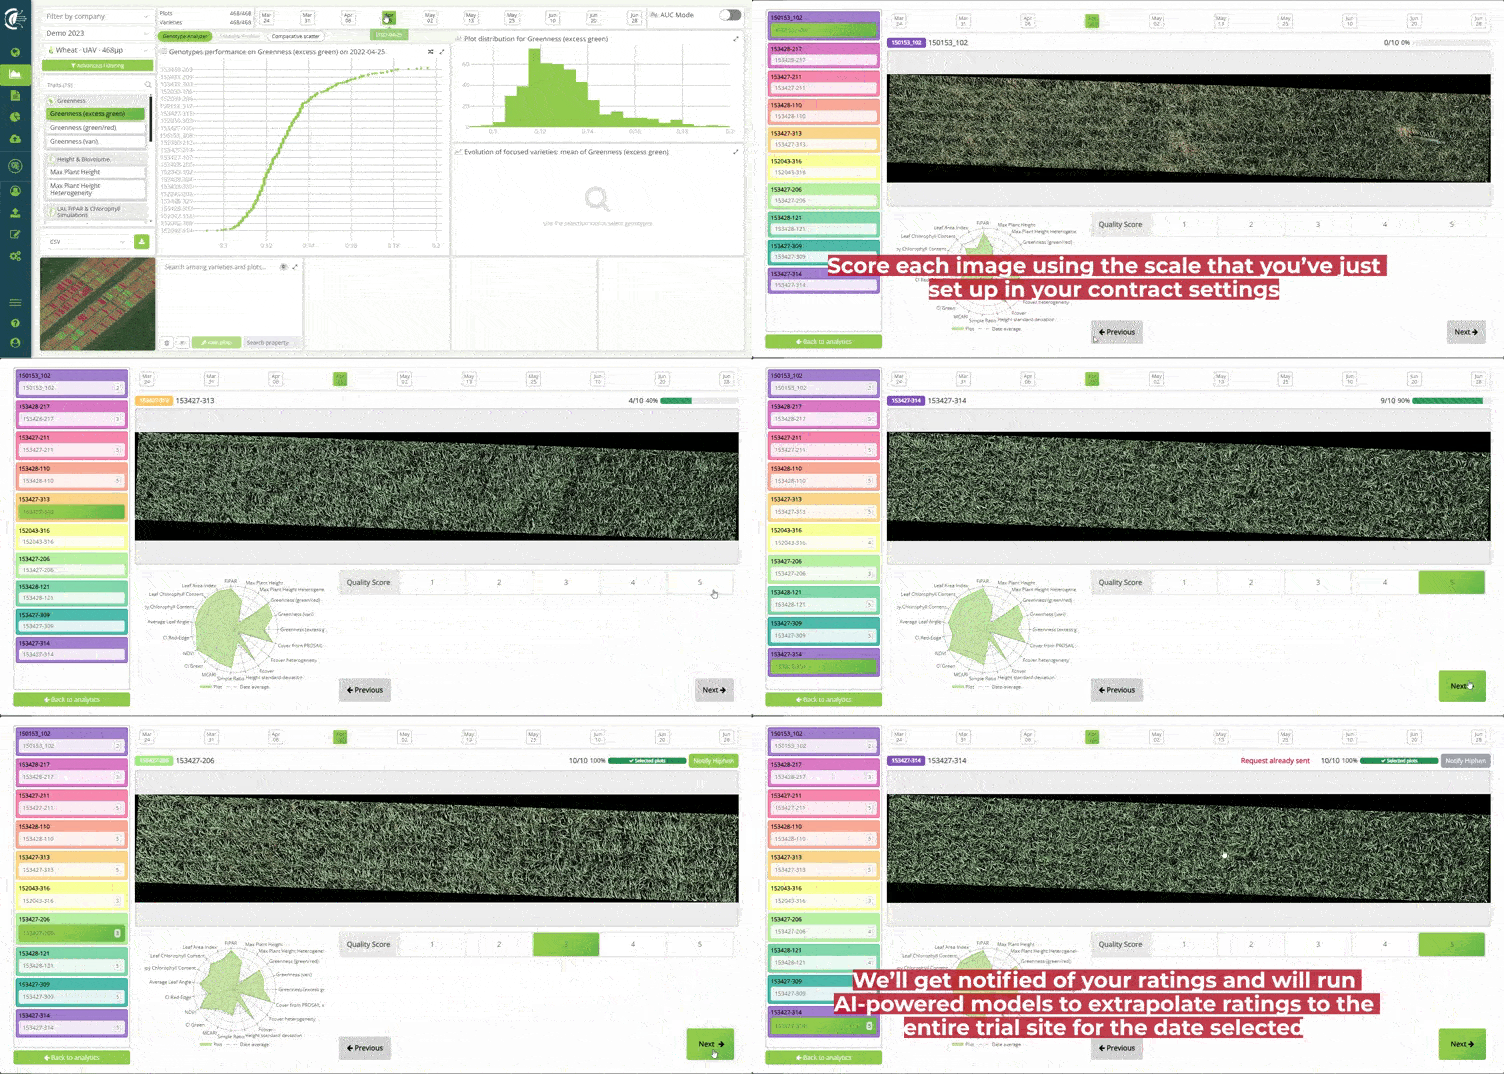
User value: Accelerate objective and consistent team-based visual scoring efforts from the confort of your office.
Use Cases: Visually score your plots and let us analyze how they stack up against drone metrics or let us extrapolate your visual scores to the rest of the trial. You can pick and choose the plots to rate via a quick graph selection or use the random plot selector.
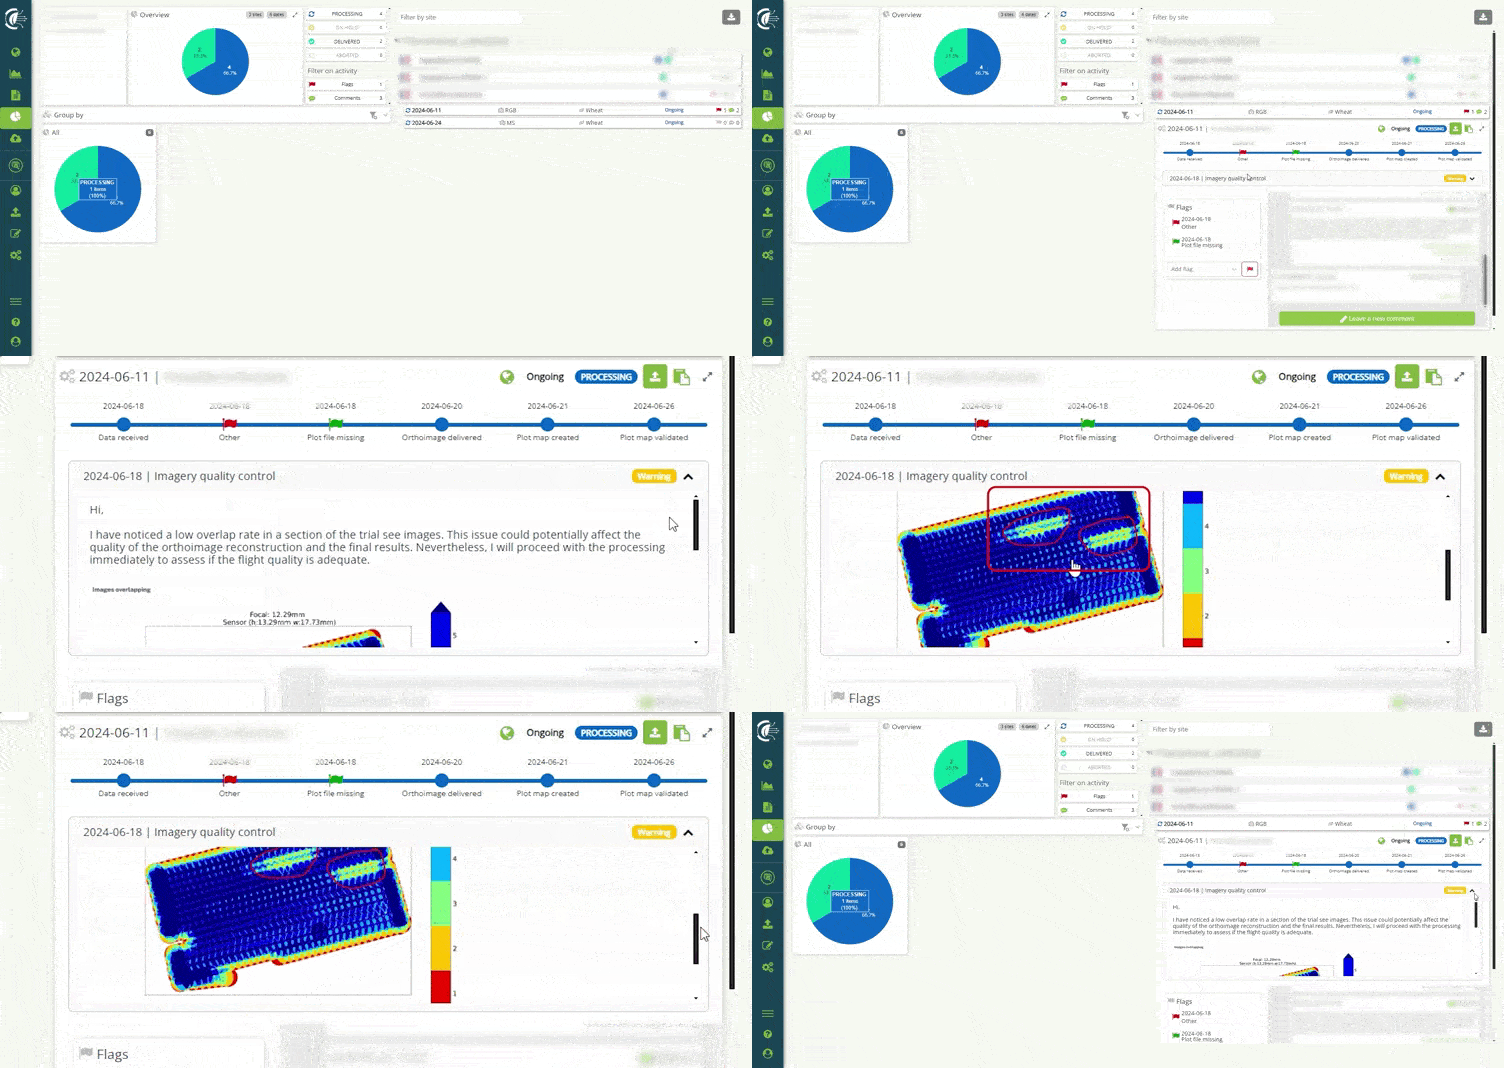
Quality checking new drone imagery you upload via Cloverfield is the first thing we do before processing your data. This new functionality allows you to see the quality control status of your flight directly from the Monitoring tool in Cloverfield. Your flight will be marked as "validated" if all is OK, or as "warning" or "rejected" if quality is not adequate. You can consult the report left by your Campaign Manager from this new foldable section.
User value: Get imagery quality feedback within 24 hours of your data being uploaded and do not miss the opportunity to fly again if the quality of your first flight is not as expected.
Use Cases: Manage your drone pilots and access quality control reporting directly from Cloverfield.
For more information, reach out to your Hiphen Campaign Manager. Stay tuned for the next Cloverfield™ features release update next month.
Sincerely, Your Hiphen Success Team.

New features have been added to Cloverfield™, your plant phenotyping online platform. Embark on a smoother plant breeding adventure with Hiphen's latest addition: Dynamic Filtering.
Optimize your breeding scheme by effortlessly filtering your genetic material in a few clicks within Cloverfield™.
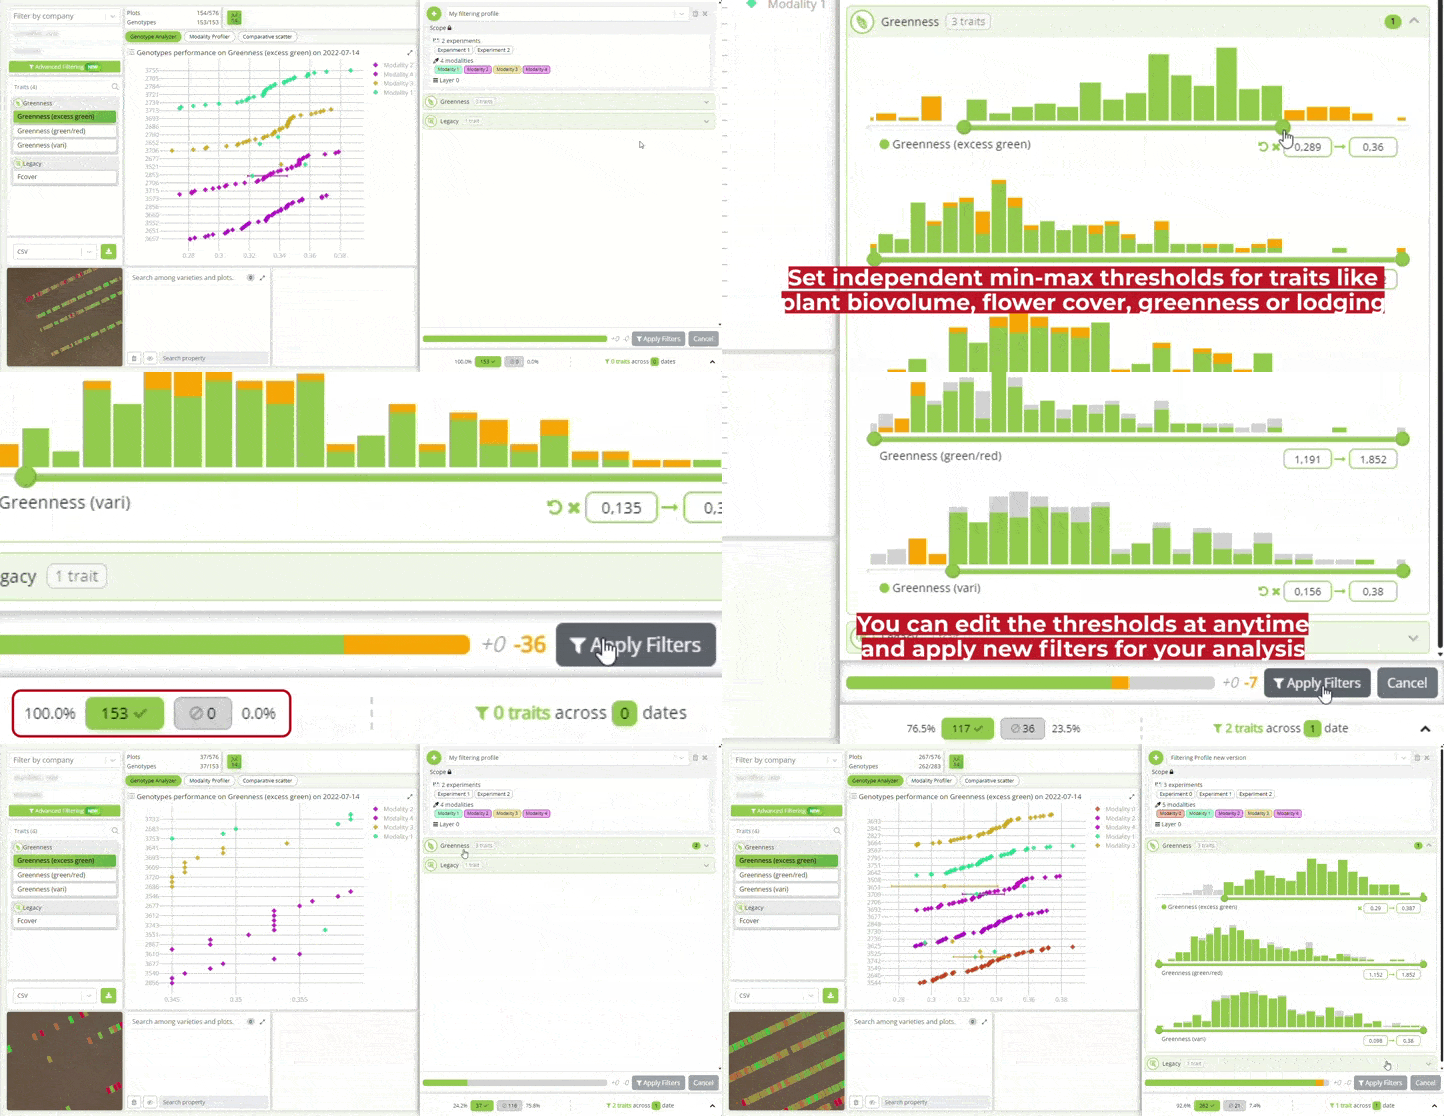
Interactively combine traits and set thresholds to filter out under-performing genotypes, or pinpoint the top-performing material you want to advance to the next stage.
Define more precisely your analytics profile. Specify more precisely the experiments, modalities and layers that you which to study and/or compare. You can create multiple profiles for the same trial site.
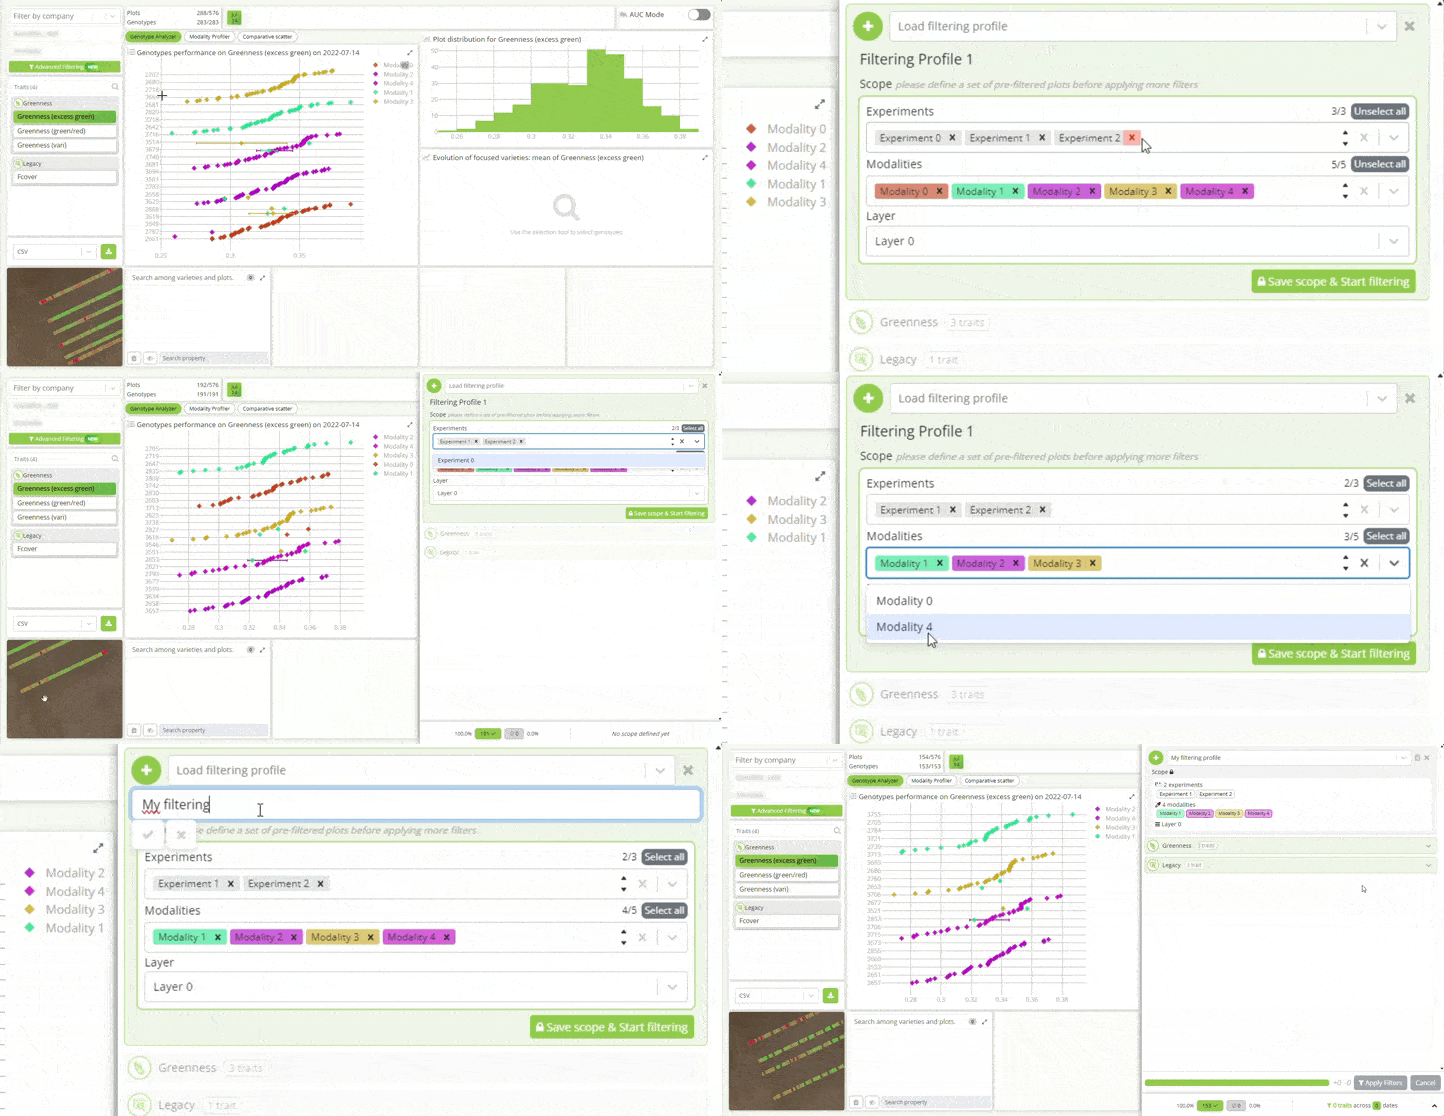
One step further in making your digital phenotyping experience frictionless with Hiphen, you're now able to make a detailed analysis of your data directly in Cloverfield™. You can easily combine traits and set for each one thresholding boundaries outside of which you wish to eliminate genetic material. For instance, one could set independent min-max thresholds for traits like plant biovolume, flower cover, stay green and lodging and see dynamically what share of the trial genetic material he/she is eliminating. This functionality will take you ever closer to reaching your ideotypes more efficiently than ever before!
User value: Apply multiple criteria filtering on your genetic material and dynamically eliminate under-performing genotypes based on your ideotype recipe.
Use Cases:
We invite you to explore the new dynamic filtering feature with the online INTERACTIVE TOUR. And please reach out to your Hiphen Campaign Manager should you have any question.
Stay tuned for the next Cloverfield™ features release update next month.
Sincerely,
Your Hiphen Success Team.
We are committed to meeting the evolving needs of crop researchers, and reimagined the way we articulate our Cloverfield™ Glossary with this this purpose in mind. This new intuitive format helps to parse the 70+ phenotypic traits we process routinely every year. Traits are grouped in explicit agronomic themes, with definitions and visuals to be transparent with regards to methodology. The new version places a strong emphasis on five distinct trait categories:
These categories have been carefully curated to cater to the unique needs of agronomic researchers, providing you with a more precise and comprehensive understanding of phenotypic measures available off-the-shelf for your crops.
With this new version, we are also unveiling our revamped interface for an enhanced user experience. Dive into an enriched journey of knowledge with our detailed visualizations and graphs, providing transparency into our advanced traits processing methodology.
Additionally, a powerful search functionality is now at your disposal to easily navigate the content of the glossary. Try it now!
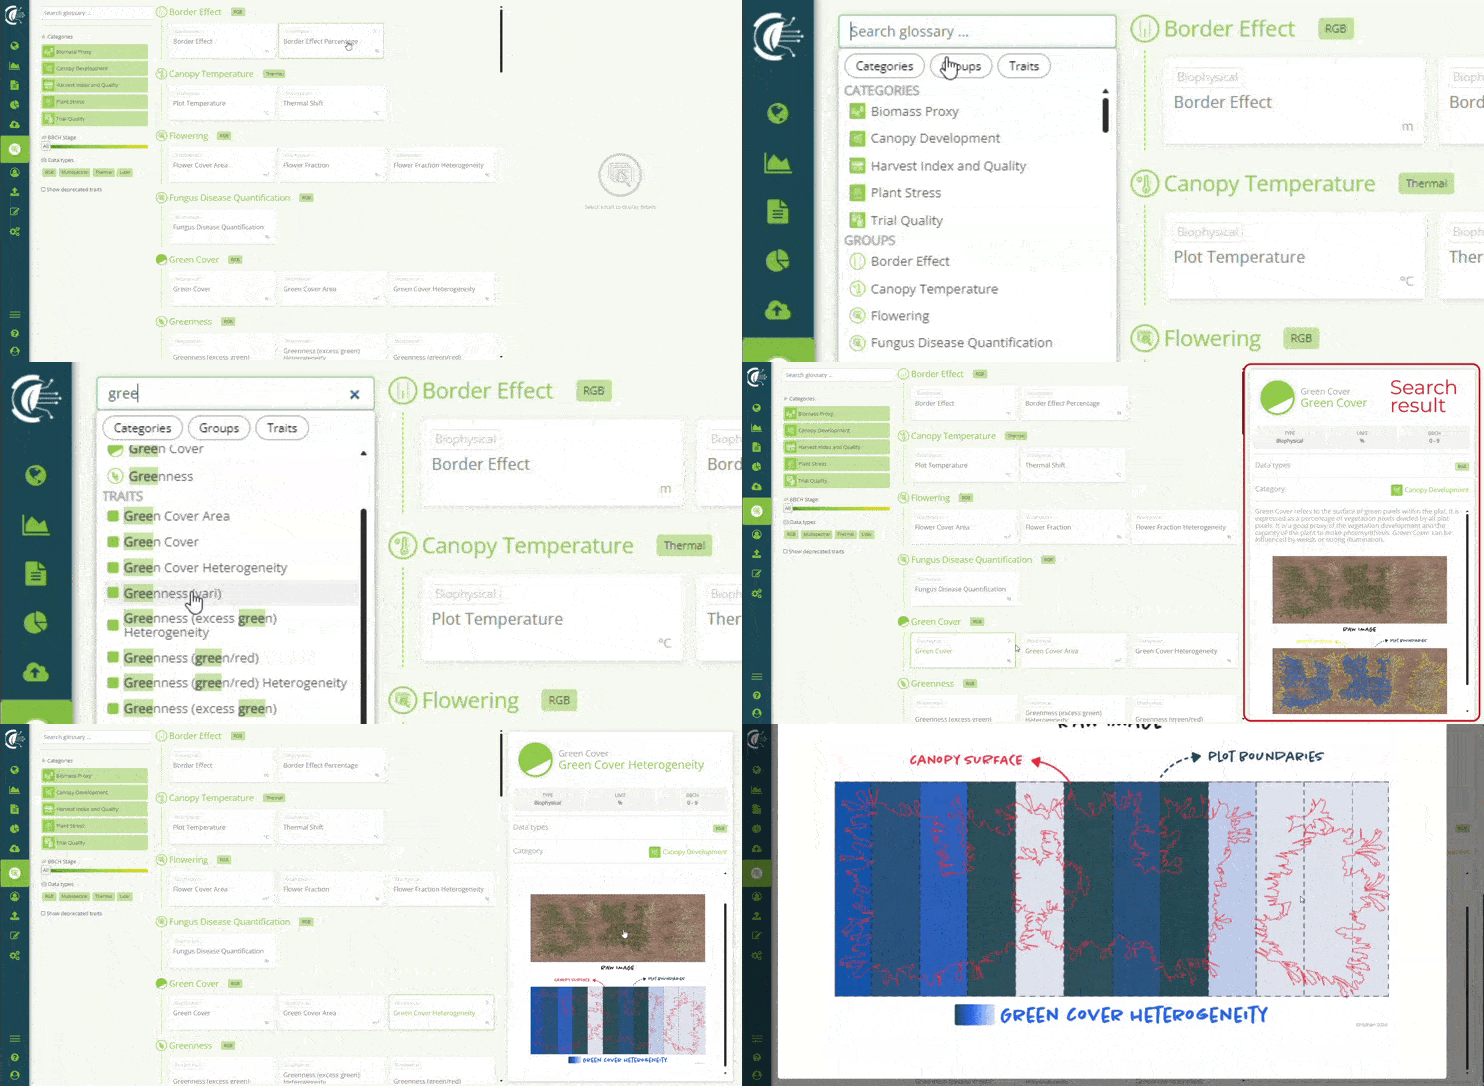
Feel free to share this open online resource, establishing the new standards in digital phenotyping methodology for Ag research, with your fellow researchers to foster discussions within the scientific community. Moreover, we invite you to regularly check out this resource to keep up to date with the latest traits available. We eagerly anticipate collecting your feedback on this new traits' glossary. Your insights are valuable as we continue to advance in the field of agricultural research.
Cloverfield's Glossary is designed to offer definitions for the traits computed by HIPHEN. Alexis Comar, PhD describes a phenotypic trait as: "A measurable characteristic of the plant or canopy. It is the result of combining raw data obtained from sensors such as cameras, lidar, spectrometers, etc., with an analytical method for interpretation. This process serves as the means to transform raw sensor data into meaningful metrics for agronomists."
We've shared previouosly on our blog a post about what is a phenotypic trait – Read it now.
Hiphen's roots are deep into crop science, which truly sets us apart in the digital phenotyping realm. We gather a decade of experience and an unwavering commitment to agricultural research to ensure that our solutions align with your objectives.
The new and improved Cloverfield Glossary is a testament to our dedication to empowering you with the tools you need to make informed decisions and optimize your agricultural practices.
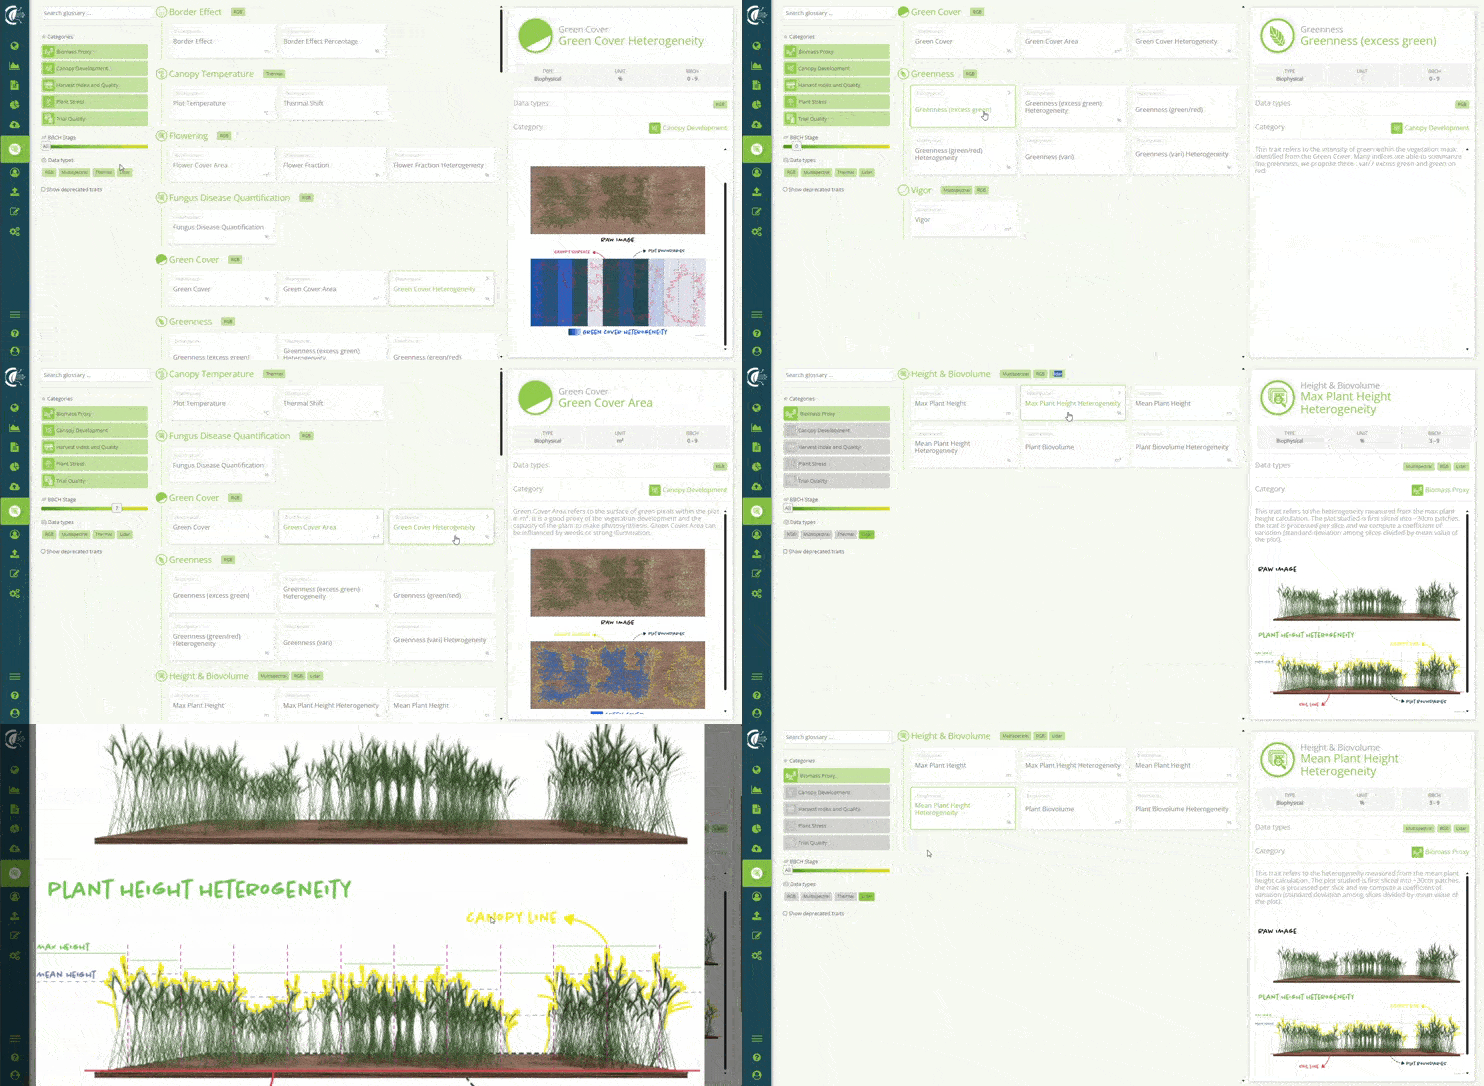
We invite you to explore the new traits' glossary and ask your Hiphen Campaign Manager should you have any question.
Stay tuned for the next Cloverfield™ features release update next April.
Sincerely,
Your Hiphen Success Team.
As you are aware, Slantrange was acquired by Hiphen last May, and since then, our primary focus has been on ensuring a seamless transition for Slantrange clients to Hiphen, providing the best possible experience throughout the process.
With this transition in mind, we would like to inform you that the Slantview data platform will be discontinued. Instead, all data processing action and results will now be delivered through Cloverfield™, Hiphen's homegrown data platform. This decision has been made in the interest of practicality and to offer our clients the best user experience.**
The merging of Slantrange and Hiphen platforms has been a comprehensive process, allowing us to draw on the strengths of both. The insights gained from this integration have been instrumental in enhancing Cloverfield, making it an all-in-one online platform that you can trust for your phenotyping needs.
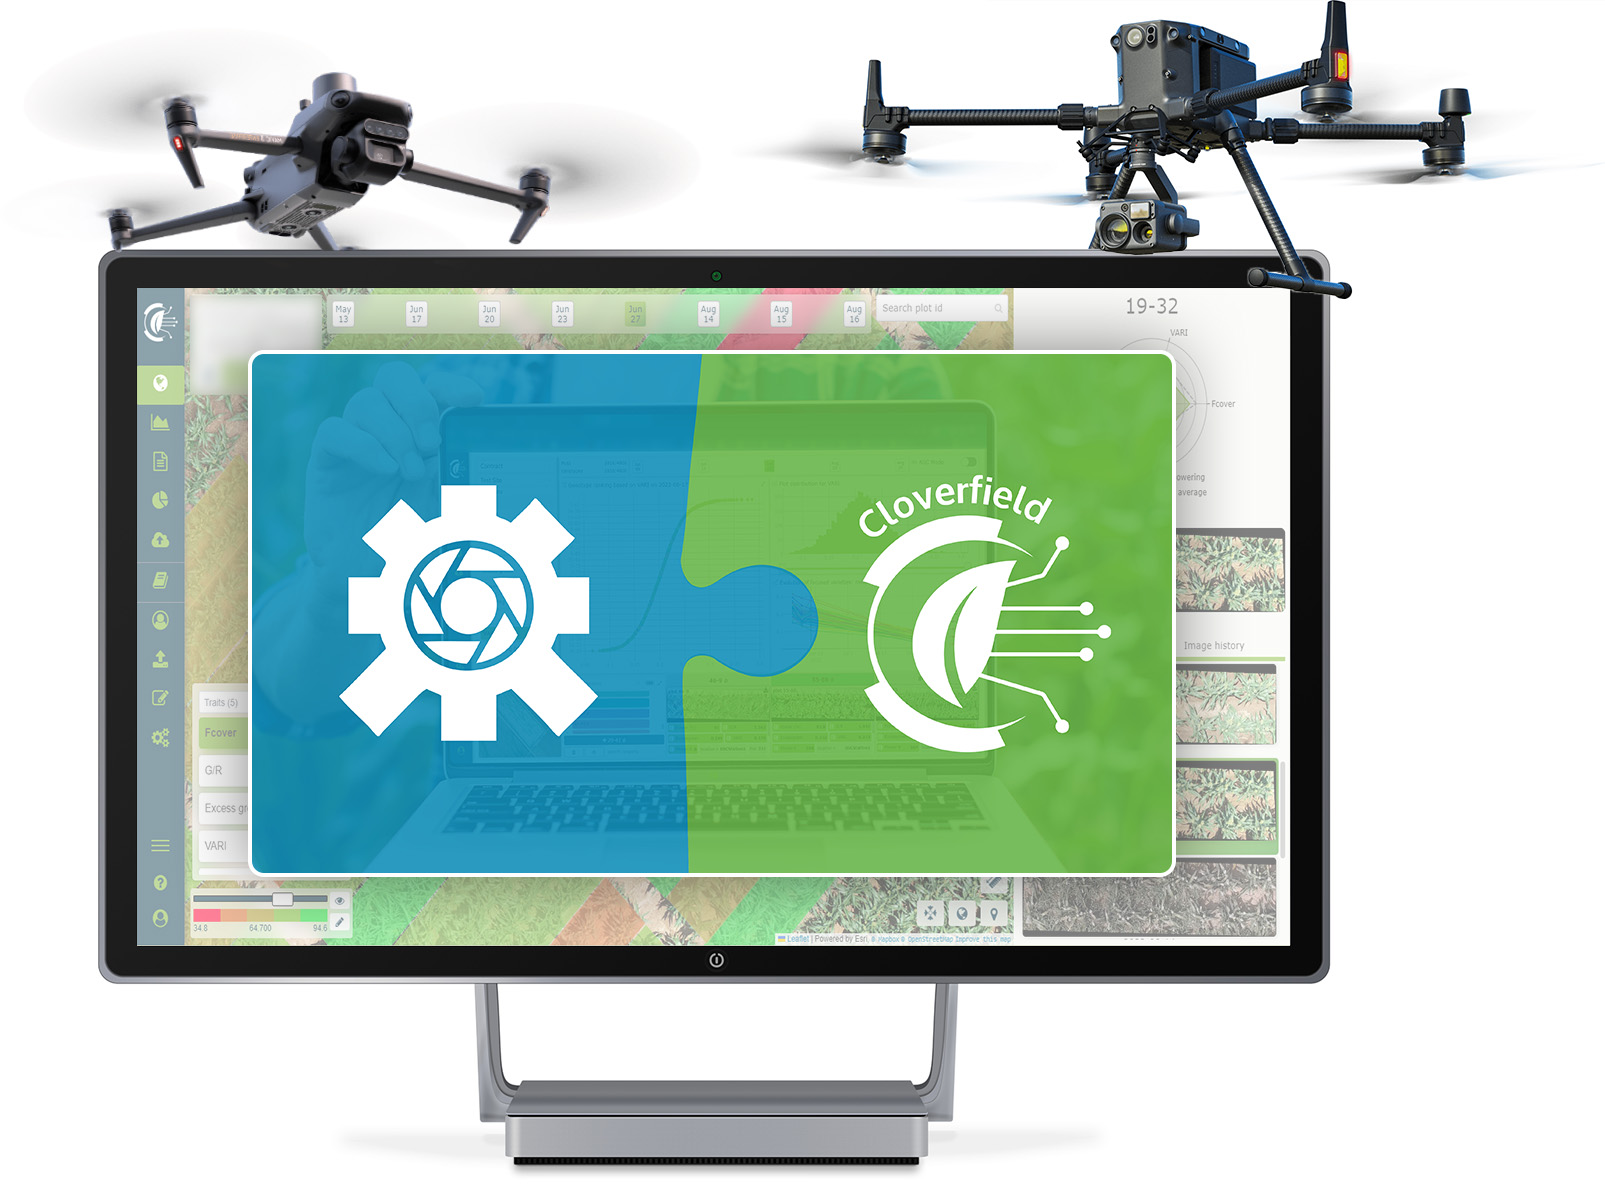
We understand that change can be challenging, but we believe that this transition will bring the best of both worlds to our clients. The improvements made to Cloverfield™, based on the lessons learned from the comparison of both platforms, will undoubtedly elevate your phenotyping experience.
This decision also aligns with our upcoming strategic developments at Hiphen. We are committed to maximizing your phenotyping experience by implementing improvements in internal tools, enhancing interconnectivity, ensuring transparency, and prioritizing data security. These developments are part of our broader strategy to provide you with a cutting-edge platform that meets and exceeds your expectations.
We appreciate your understanding and cooperation during this transition. If you have any questions or concerns, please do not hesitate to reach out to our Success Team using the button below.
We are dedicated to making this transition as smooth as possible for you. Thank you for your trust in Hiphen.
Your Hiphen Success Team.
Contact Success Team
API integrations, Plot Scoring tool & new Analytics functionalities are now available in Cloverfield™, your plant phenotyping data platform.
We are thrilled to announce a significant upgrade to our Cloverfield™ online phenotyping data platform. With the release of the latest version, we are introducing new game-changing features that will enhance your experience and streamline your data management processes:
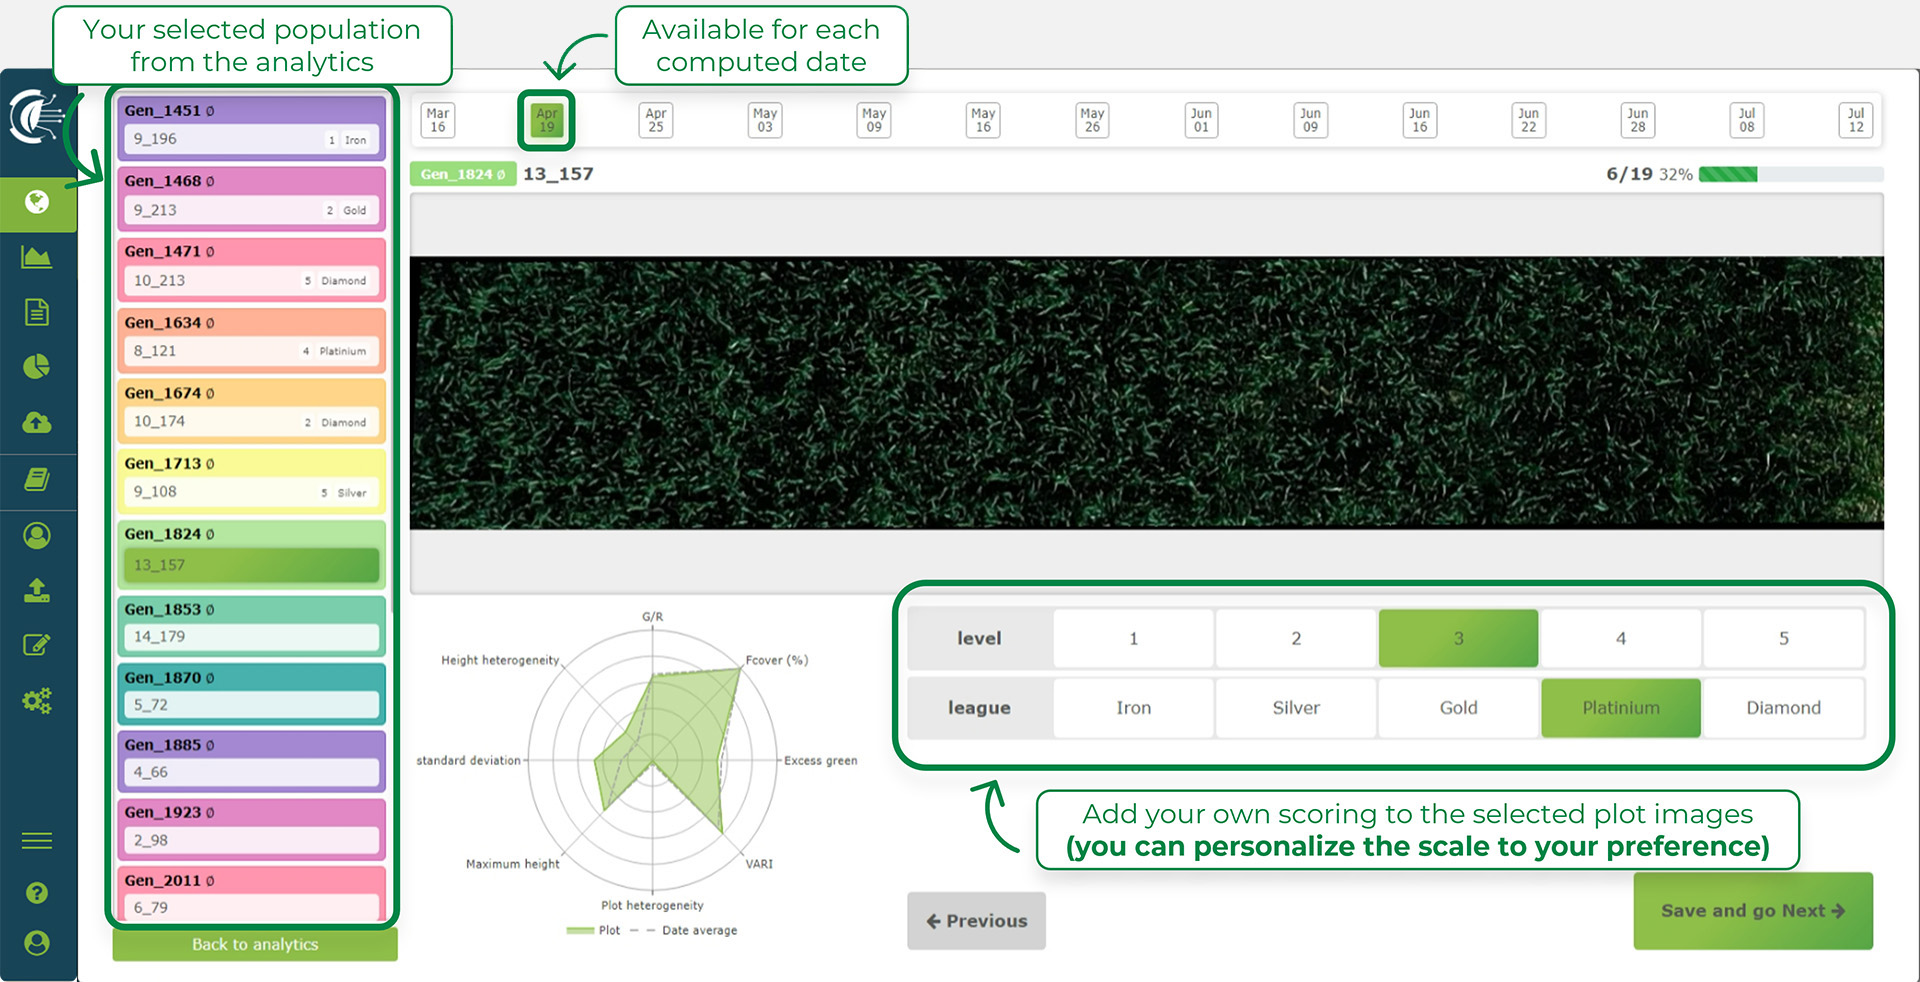
Screenshot of the Plot Scoring Tool interface in Cloverfield™.
The Plot Scoring tool is a game-changer in digital phenotyping and genotype assessment. Now, you can define your own scoring scales (numerical or categorical) and annotate plot images at the phenological stage of interest. The scores will then appear next to the digital traits allowing you to boost and scale your genotype assessments. Directly from Cloverfield, you can now deploy ground-truth annotations at scale for various applications such as plant lodging, disease resilience, plot quality and much more. The Plot Scoring Tool empowers you to augment your phenotypic information with precision and efficiency.
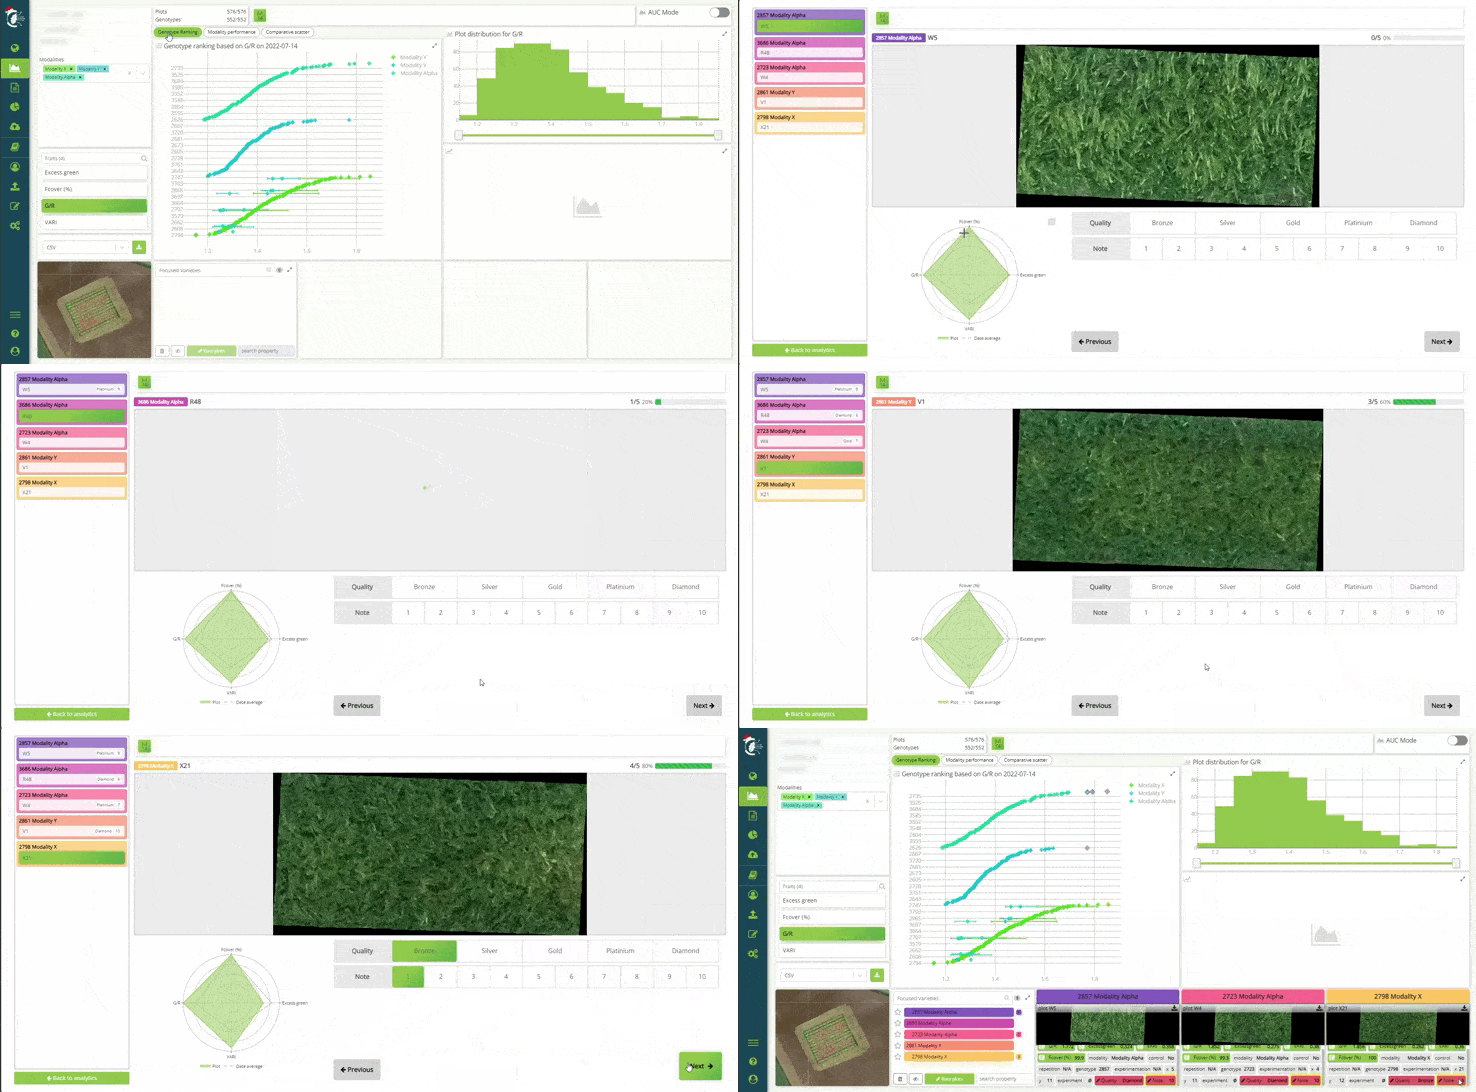
Rate your plots with your own rules directly in Cloverfield™ using the Plot Scoring Tool.
This new functionality allows you to select the agronomic variables you would like to compare on a scatter plot. It is designed to assist breeders in comparing digital traits, facilitating the identification of outliers and trends within your nurseries or field trials. It actually nicely complements the Plot Scoring Tool. Imagine scoring your images, saving this ground-truth as a new trait, and then inspecting how it stacks up against digital traits such as vigor, flowering, and biomass proxies directly from the Genotype Analyzer. This dynamic combination enhances your ability to glean valuable insights from your phenomics data.
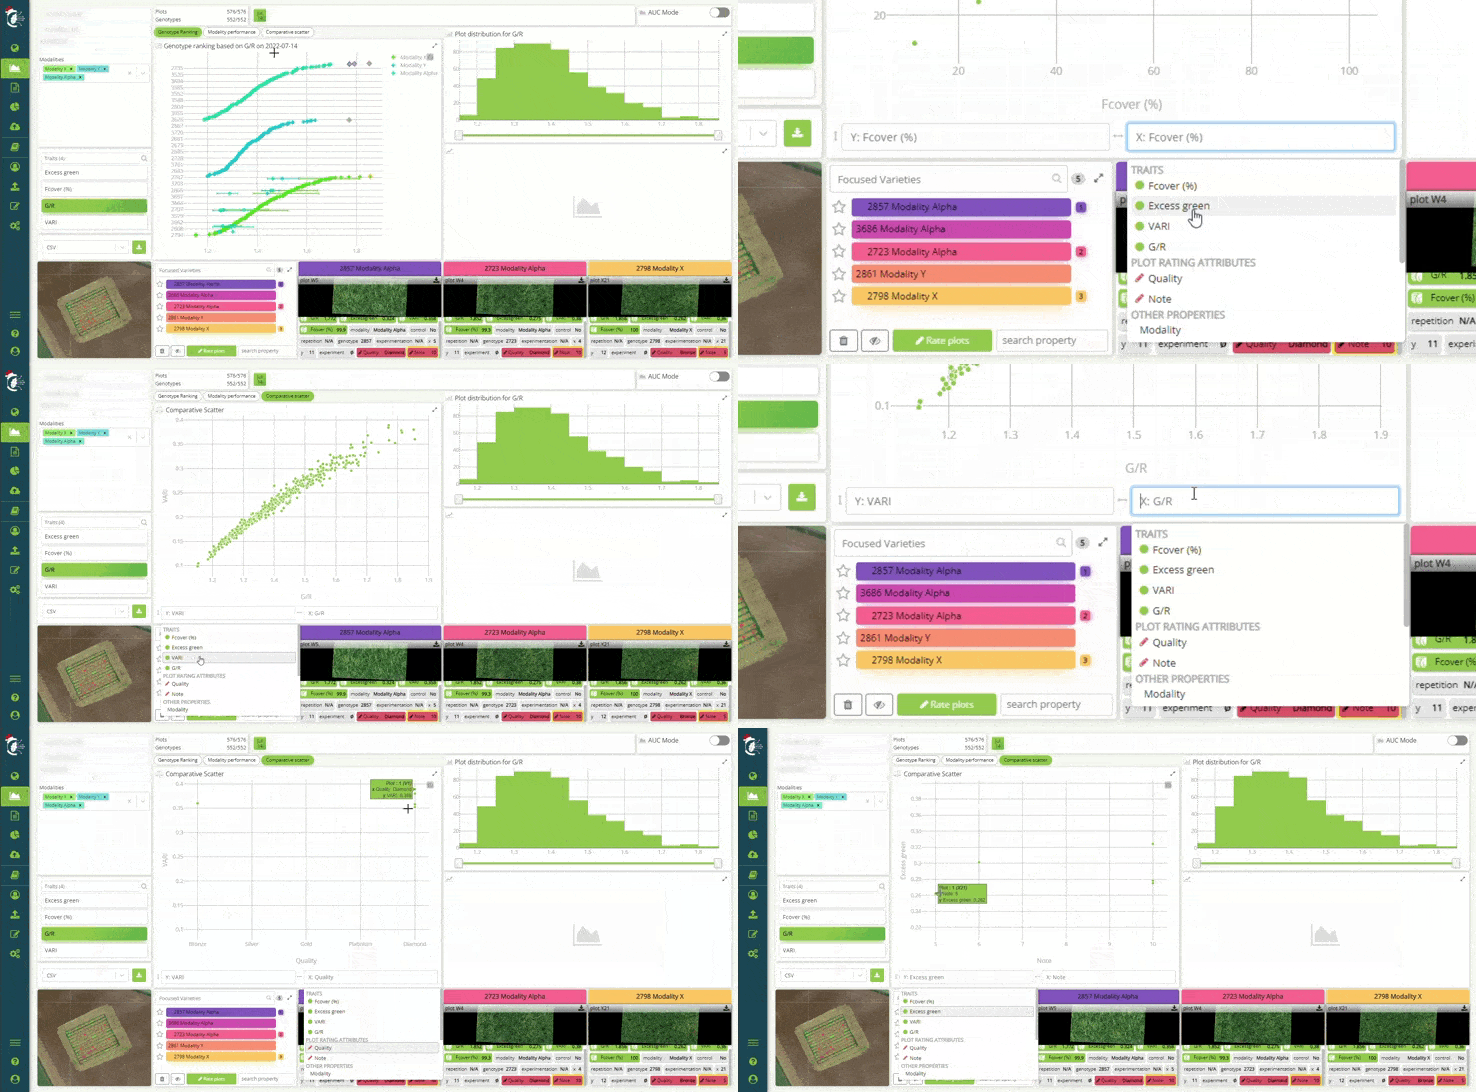
Compare Plots using the Genotype Analyzer graph in Cloverfield™.
This box plot was added at the request of crop protection specialists to efficiently assess the impact of their products per experiment. It is now very simple and quick to check how your crop responded to the various treatments applied, which we refer to as modalities. It marks the first step into analytical features designed specifically for crop protection use cases and you can expect more to follow in the next year.
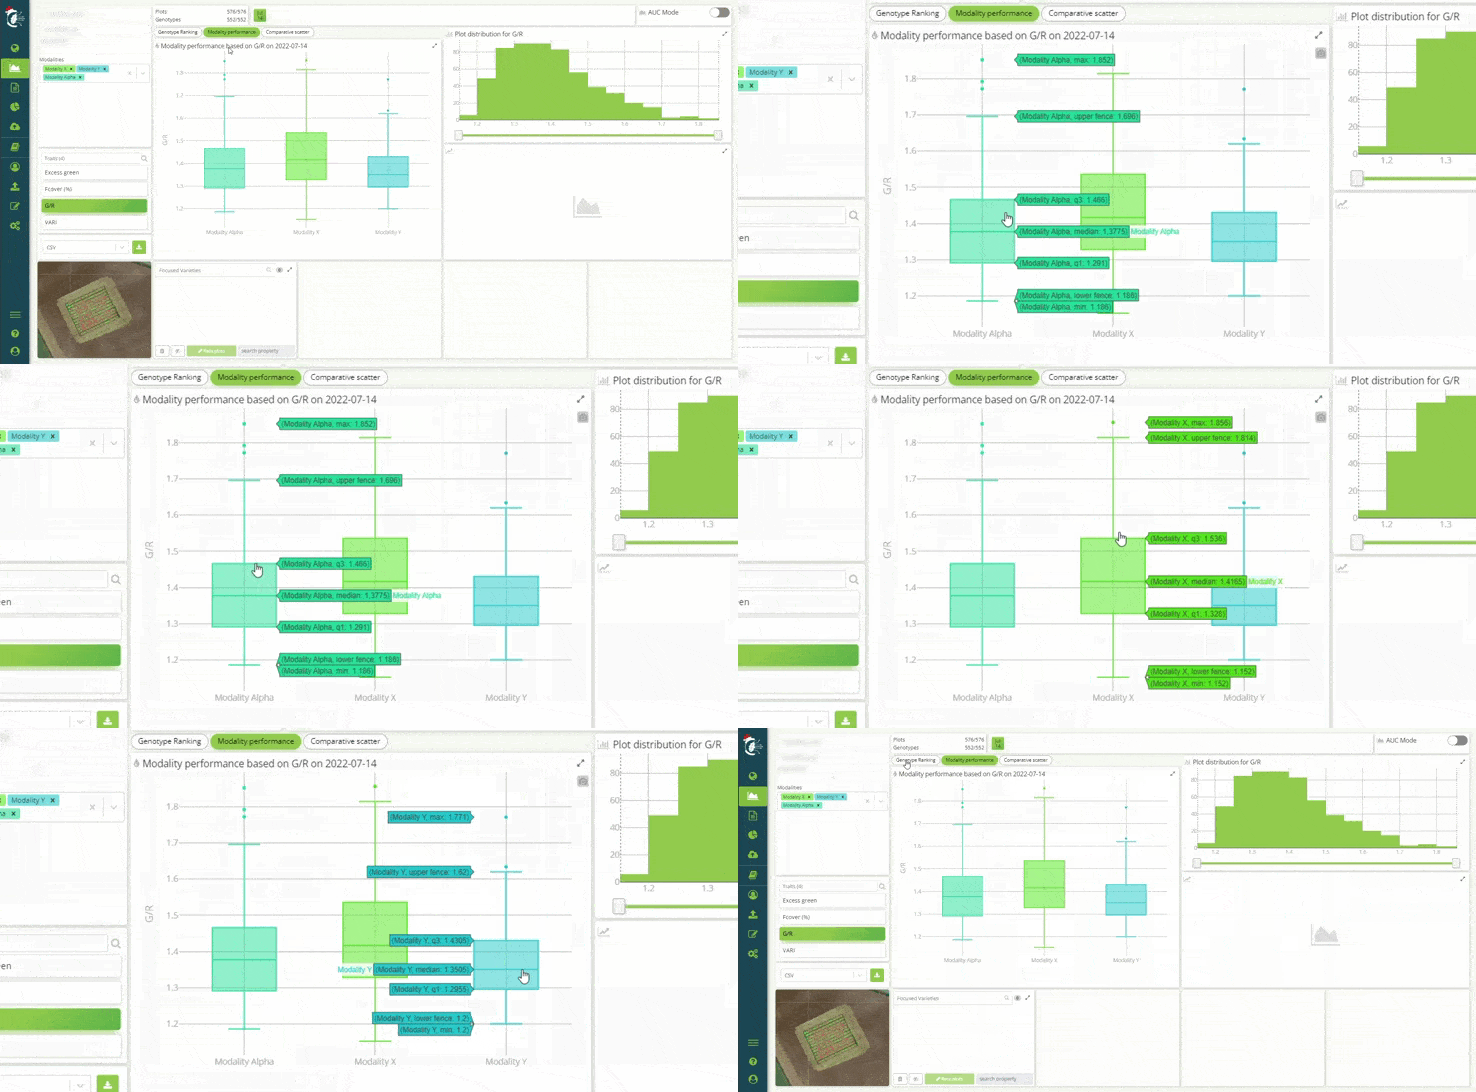
Identify outliers in product development trials using the Modality Profiler graph in Cloverfield™.
APIs, or Application Programming Interfaces, are a set of protocols and tools that allow different software applications to communicate and exchange data with one another. In the context of Cloverfield™, our APIs enable you to seamlessly connect your management or proprietary software to our platform, facilitating automated data transfer, including both uploads and downloads.
Global breeding companies are already using Cloverfield™ APIs to seamlessly connect their information system to ours. Newly acquired data is programmatically pushed to Cloverfield™ and results are automatically retrieved and published into their data lakes. Security is of the essence here as well, with Hiphen's security compliance reaching high standards to guarantee safe data transactions. Our documentation will guide your team of IT experts to connect and we are at your disposal to accompany you should you need any assistance from our software team.
At Hiphen, the team is committed to using our software expertise to help you achieve more season after season. We believe that the addition of Cloverfield™ APIs is a significant step towards making your data management smoother, more efficient, and more powerful.
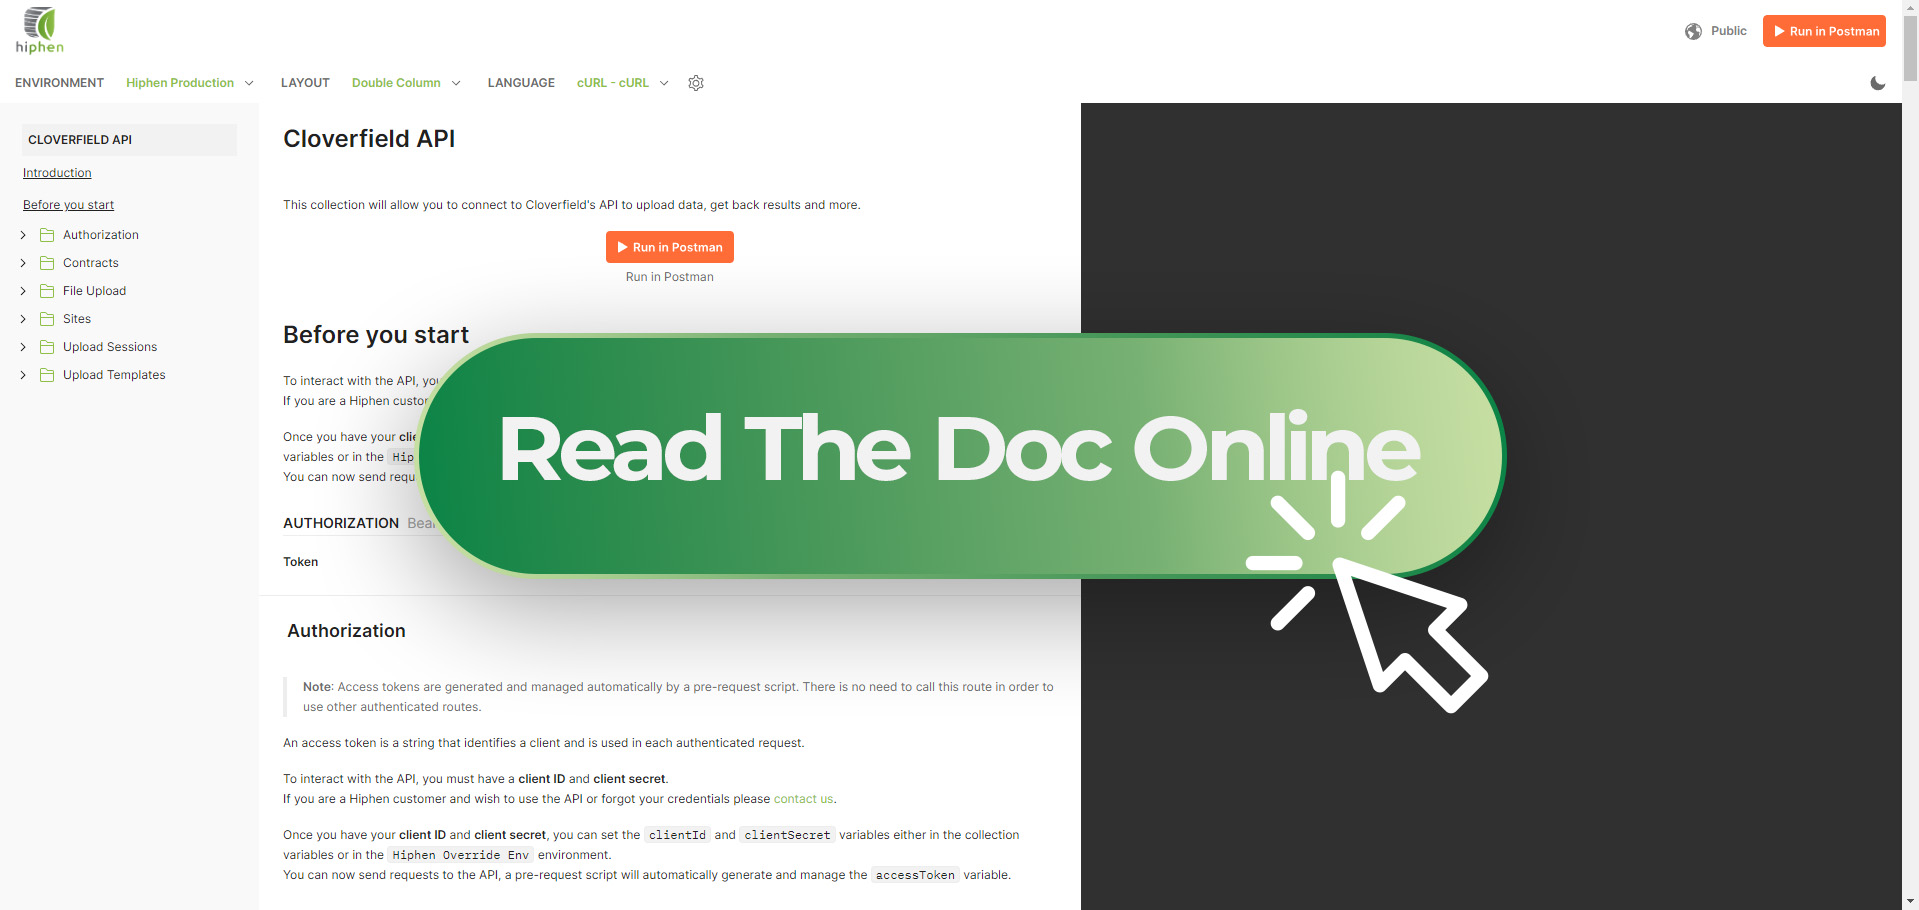
Read the public documentation online by clicking the image link
Cloverfield v2.8.0 – October 04th, 2023
New features have recently been added to Cloverfield™, your plant phenotyping online platform, and in this blog post we are going to take a deeper dive into those 6 new features:
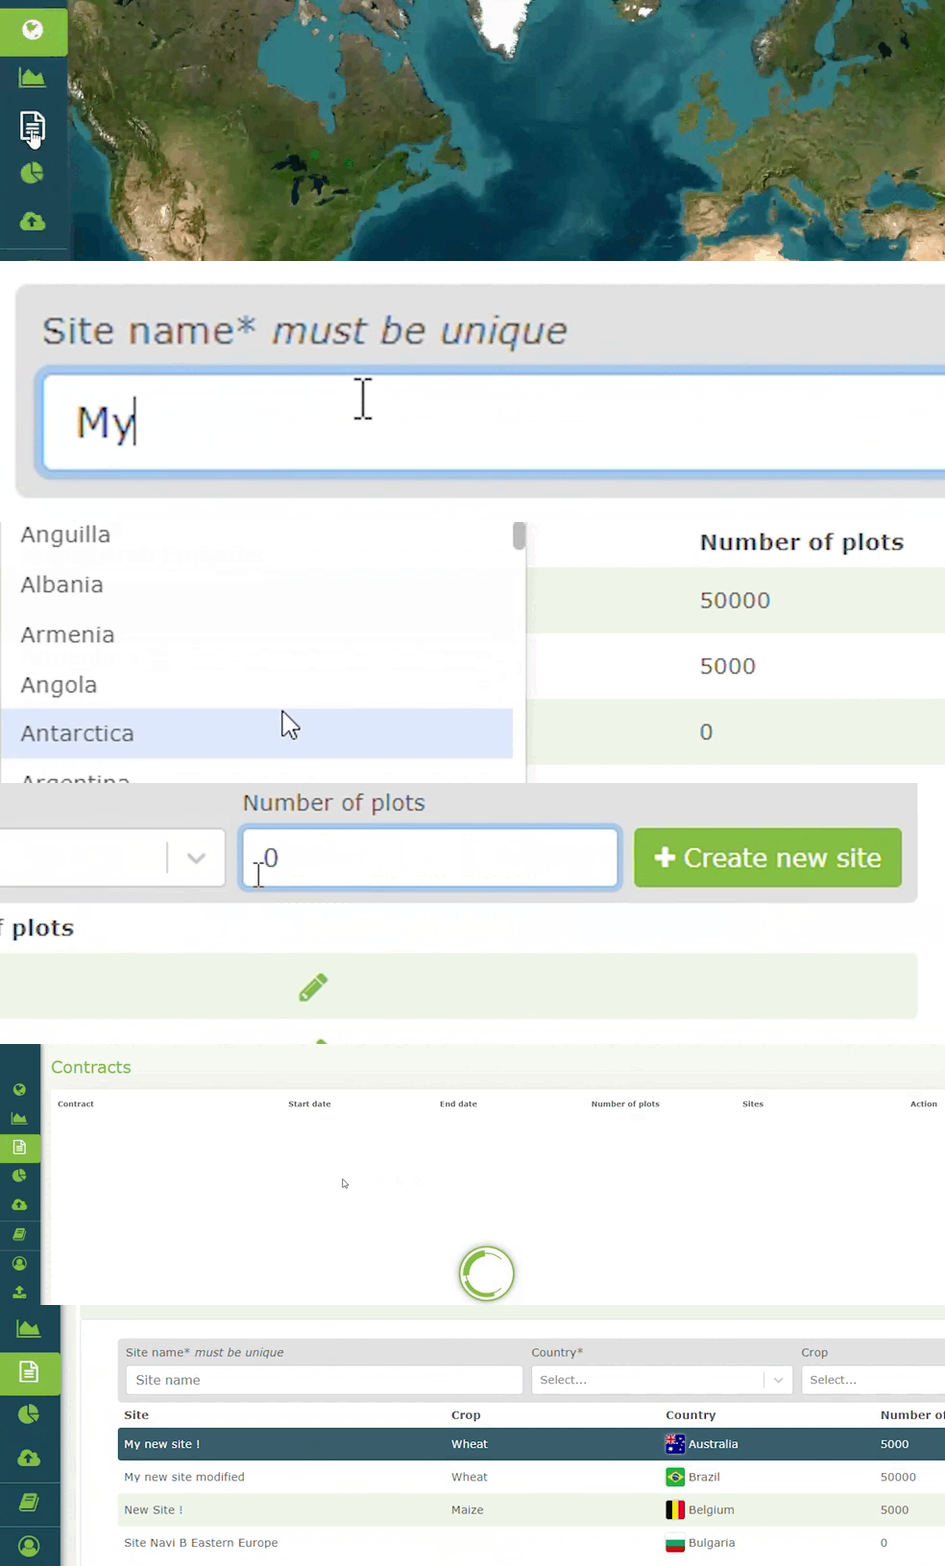
You can now autonomously manage the creation of new trial sites directly through Cloverfield™. Add a new location or change its name without having to ask your Hiphen Campaign Manager. Only accessible for users with 'Admin' rights assigned to the contract.
💎 User value: Save time and be autonomous with your campaign management.
⚙️ Use Cases:
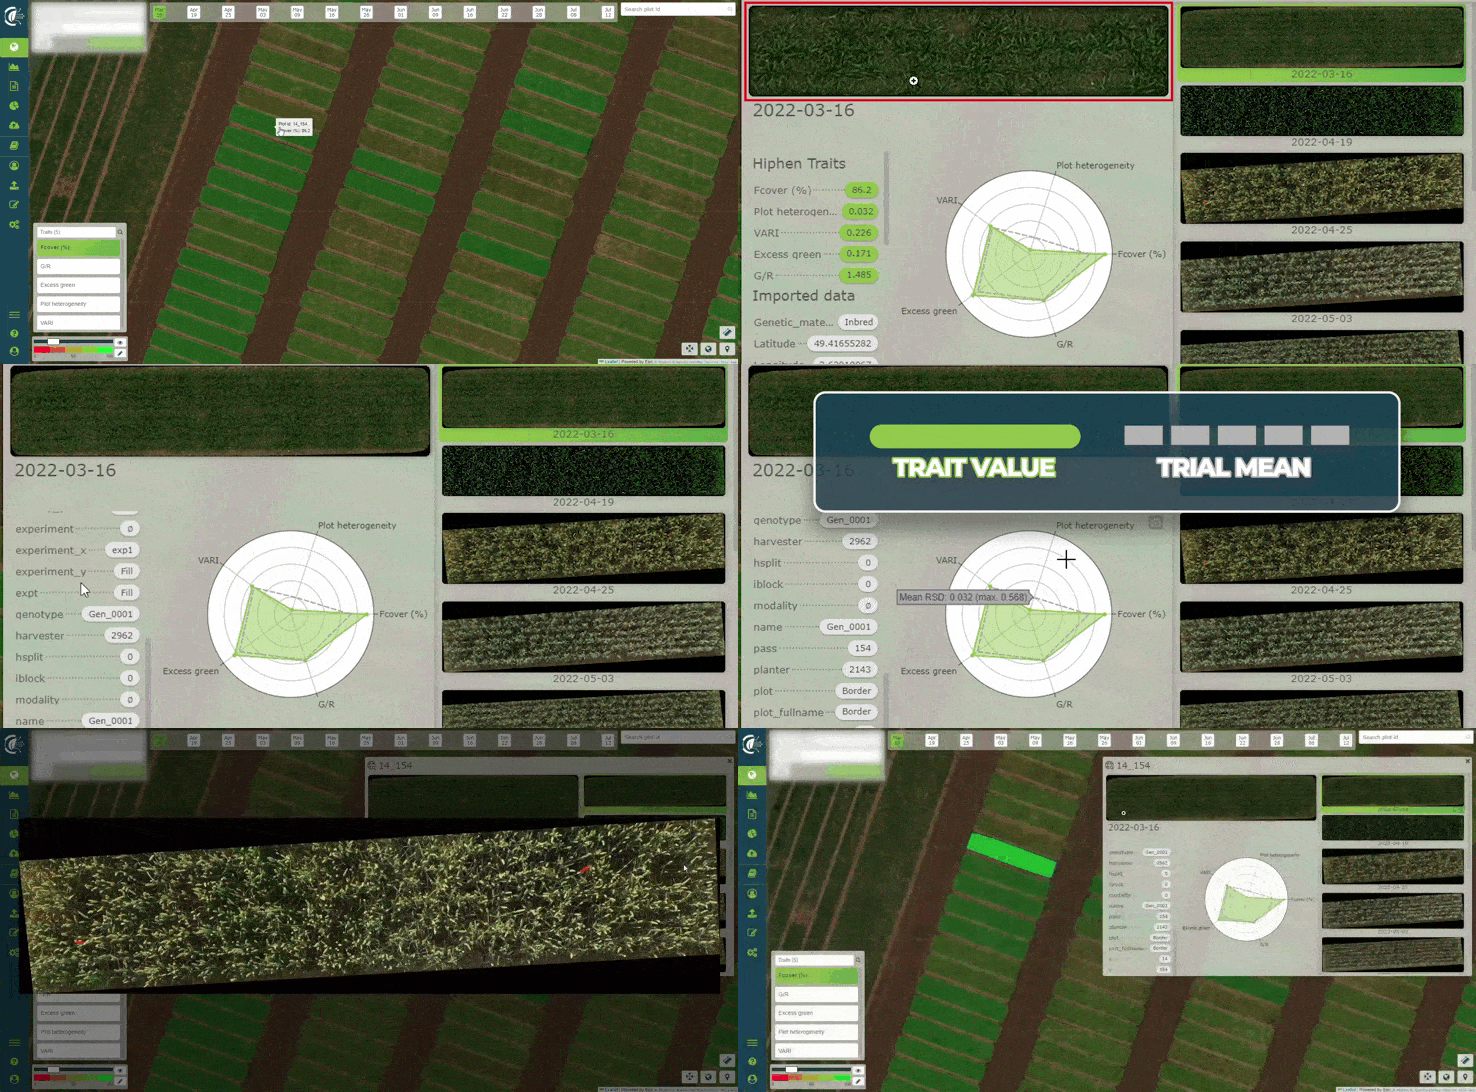
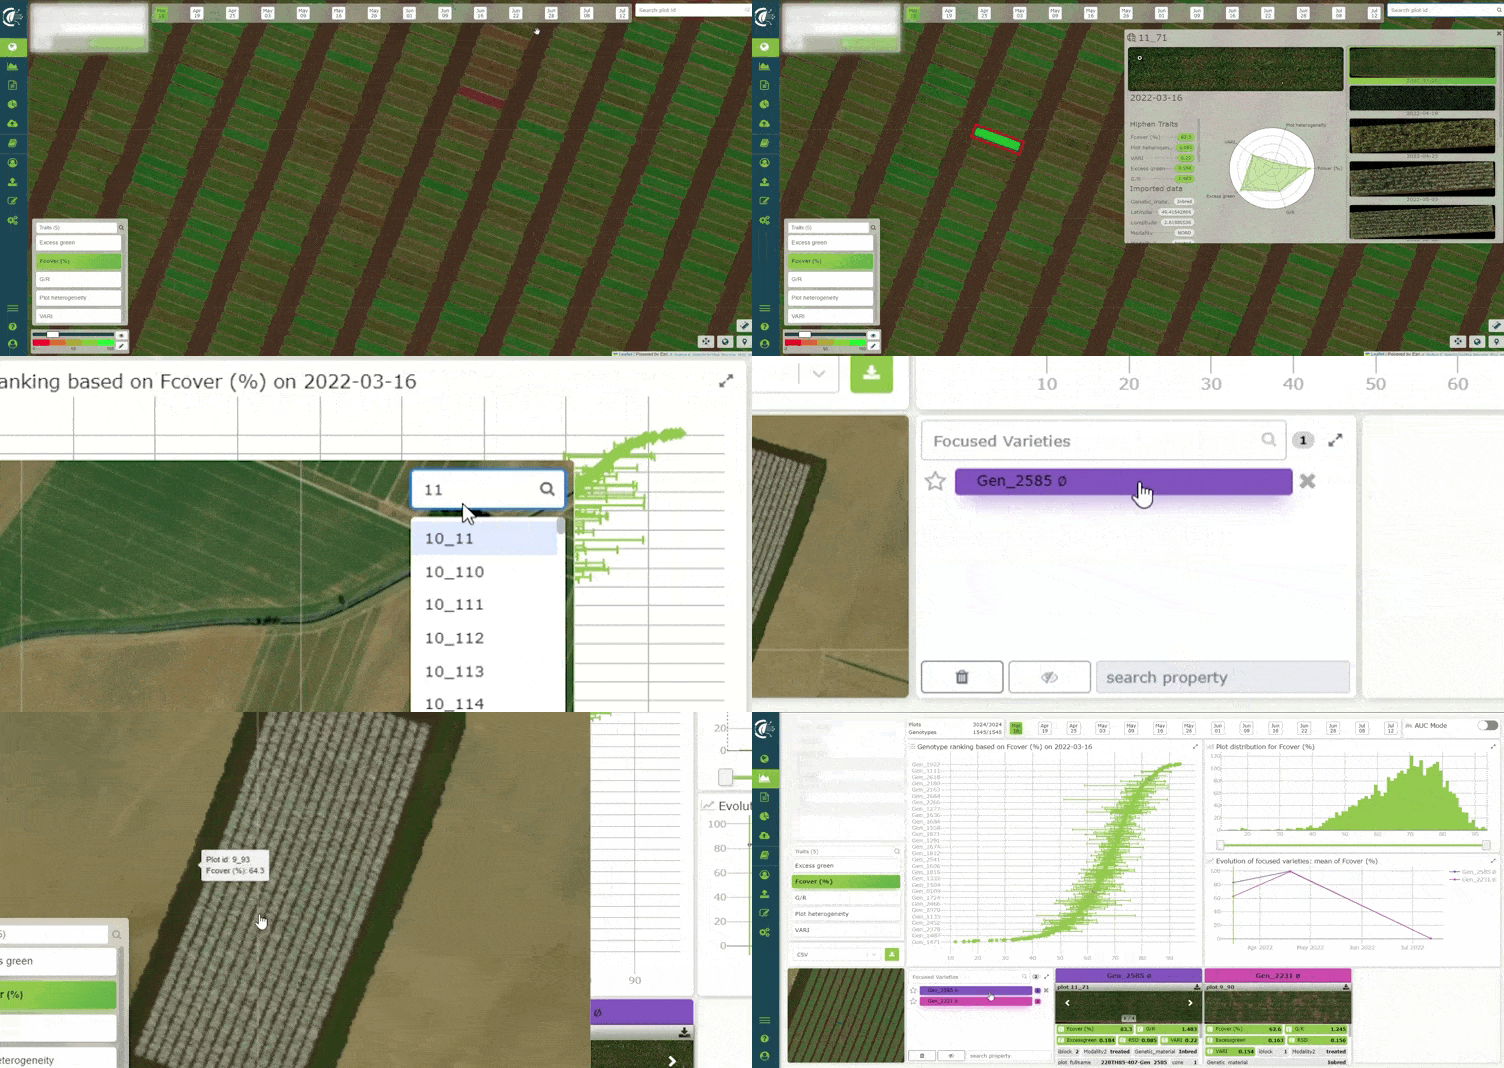
Clicking on a plot in the map view will give you access to a new window that displays next to each other the plot images from each flight. You can now efficiently visualize a single plot’s evolution through time in one click.
The new window also provides the trait results computed for the selected plot at the selected date. Finally, a new spider chart helps to efficiently assess how the plot performed versus the trial’s mean.
💎 User value: Access plot information and history at once for faster inspection and decision-making during the campaign.
⚙️ Use Cases:
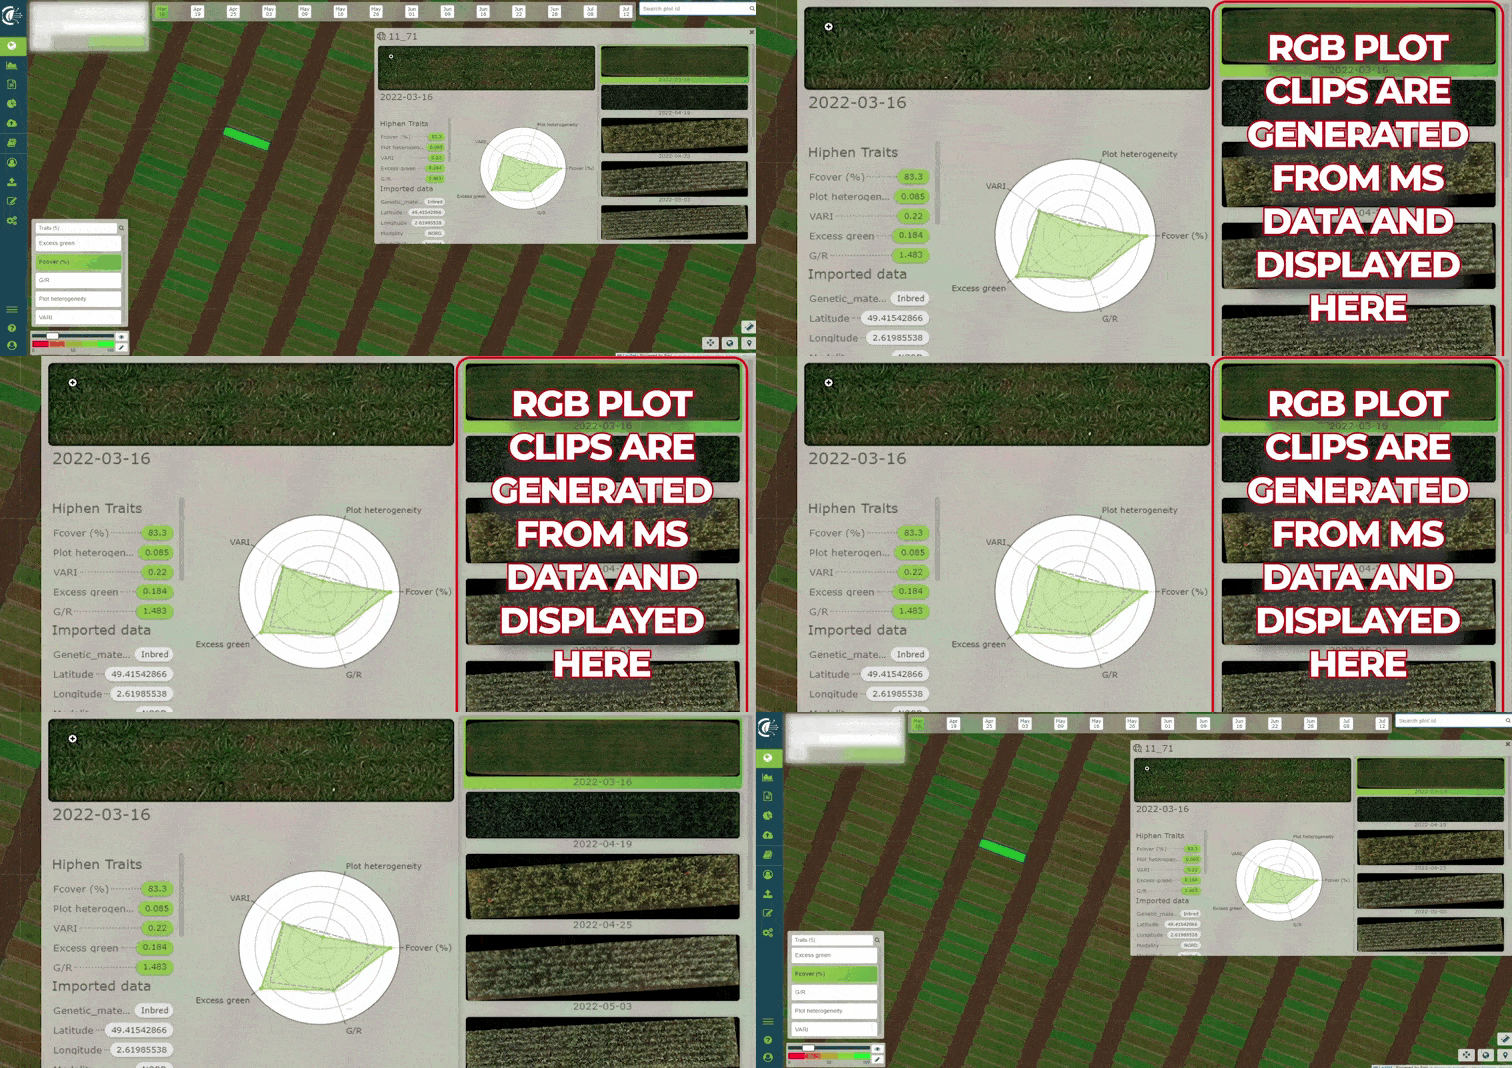
For future multispectral flights, RGB plot clips will be generated from the orthomosaic and posted into the analytics tool. Just as it is the case for RGB flights, you’ll then be able to inspect multispectral plot imagery in more details directly from Cloverfield™.
**💎 User value:**Check the raw image of your plot acquired with a MS sensor.
⚙️ Use Cases:
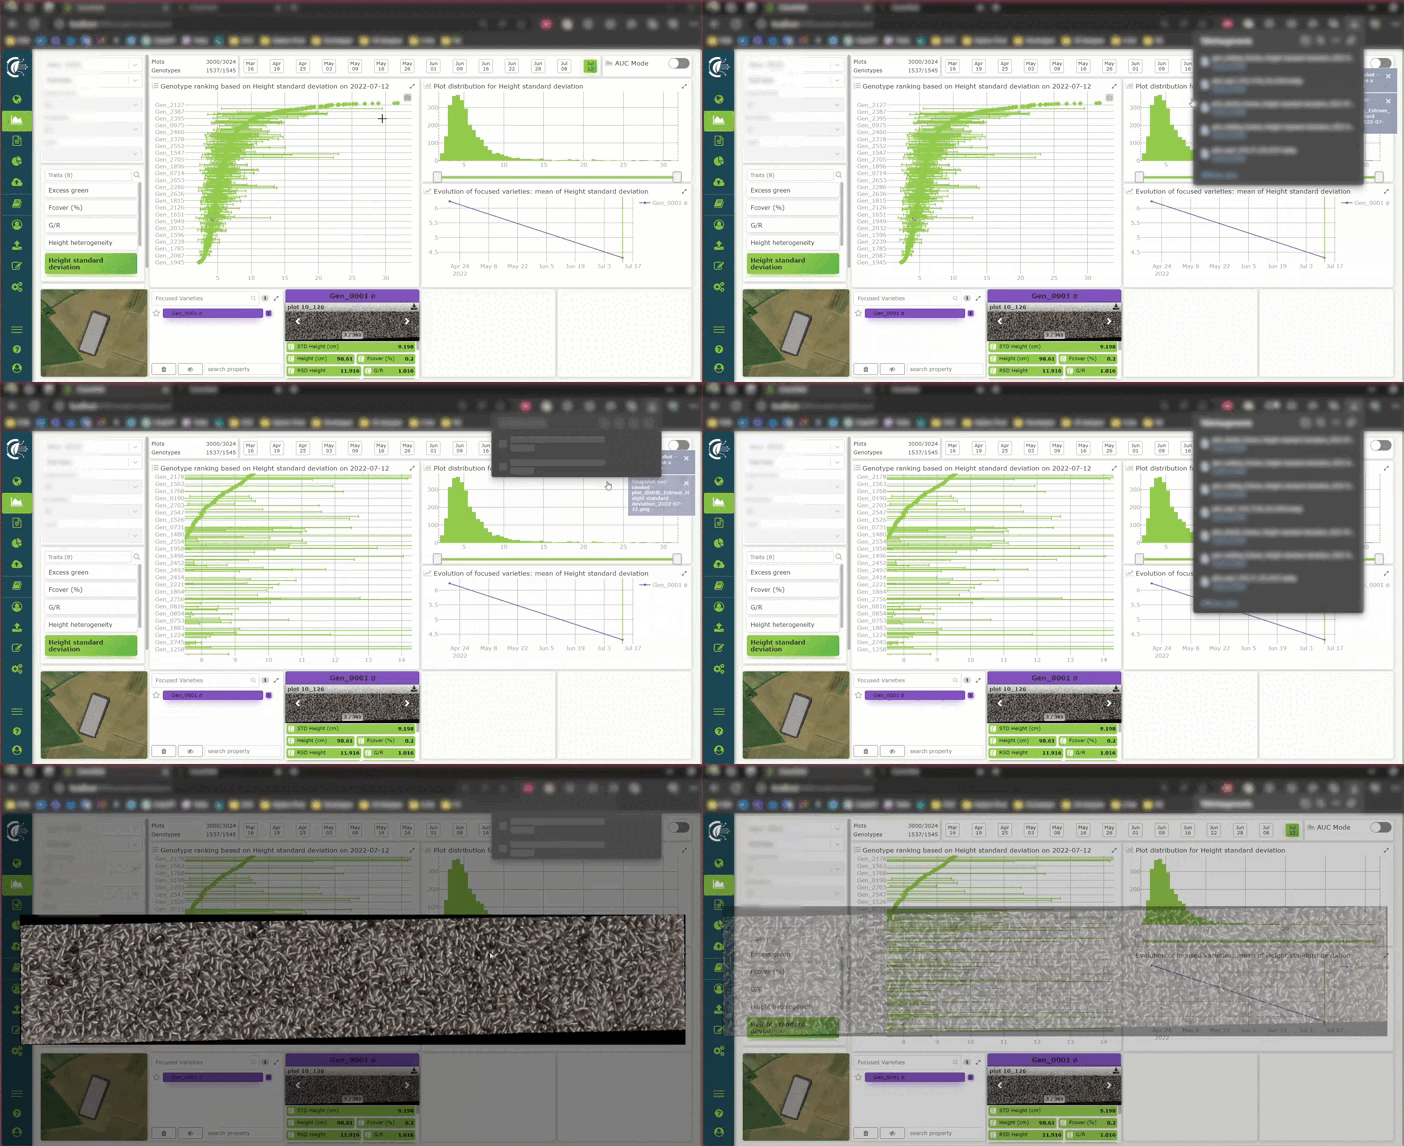
Download graphs displayed in the Analytics tool and any plot clips to insert them into your presentations and internal communication. The file format will be an image (.webp) which will following the following file naming convention: site name_date_plot name.webp.
**💎 User value:**Boost your internal communication about the results of your trial programs.
⚙️ Use Cases:
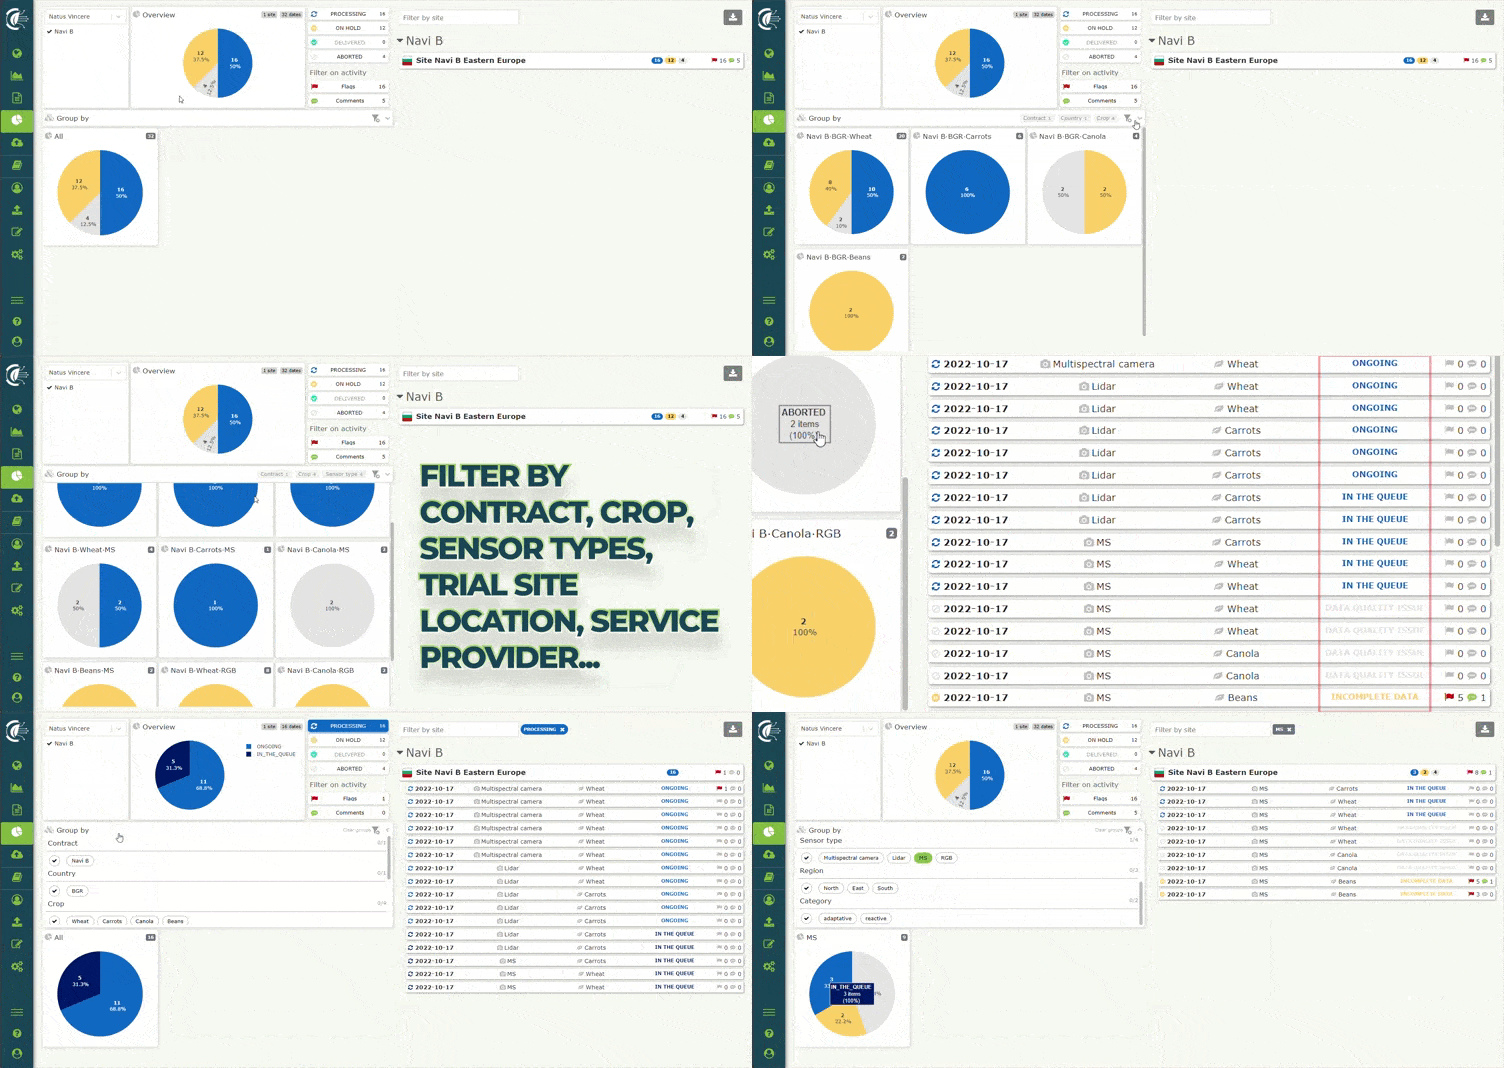
We have refreshed the design of the monitoring tool that keeps you informed of the data processing progress for each flight you upload. The page ergonomics has been improved and we added new filters based on your feedback. You can now group specific filters to get a more granular and custom progress tracking update. Filters include campaign, region, country, crop and sensor type.
You can also filter flags and comments posted by your Hiphen Campaign Manager in a more intuitive manner. This allows you to very efficiently focus on datasets that require your attention.
💎 User value: Get all the transparency you need about data processing progress, pinpoint flights that require attention and use this tracking tool for your own internal reporting.
⚙️ Use Cases:
In the map and analytics pages, at the top right corner of the map, enter a specific plot name in the search bar to pinpoint its position on the plot map and select it.
Once the search bar is used, we will automatically suggest you to add the plot of interest to the 'plot exploration' section of the analytics page.
**💎 User value:**Save time exploring specific plots of interest.
⚙️ Use Cases:
For more information, reach out to your Hiphen Campaign Manager. Stay tuned for the next Cloverfield™ features release update next month.
Sincerely, Your Hiphen Success Team.